---
title: "Measurement invariance"
author: ""
output:
html_document:
css: styles.css
theme: flatly
highlight: tango
toc: true
toc_float: true
code_folding: show
self_contained: true
vignette: >
%\VignetteIndexEntry{Measurement invariance}
%\VignetteEngine{knitr::rmarkdown}
%\VignetteEncoding{UTF-8}
---
```{r options,echo=FALSE,warning=FALSE,message=FALSE}
directory<-if (rstudioapi::isAvailable()) paste0(dirname(rstudioapi::getActiveDocumentContext()$path),"/") else ""
source(paste0(directory, "R/code_options.R"))
source(paste0(directory, "R/code_rwf.R"))
```
# CFA measurement invariance
## Data simulation
The data are simulated in lavaan. From this simulation it is possible to extract 3 factors and 2 arbitrary groups.
```{r,simulation}
# specify population model
population_model<-'f1=~x1+.6*x2+.7*x3
                   f2=~x4+.6*x5+.7*x6
                   f3=~x7+.6*x8+.7*x9'
# generate data
set.seed(1234)
model_data<-lavaan::simulateData(population_model,sample.nobs=20000)
model_data$group<-NA
model_data[1:10000,]$group<-"Group1"
model_data[10001:20000,]$group<-"Group2"
```
## Data summary
```{r,summary}
cdf(model_data,name_length=5)
```
## Model specification
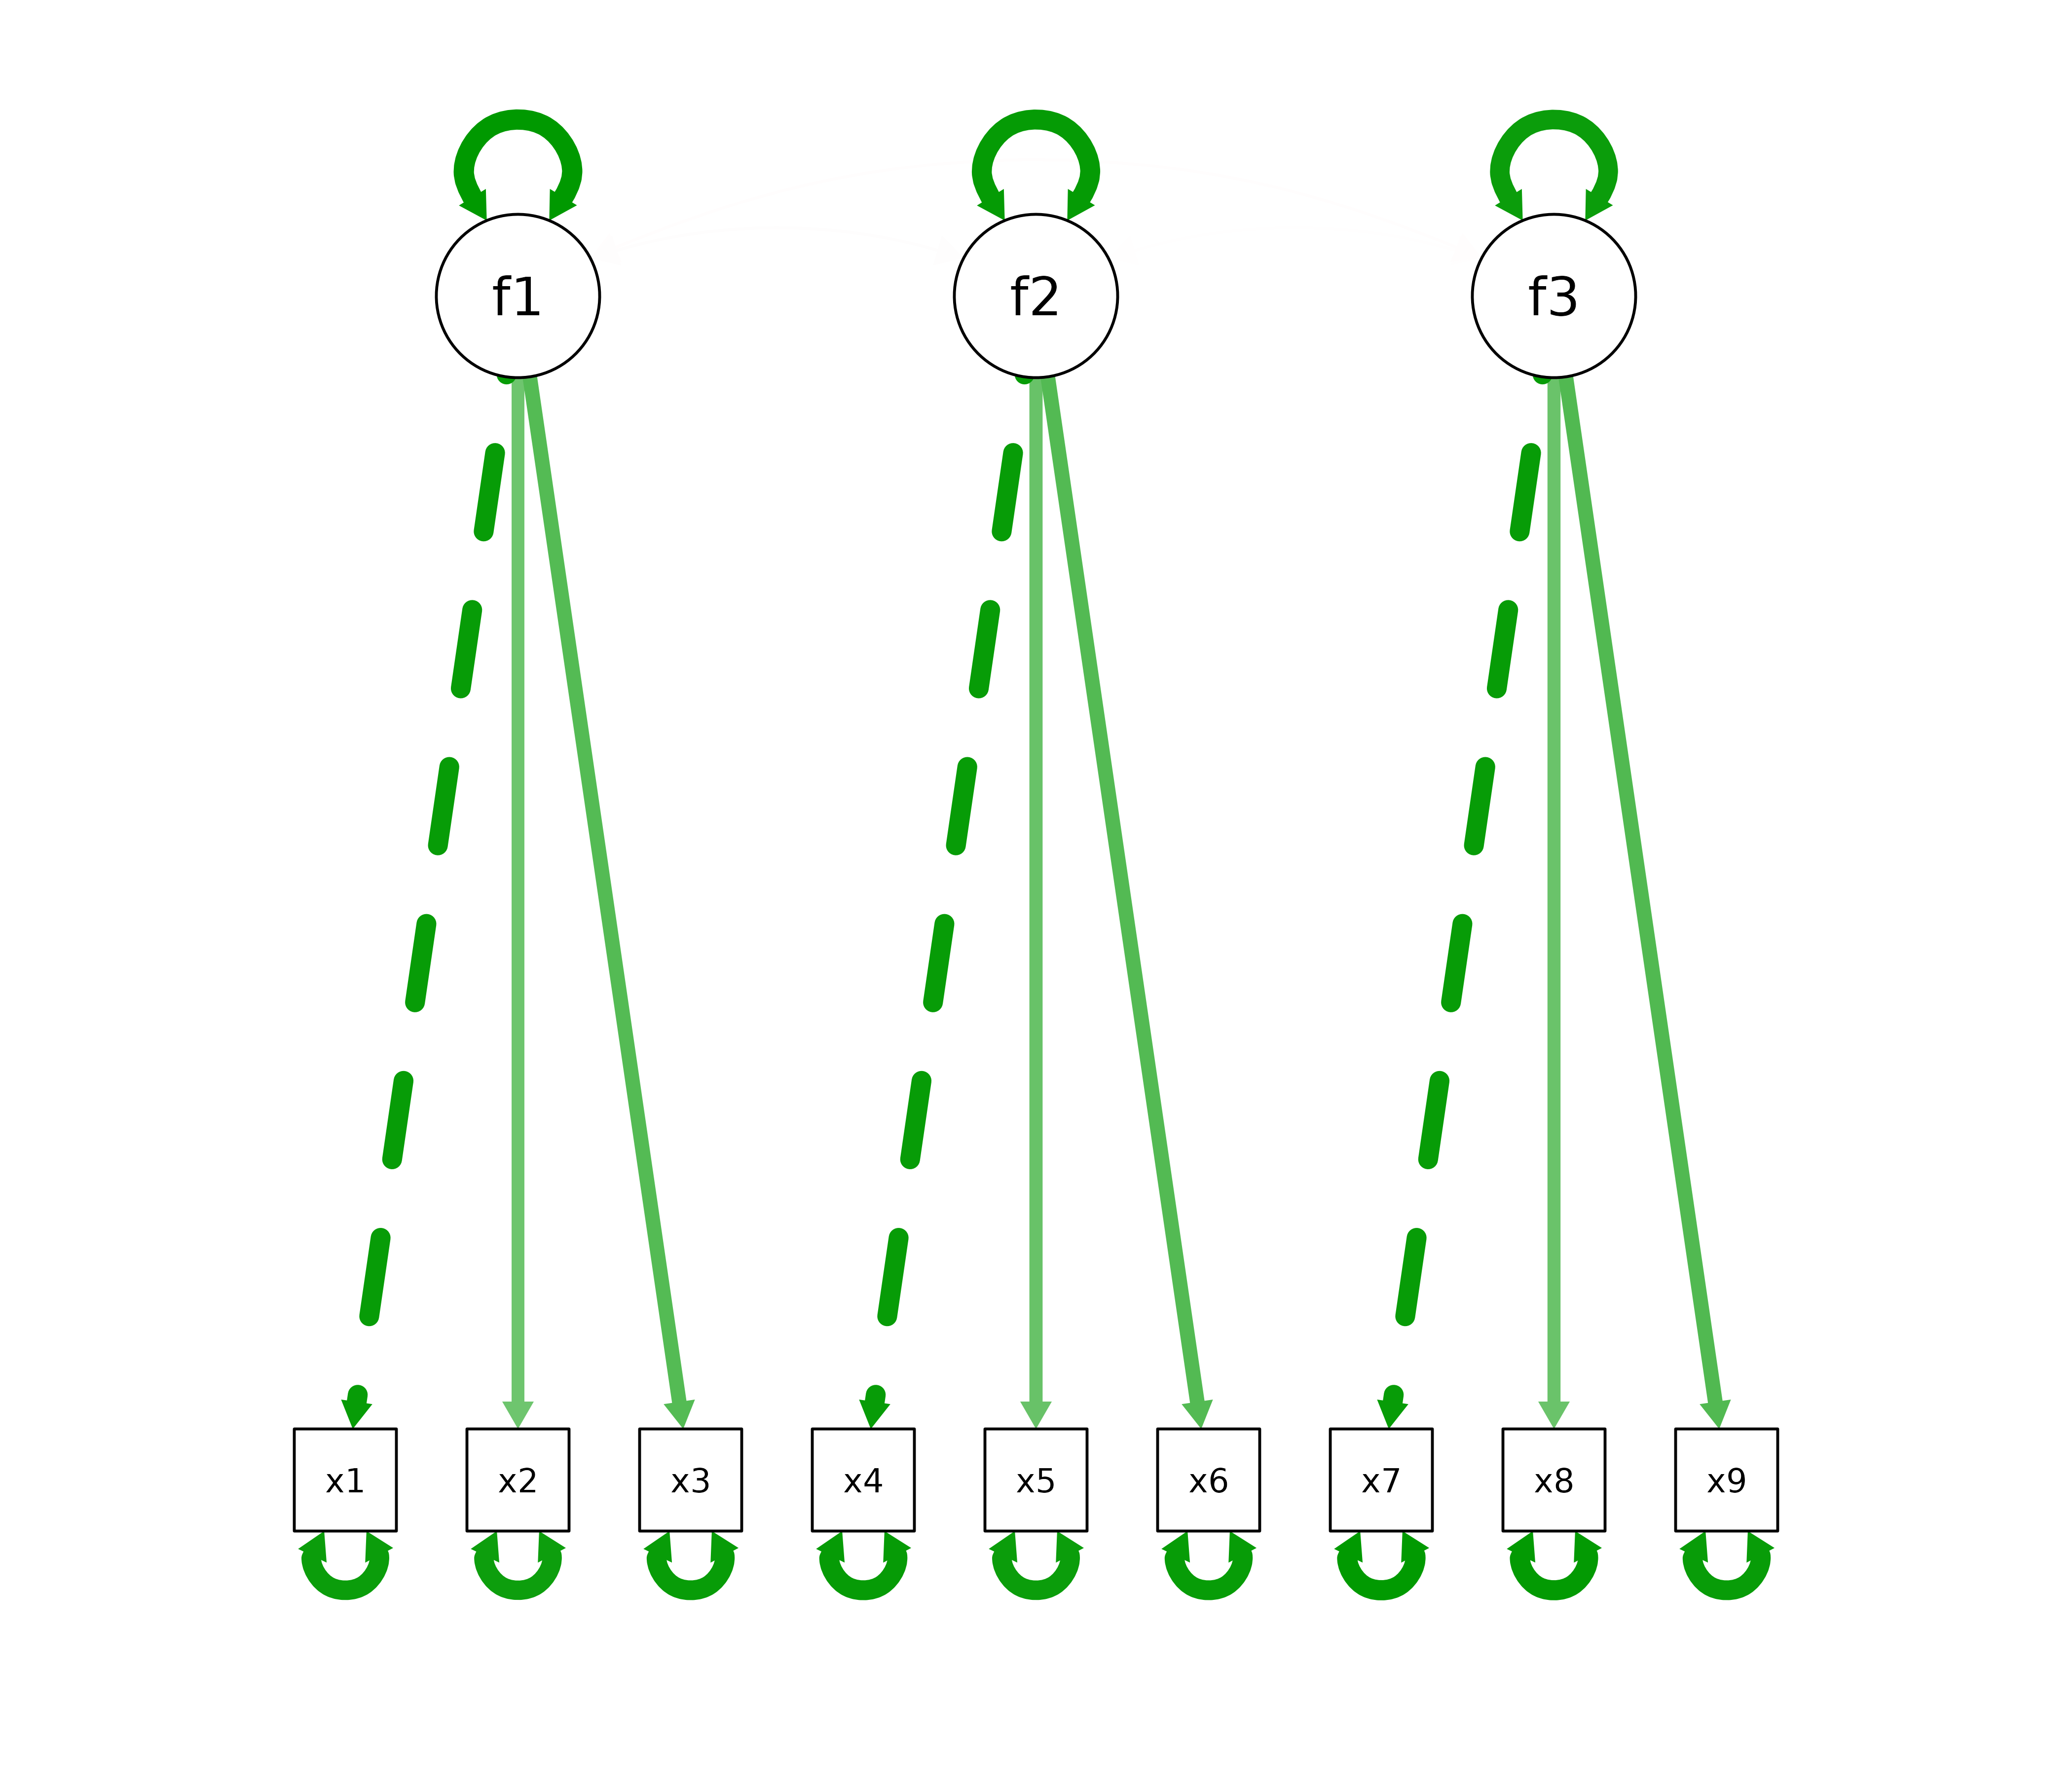
The specified model is shown in the figure below.
```{r,spesification,out.width="1000px",out.height="500px",fig.retina=2}
bf_model<-'f1=~x1+x2+x3
           f2=~x4+x5+x6
           f3=~x7+x8+x9'
cat(bf_model)
bfa<-lavaan::cfa(bf_model,data=model_data)
semPlot::semPaths(bfa,"model",layout="tree2",what="est")
```
## Model estimates and model fit
Model estimates are provided by three main matrices: <br/>
1. The lambda matrix representing factor loadings <br/>
2. The theta matrix, containing residual (error) variances of the items on the diagonal and residual covariances between items off the diagonal <br/>
3. The psi matrix, containing factor variances on the diagonal and factor covariances off the diagonal <br/>
Model estimates from a converged CFA model reproduce a model-implied covariance matrix, Sigma = Lambda × Psi × Lambda' + Theta. A covariance matrix can also be computed directly from the item responses (the observed, sample covariance matrix). Because of that, we can compare the covariance matrix implied by the model and the covariance matrix computed from item responses. In a good model, these two matrices should have similar values. Fit indices, shown below, quantify model fit. There is conflicting information and several opinions on critical values of fit indices. In our case we consider good model fit to be indicated by: <br/>
1. RMSEA < .07 <br/>
2. CFI > .90 (acceptable; > .95 good) <br/>
3. TLI > .90 (acceptable; > .95 good) <br/>
4. SRMR < .08 <br/>
5. GFI > .95 <br/>
```{r,fit}
lavaan::fitMeasures(bfa,c("rmsea","cfi","tli","rni","rfi","ifi","srmr","gfi"))
lavaan::inspect(bfa,"est",add.labels=TRUE,add.class=TRUE,list.by.group=TRUE,drop.list.single.group=TRUE)
```
# Testing for invariance
We first fit the model separately in each group, then fit a series of multi-group models with increasing equality constraints; if constraining lambda, nu (intercepts), theta or psi to be equal significantly worsens fit, the measurement is non-invariant at that level.
## Separate-group baseline models
Before testing invariance, we fit the model separately to Group1 and Group2 to check that it fits acceptably in each group (separate-group baseline models).
```{r,structural_invariance}
# Model with the first group responses
ft<-lavaan::cfa(bf_model,data=model_data[model_data$group %in% "Group1",])
# Model with the second group responses
st<-lavaan::cfa(bf_model,data=model_data[model_data$group %in% "Group2",])
data.frame(Group1=lavaan::fitMeasures(ft,c("rmsea","cfi","tli","rni","rfi","ifi","srmr","gfi")),
           Group2=lavaan::fitMeasures(st,c("rmsea","cfi","tli","rni","rfi","ifi","srmr","gfi")))
```
## Test for CONFIGURAL INVARIANCE
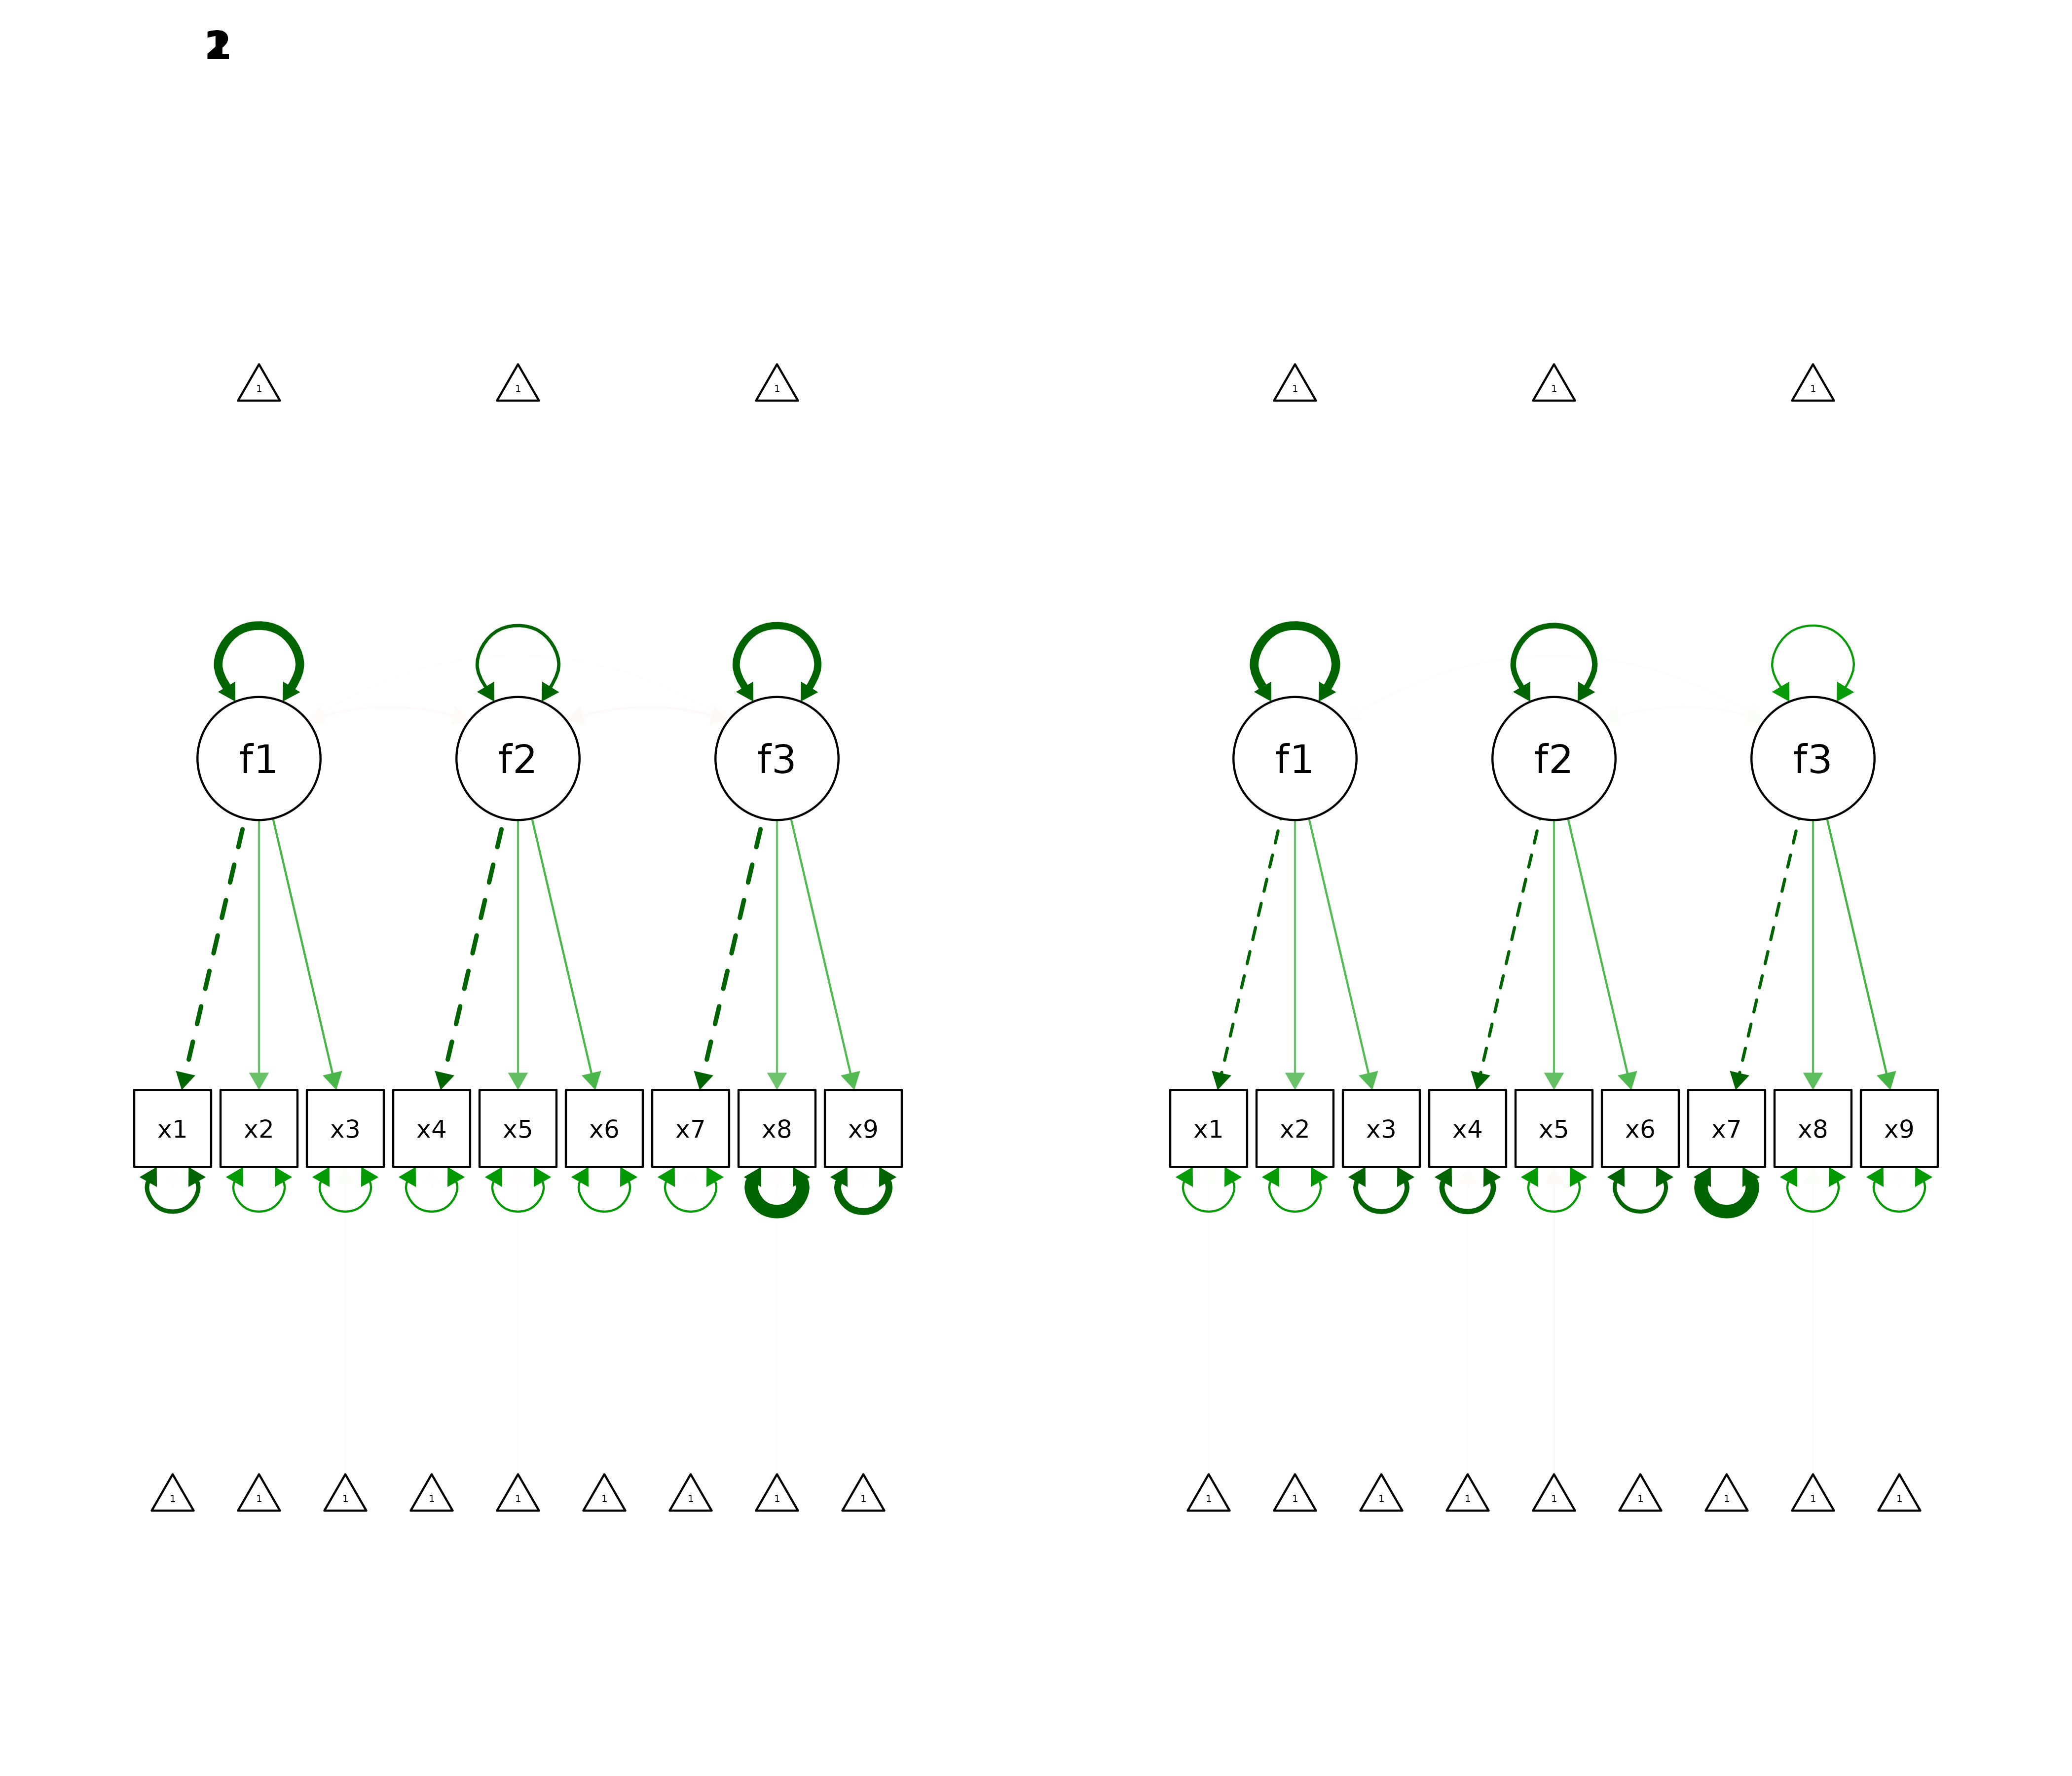
For configural invariance we specify a model with 2 groups. This procedure estimates separate lambda, theta, psi and nu (item intercept) matrices for each group, with latent means (alpha) fixed to 0. By comparing the two lambda and theta matrices we notice that their values are not identical. The question is whether the differences between these values are statistically significant. In any case, the configural invariance model below displays similar fit indices compared with the separate-group models above. But more importantly, according to fit indices the model fits the data and this suggests configural invariance.
```{r,configural_invariance,out.width="1000px",out.height="500px",fig.retina=2}
# CONFIGURAL INVARIANCE
bf<-lavaan::cfa(bf_model,data=model_data,group="group")
lavaan::fitMeasures(bf,c("rmsea","cfi","tli","rni","rfi","ifi","srmr","gfi"))
lavaan::inspect(bf,"est",add.labels=TRUE,add.class=TRUE,list.by.group=TRUE,drop.list.single.group=TRUE)
par(mfrow=c(1,2))
semPlot::semPaths(bf,"model",layout="tree2",what="est")
```
In order to test if differences between estimated matrices among models are significant, we have to create a series of models for which impose equality constraints for parameters between groups. By imposing constraints we impose the estimator procedure to keep a matrix between groups equal. For instance by imposing an equality constraint on loadings, we force the parameter estimator to produce models that have equal lambda matrices between groups. Finally we compare the unconstrained and constrained models to see if they have any differences. If the constrained model does not fit significantly worse (and ΔCFI ≤ .01; Cheung & Rensvold, 2002), invariance at that level is supported.
## Test for WEAK METRIC INVARIANCE
For weak metric invariance we impose a restriction that groups have equal loadings.
```{r,weak_metric_invariance}
# WEAK METRIC INVARIANCE
bf_metric<-lavaan::cfa(bf_model,data=model_data,group="group",group.equal=c("loadings"))
lavaan::anova(bf,bf_metric)
```
## Test for STRONG SCALAR INVARIANCE
For strong scalar invariance we impose the restriction that groups have equal loadings and intercepts and then compare the strong scalar invariance model with the weak metric invariance model.
```{r,strong_scalar_invarience}
# STRONG SCALAR INVARIANCE
bf_scalar<-lavaan::cfa(bf_model,data=model_data,group="group",group.equal=c("loadings","intercepts"))
lavaan::anova(bf_metric,bf_scalar)
```
## Test for STRICT ERROR VARIANCE INVARIANCE
For strict error variance invariance, we impose the restriction that groups have equal loadings intercepts and residuals.
```{r,strict_error_invariance}
# STRICT ERROR VARIANCE INVARIANCE
bf_full_strict<-lavaan::cfa(bf_model,data=model_data,group="group",group.equal=c("loadings","intercepts","residuals"))
lavaan::anova(bf_scalar,bf_full_strict)
```
## Test for FACTOR VARIANCE COVARIANCE
For factor variance covariance invariance we impose the restriction that groups have equal loadings intercepts residuals latent variable variances and latent variable covariances.
```{r,factor_variance_covariance}
# FACTOR VARIANCE COVARIANCE
bf_factor_vc<-lavaan::cfa(bf_model,data=model_data,group="group",group.equal=c("loadings","intercepts","residuals","lv.variances","lv.covariances"))
lavaan::anova(bf_full_strict,bf_factor_vc)
```
## Test for FACTOR MEAN INVARIANCE
For factor mean invariance we impose the restriction that groups have equal loadings intercepts and residuals and we impose the restriction that factors have equal variances covariances and means between groups.
```{r,factor_mean_invariance}
# FACTOR MEAN INVARIANCE
bf_factor_mean<-lavaan::cfa(bf_model,data=model_data,group="group",group.equal=c("loadings","intercepts","residuals","lv.variances","lv.covariances","means"))
lavaan::anova(bf_factor_vc,bf_factor_mean)
```
## Comparing models
Finally we compare the nested models with sequential chi-square difference (likelihood-ratio) tests; p-values (Pr(>Chisq)) above .05 indicate that the added equality constraints do not significantly worsen fit, supporting that level of invariance.
```{r,compare_models}
lavaan::anova(bf,bf_metric,bf_scalar,bf_full_strict,bf_factor_vc,bf_factor_mean)
```
In addition, the fit indices for each model above are summarized below.
```{r,fit_indices}
findex<-c("rmsea","cfi","tli","rni","rfi","ifi","srmr","gfi")
fit_indices<-data.frame(rbind(lavaan::fitMeasures(bf,findex),
                              lavaan::fitMeasures(bf_metric,findex),
                              lavaan::fitMeasures(bf_scalar,findex),
                              lavaan::fitMeasures(bf_full_strict,findex),
                              lavaan::fitMeasures(bf_factor_vc,findex),
                              lavaan::fitMeasures(bf_factor_mean,findex)))
row.names(fit_indices)<-c("CONFIGURAL INVARIANCE",
                          "WEAK METRIC INVARIANCE",
                          "STRONG SCALAR INVARIANCE",
                          "STRICT ERROR VARIANCE INVARIANCE",
                          "FACTOR VARIANCE COVARIANCE",
                          "FACTOR MEAN INVARIANCE")
fit_indices
```