Writes one or more plot objects to a multi-page PDF file using
cairo_pdf, optionally also printing them to the
active graphics device.
Usage
report_pdf(
  ...,
  plotlist = NULL,
  file = NULL,
  title = NULL,
  w = 10,
  h = 10,
  print_plot = TRUE
)
Arguments
- ...
Plot objects passed directly (ggplot or recorded plots).
- plotlist
A list of plot objects. Combined with any plots passed via
....- file
Character or
NULL. Output filename without extension. IfNULL, no PDF is written. Default isNULL.- title
Character or
NULL. Optional suffix appended tofile(separated by an underscore) to form the final filename. Default isNULL.- w
Numeric. Width of the PDF in inches. Default is
10.- h
Numeric. Height of the PDF in inches. Default is
10.- print_plot
Logical. If
TRUE, plots are also printed to the active graphics device. Default isTRUE.
Examples
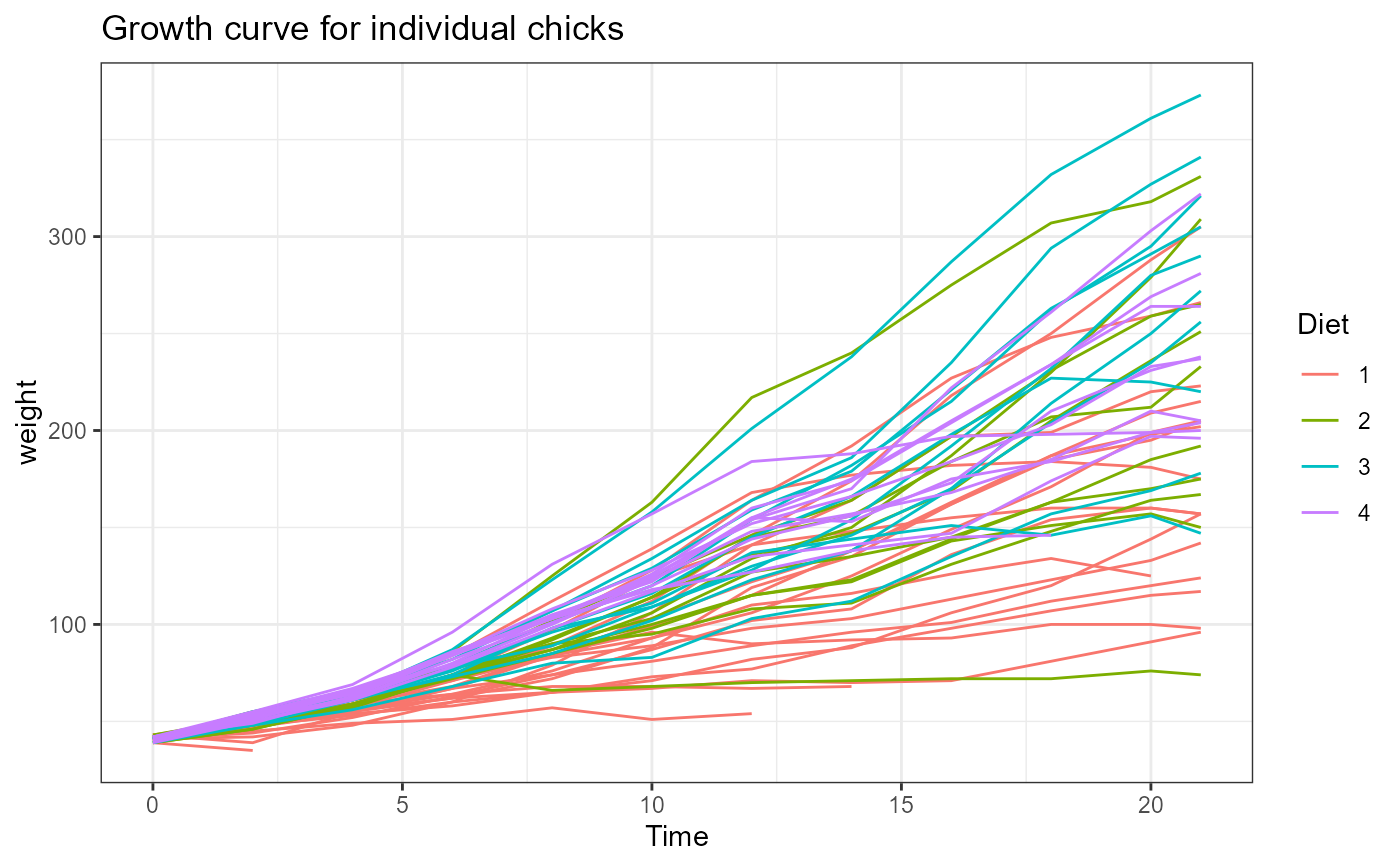
p1 <- ggplot(ChickWeight, aes(x = Time, y = weight, colour = Diet, group = Chick)) +
geom_line() +
ggtitle("Growth curve for individual chicks") +
theme_bw()
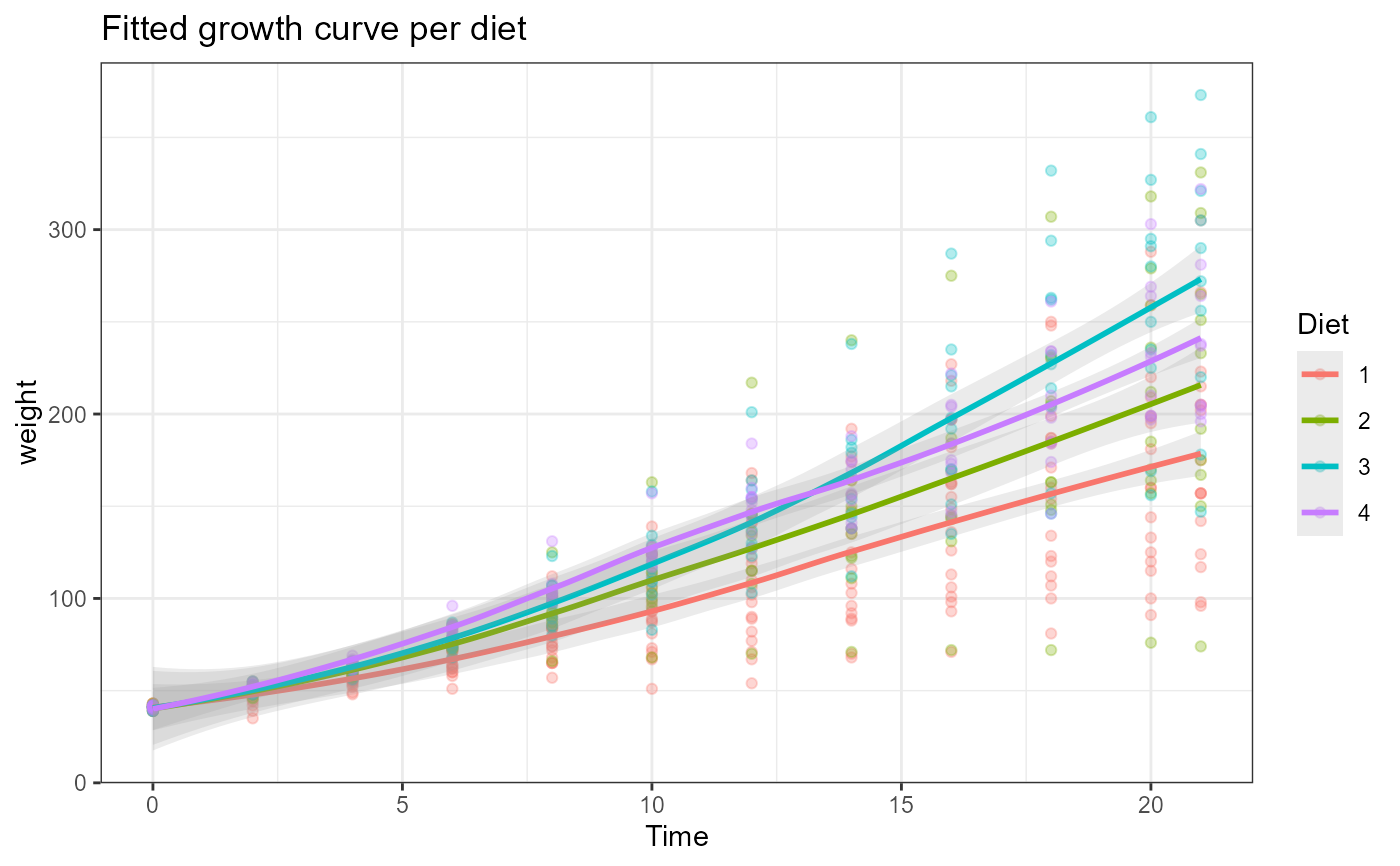
p2 <- ggplot(ChickWeight, aes(x = Time, y = weight, colour = Diet)) +
geom_point(alpha = .3) +
geom_smooth(alpha = .2, size = 1, method = "loess", formula = "y~x") +
ggtitle("Fitted growth curve per diet") +
theme_bw()
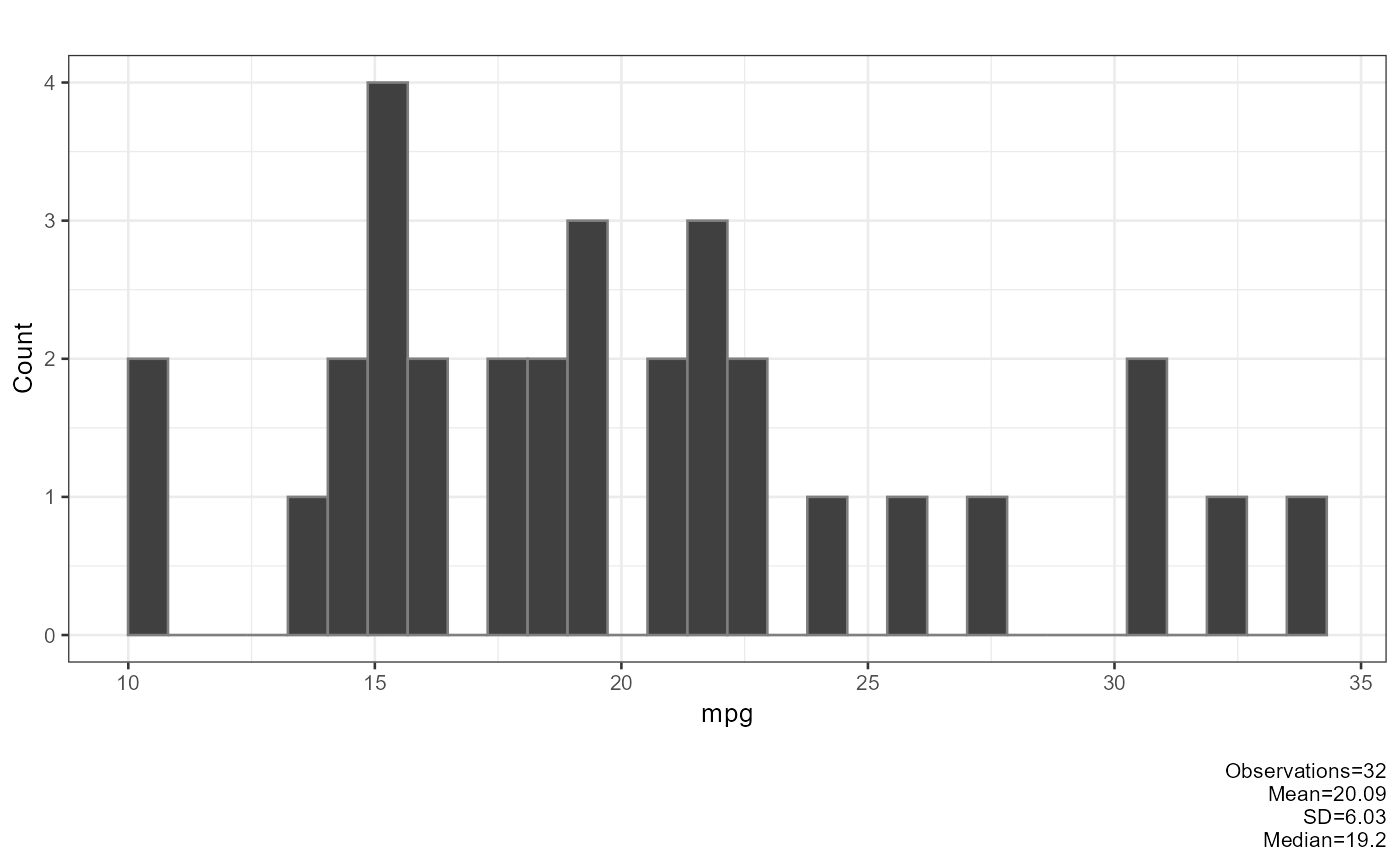
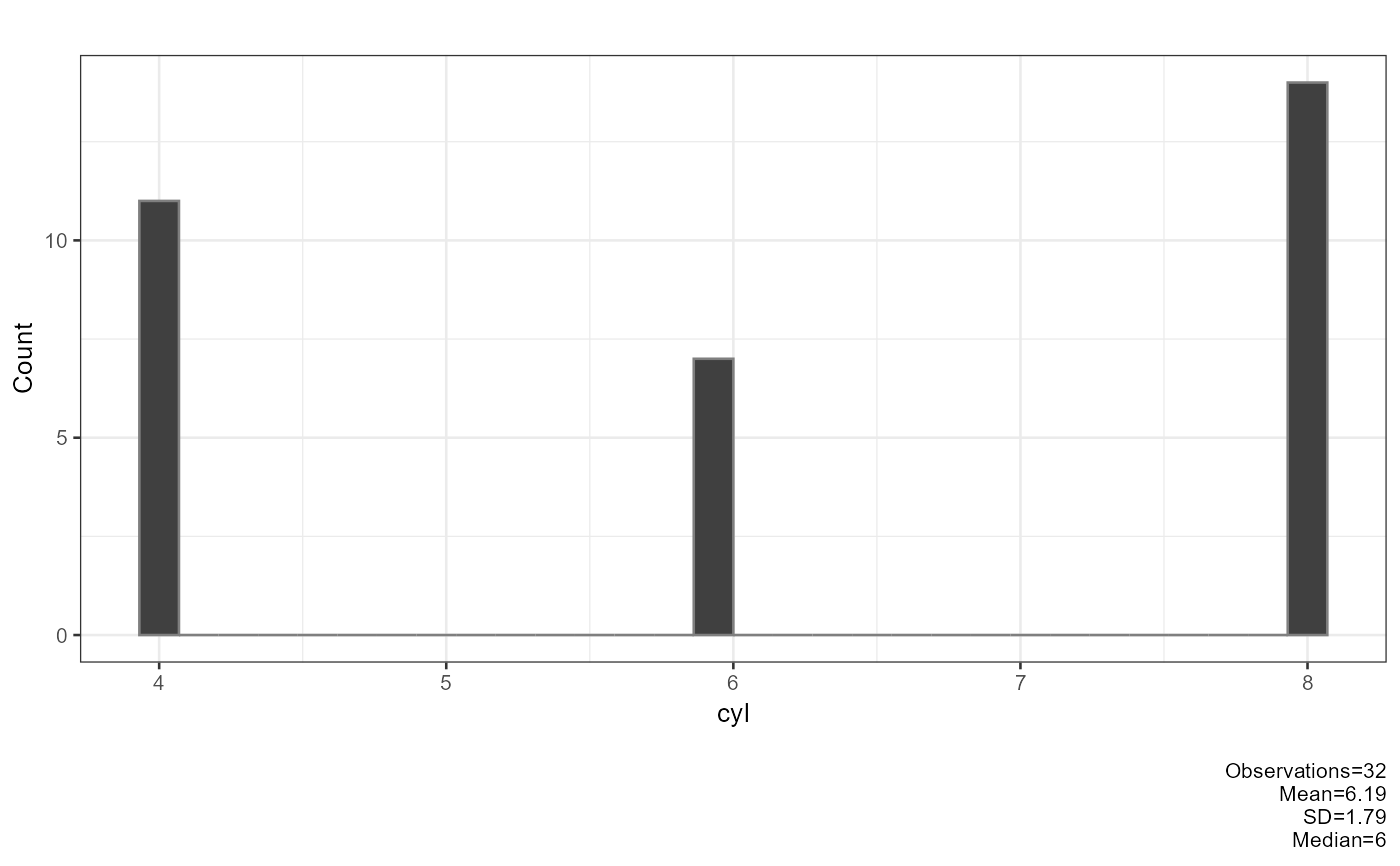
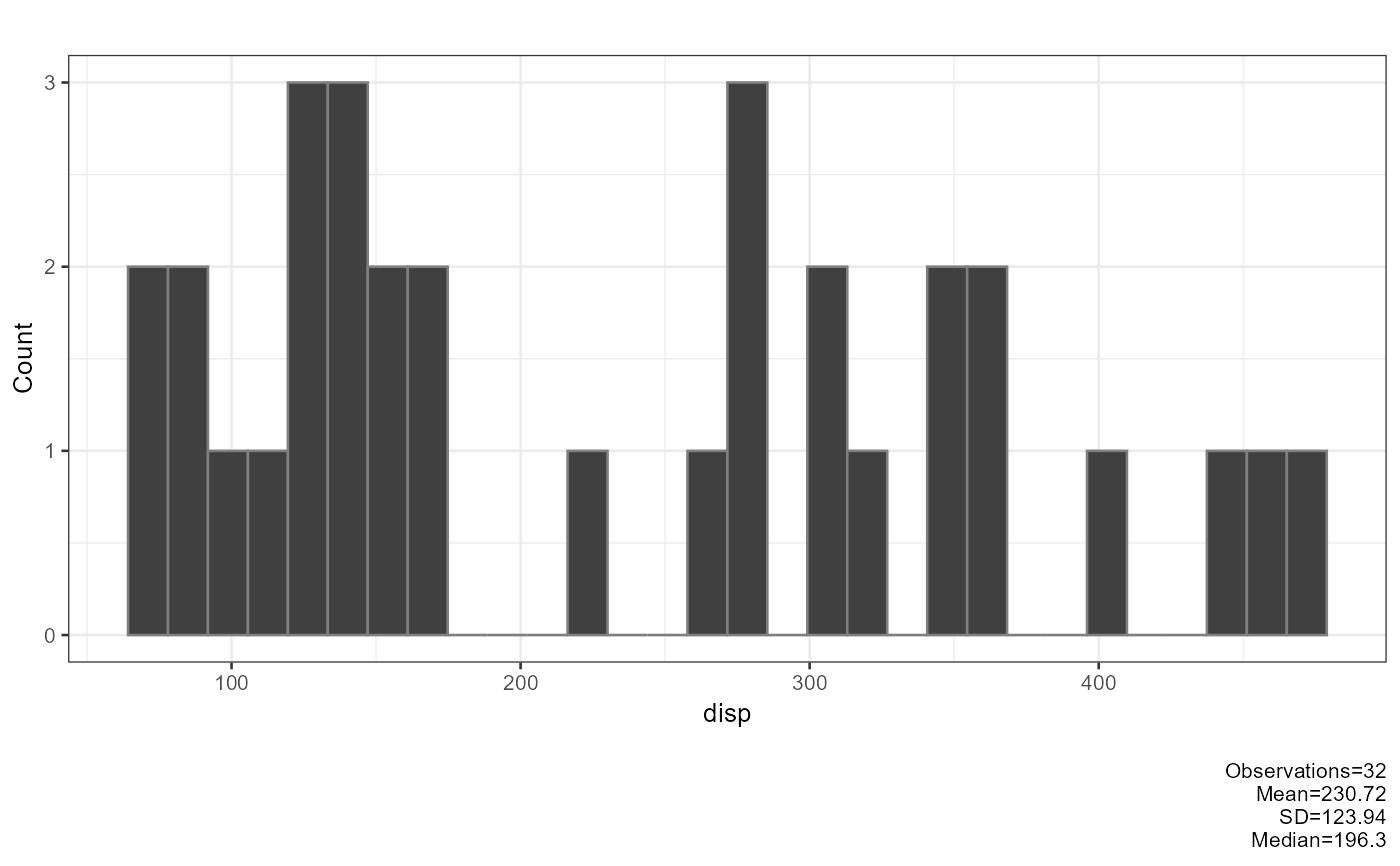
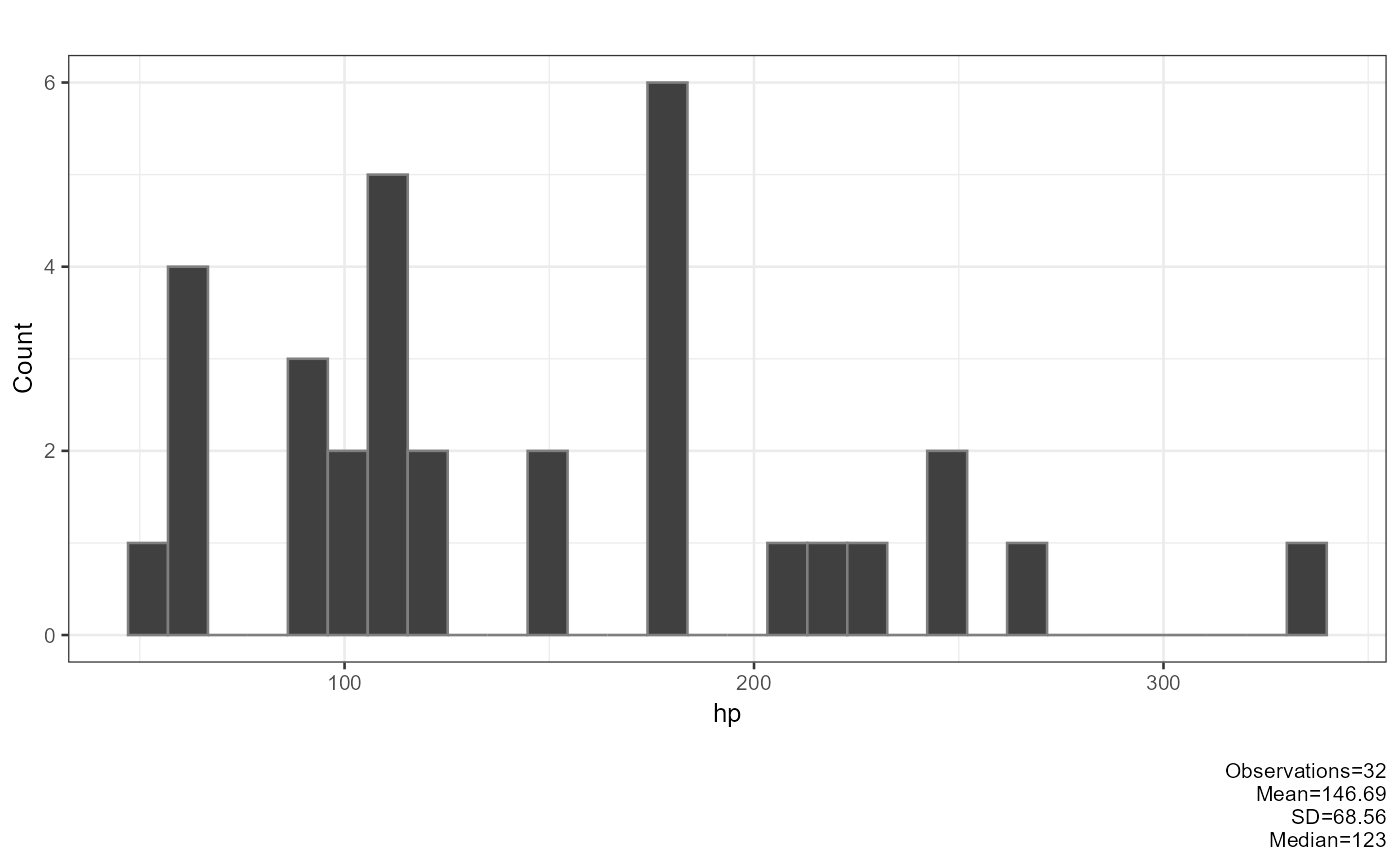
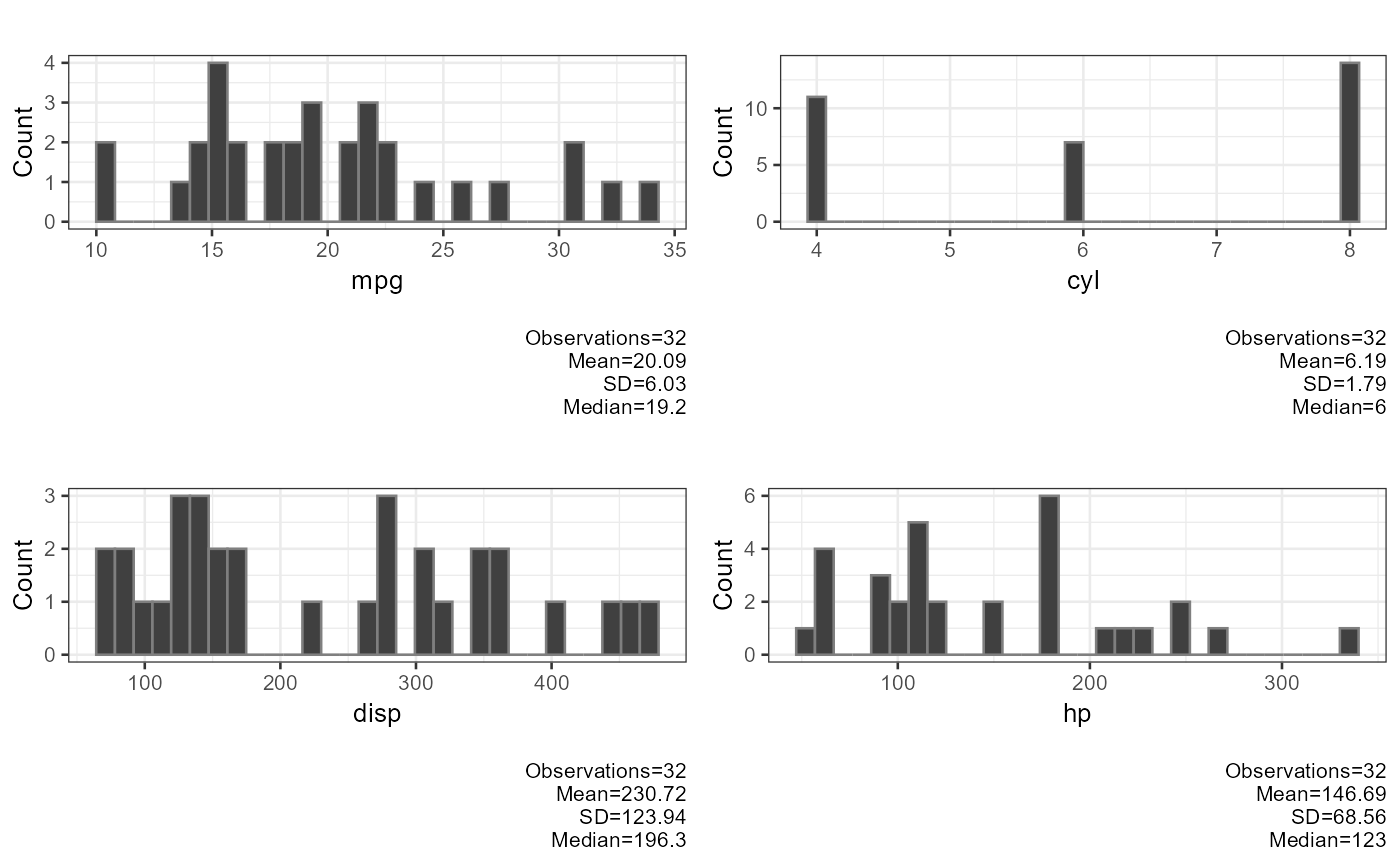
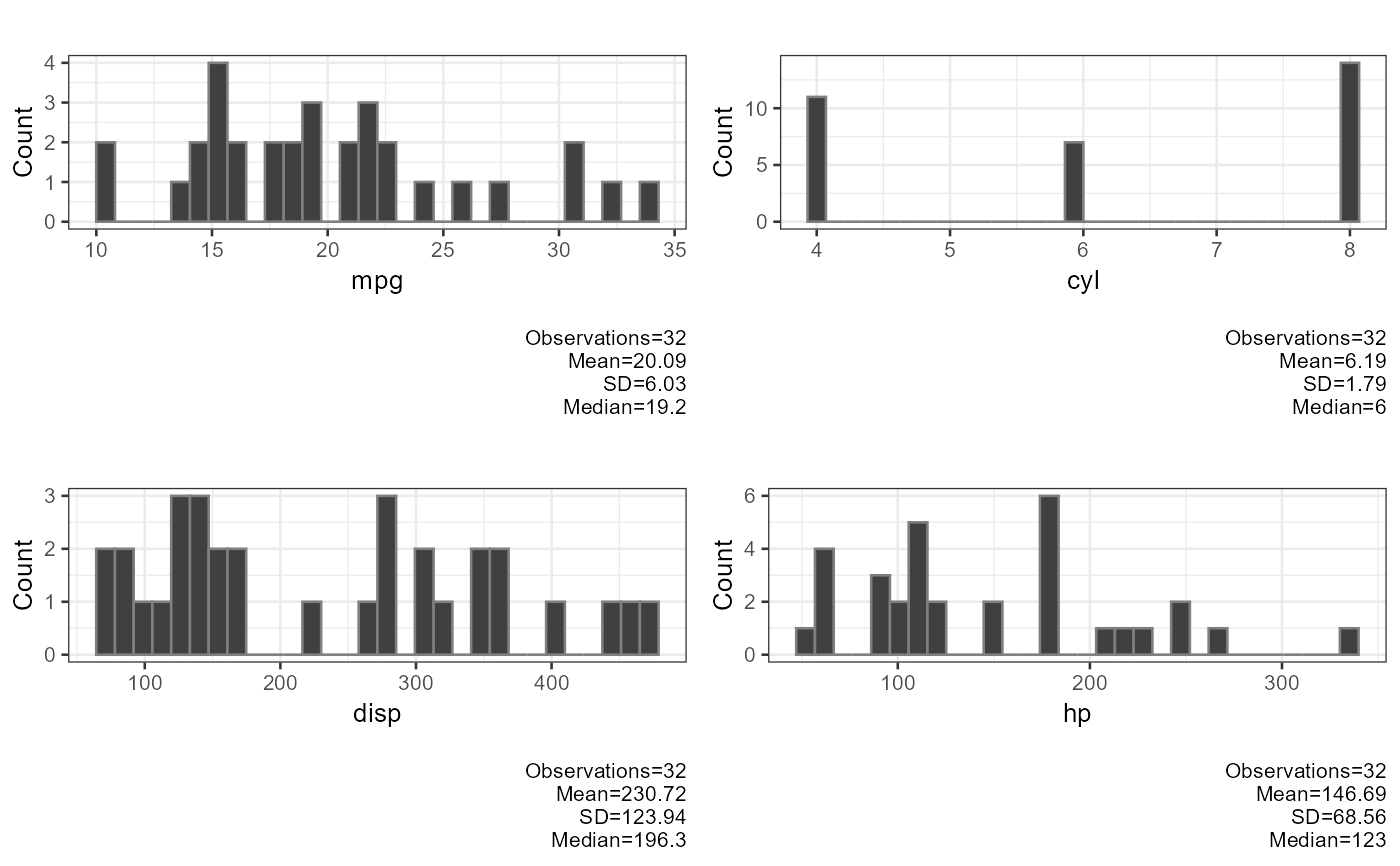
cars_plot_multiplot <- plot_multiplot(plotlist = plot_histogram(mtcars[, 1:4]), cols = 2)
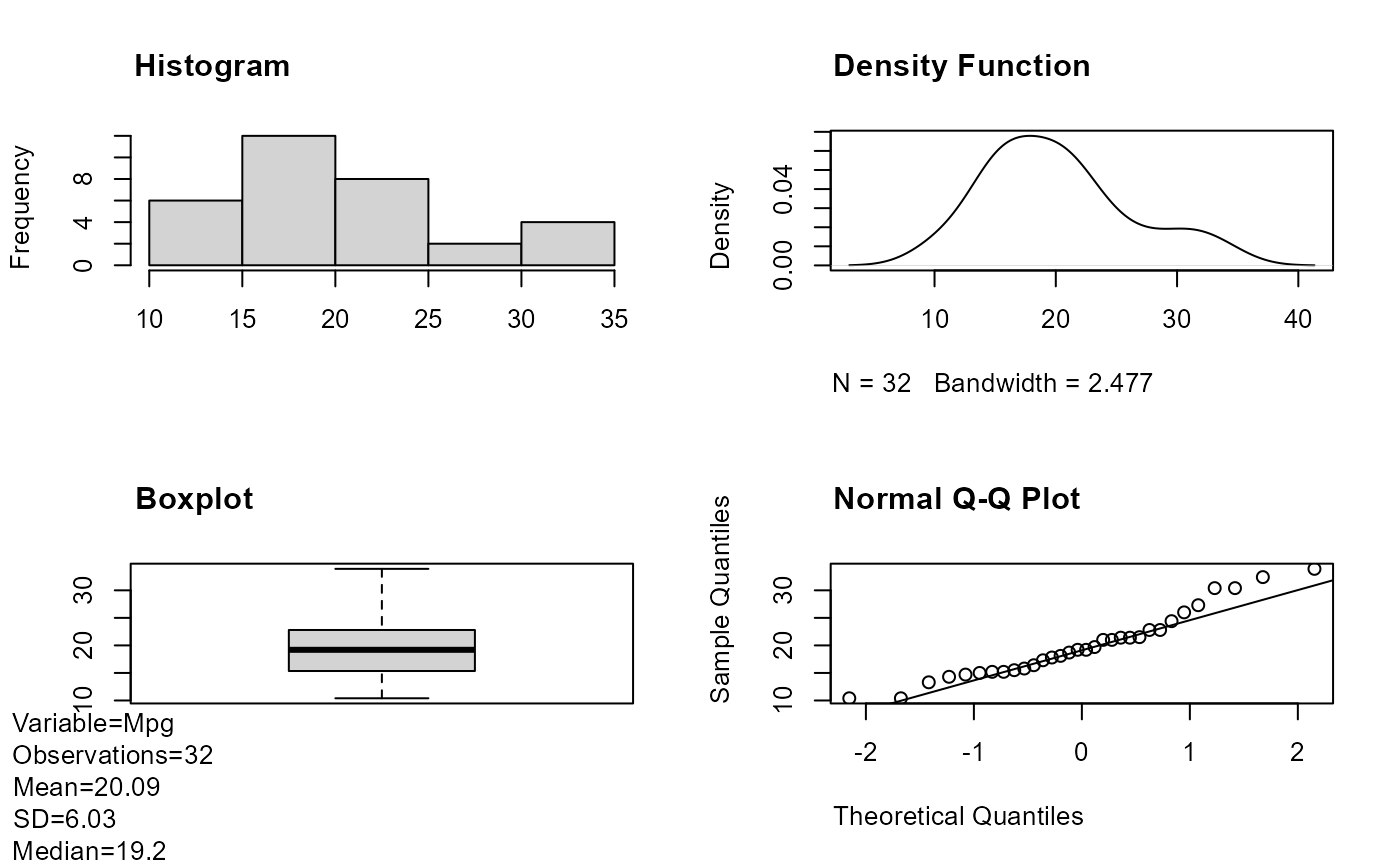
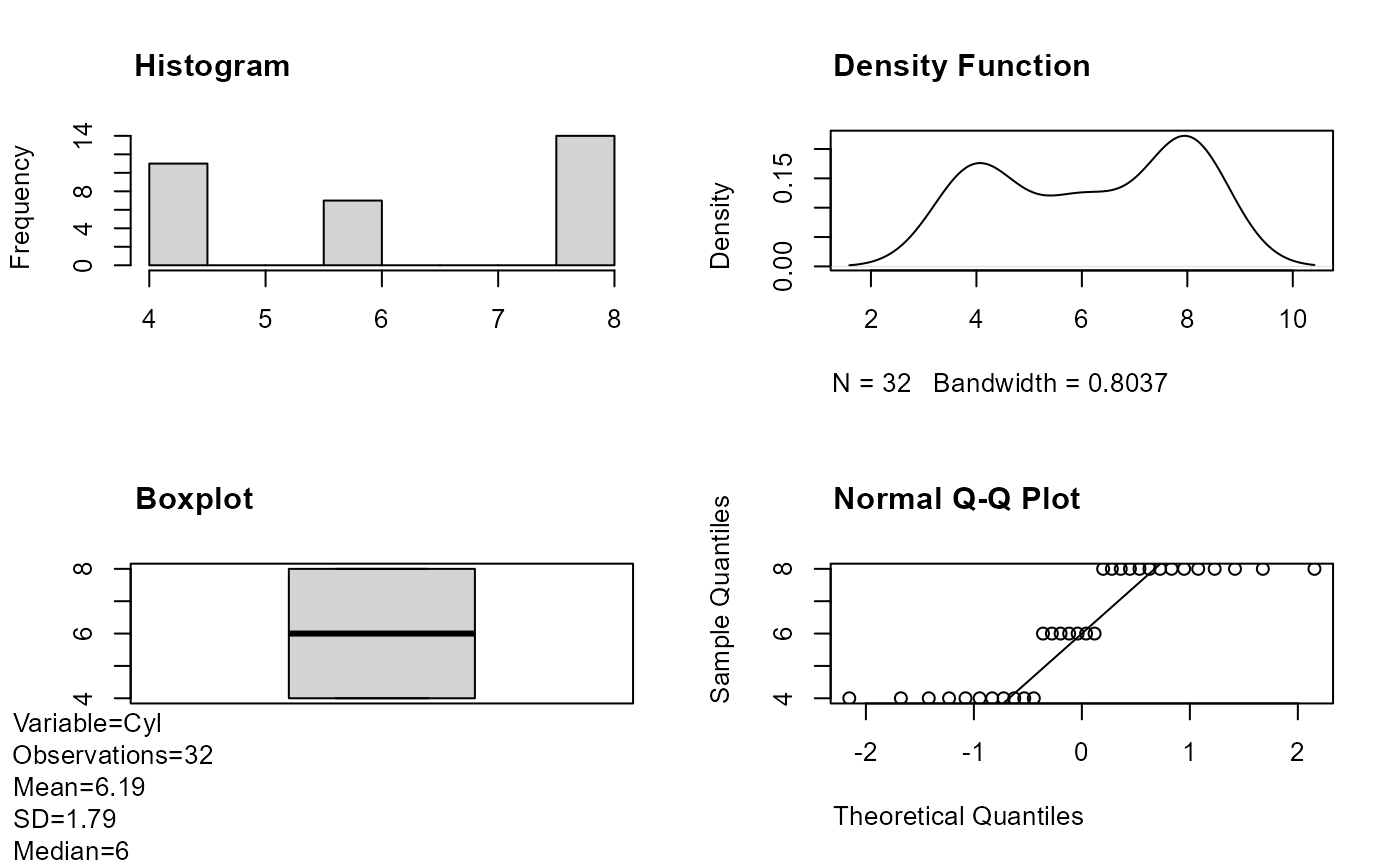
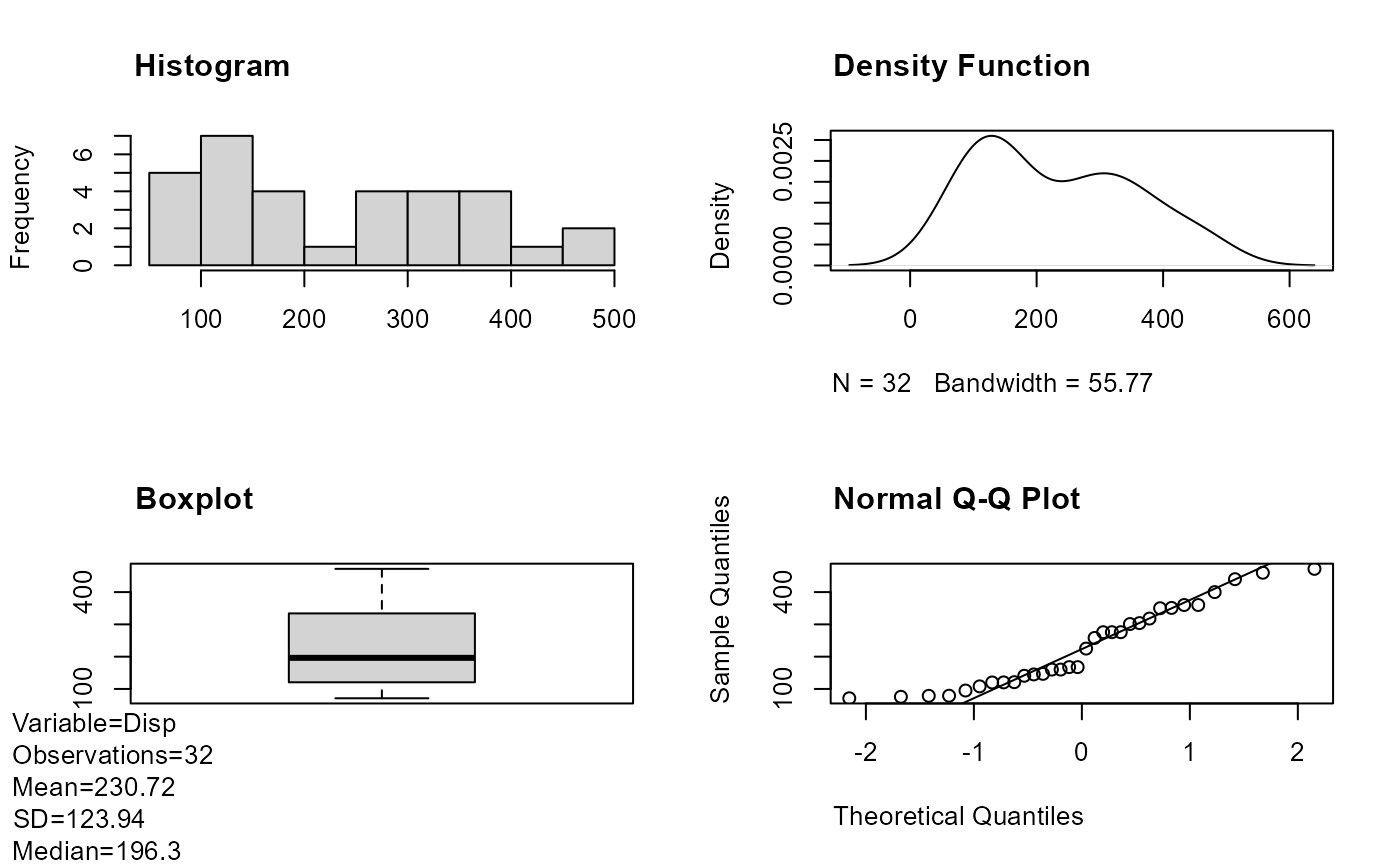
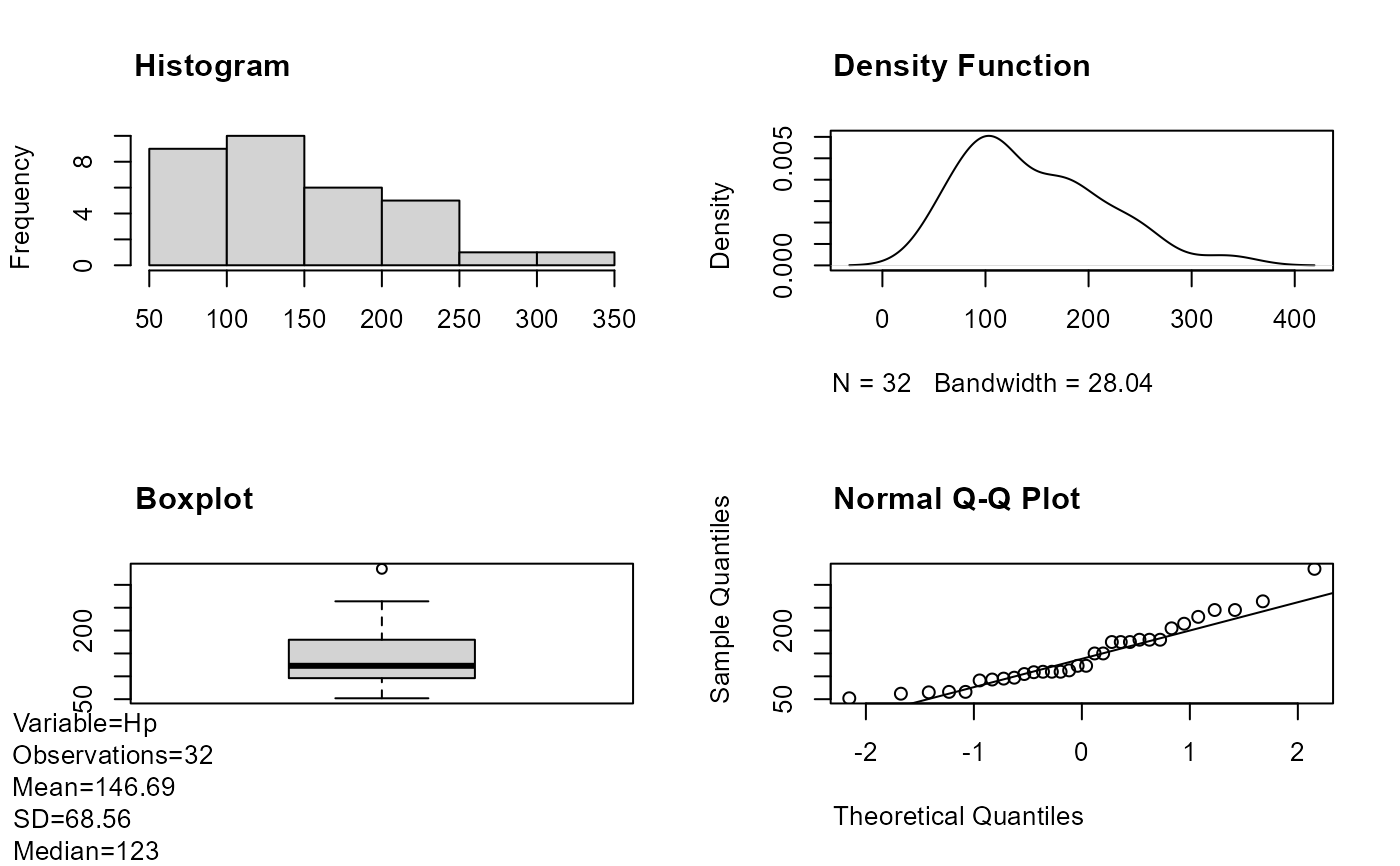
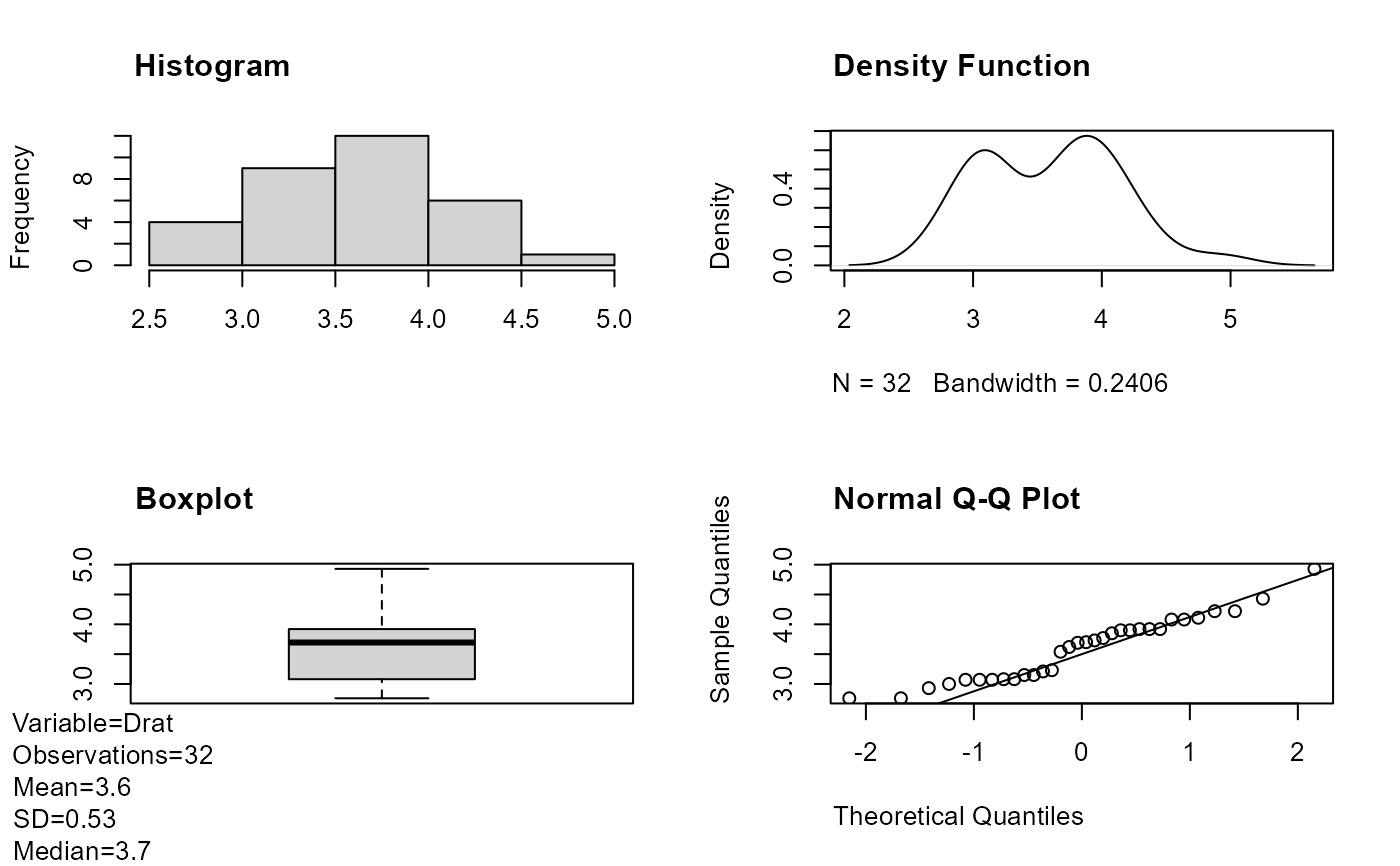
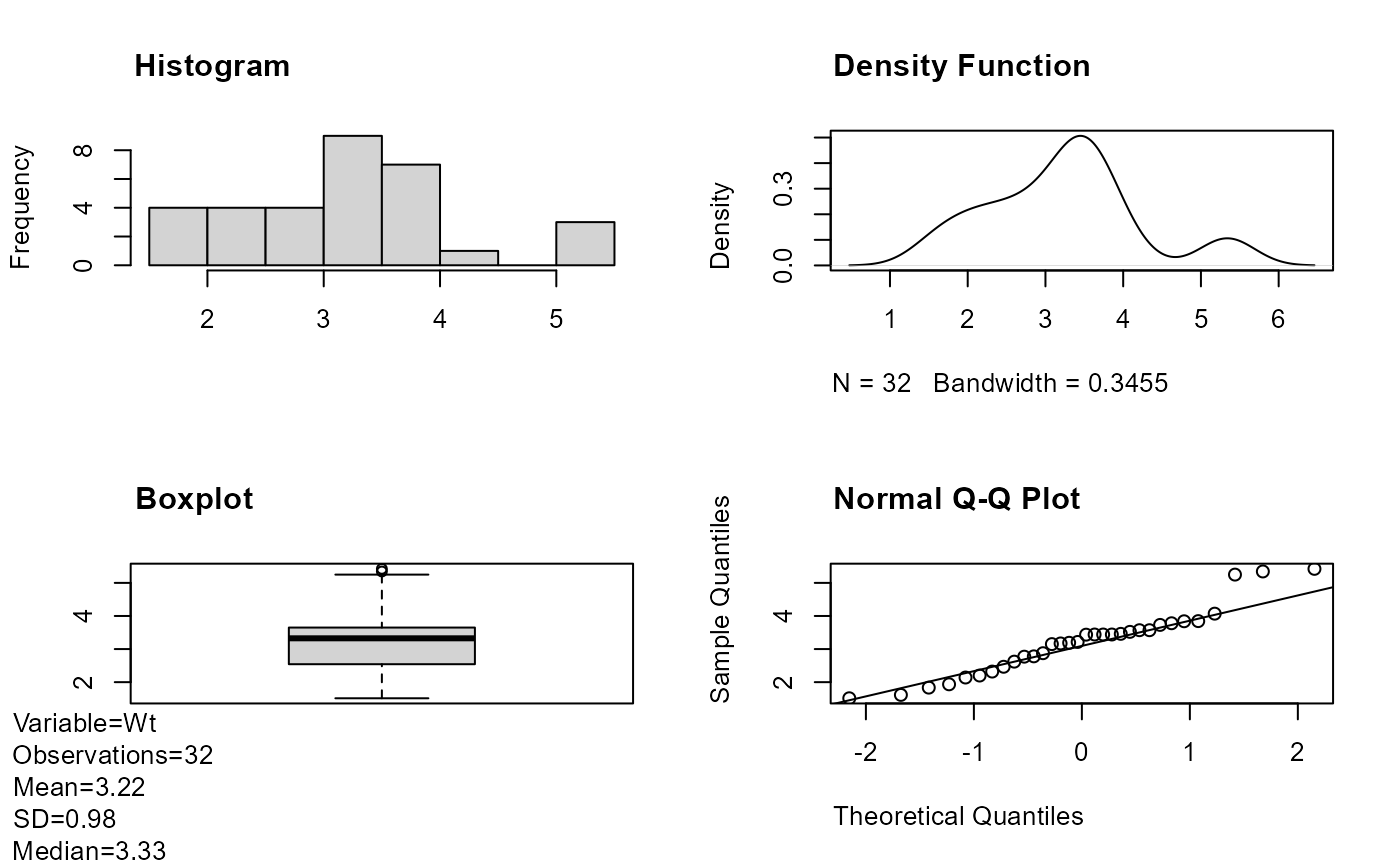
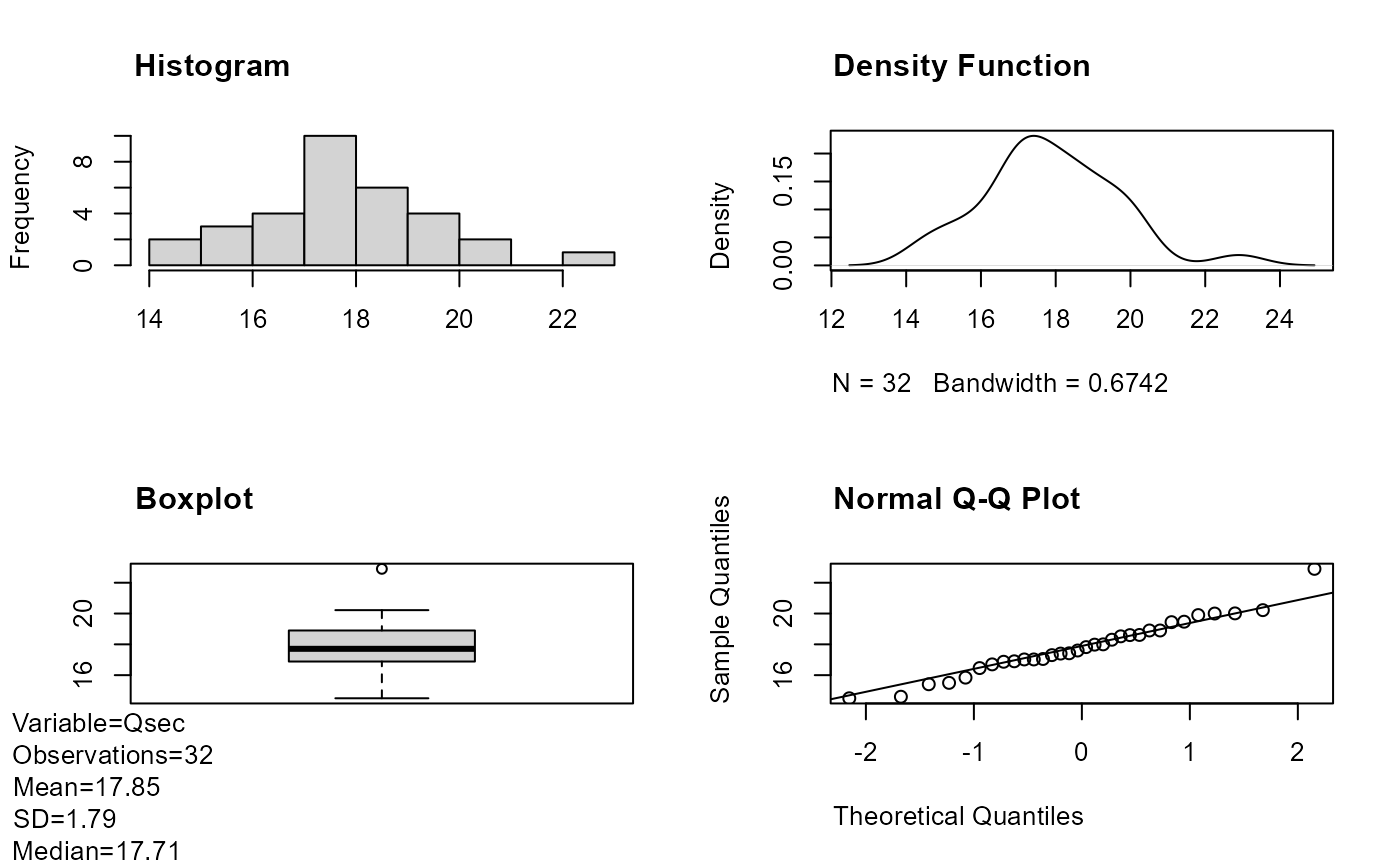
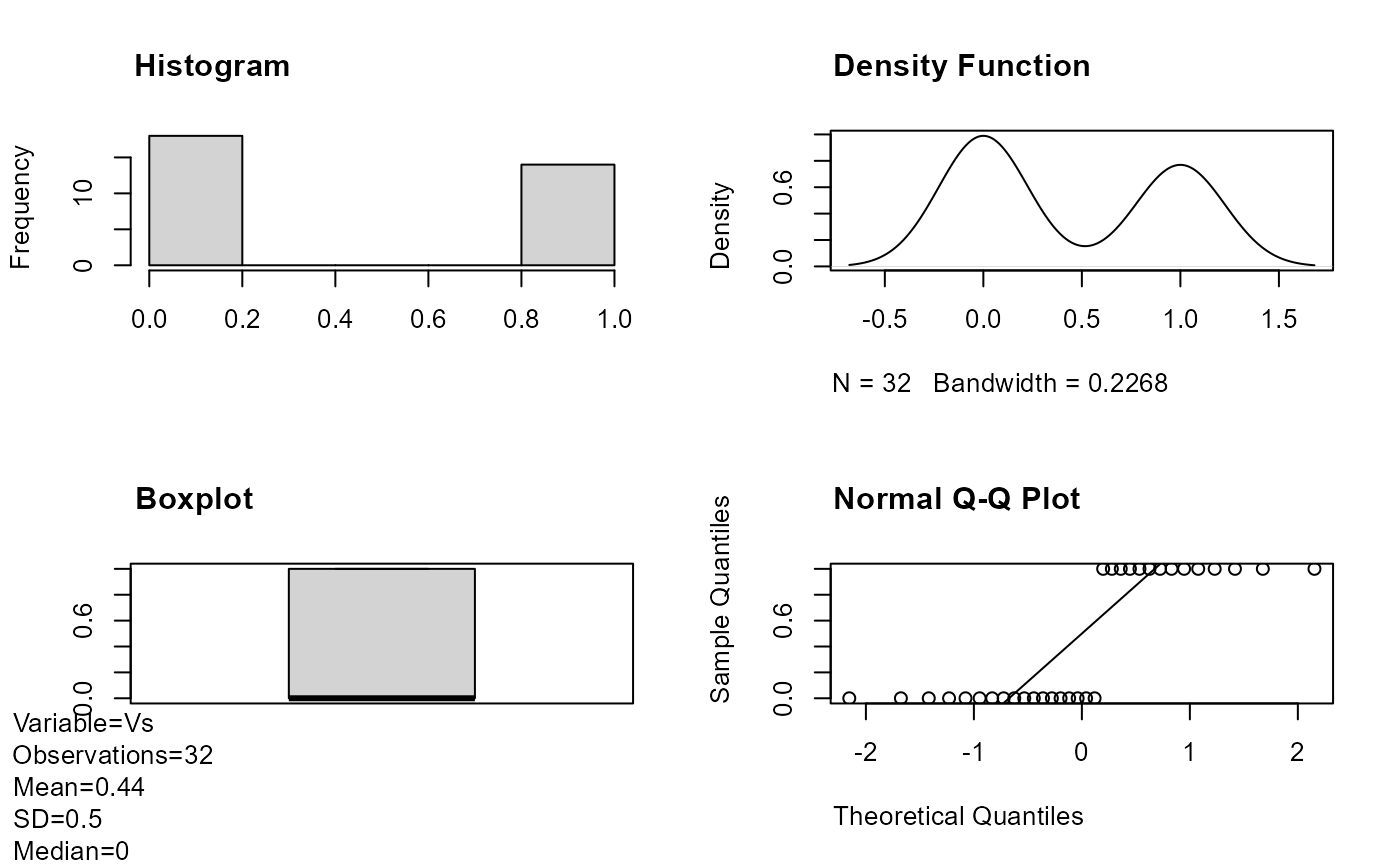
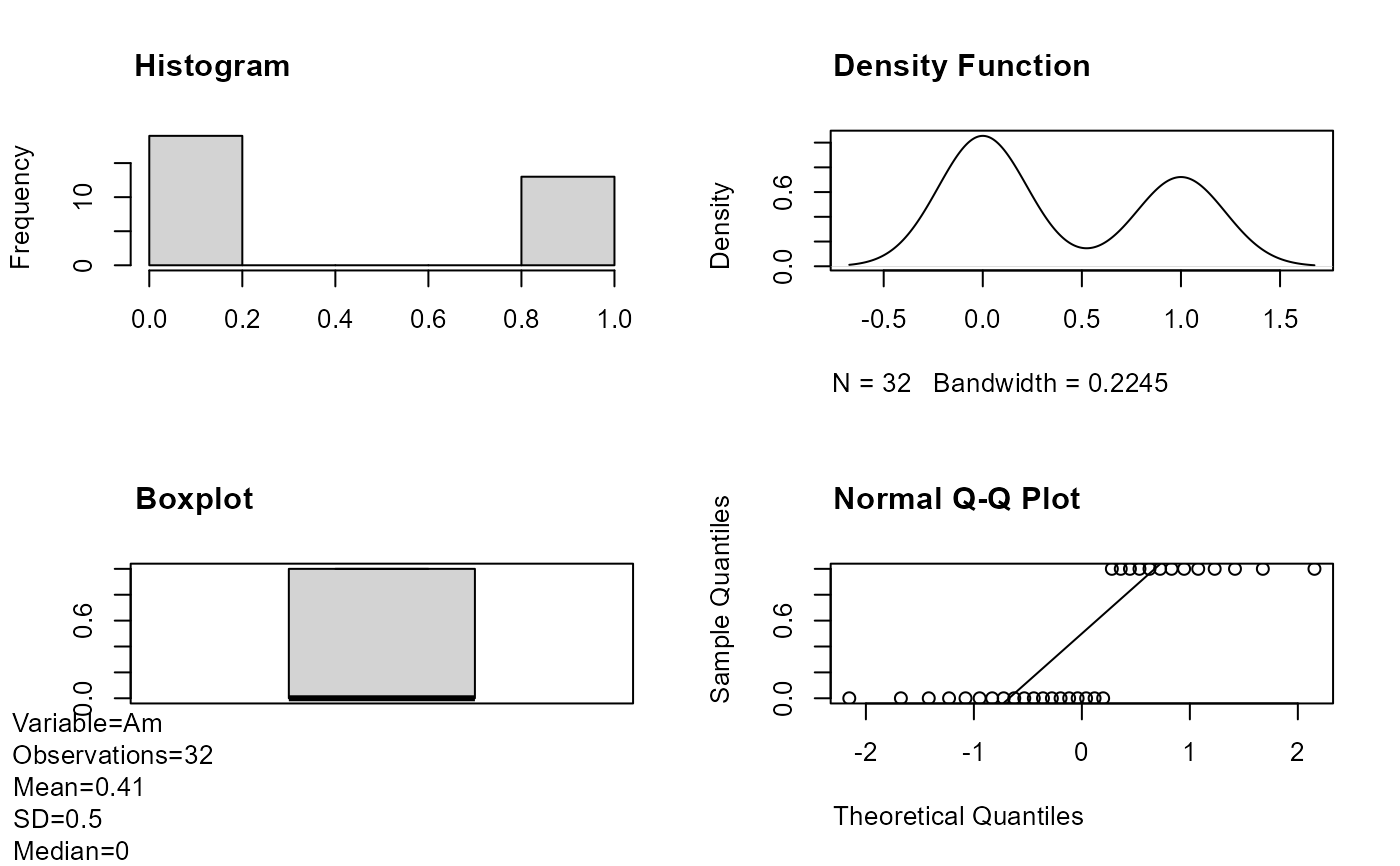
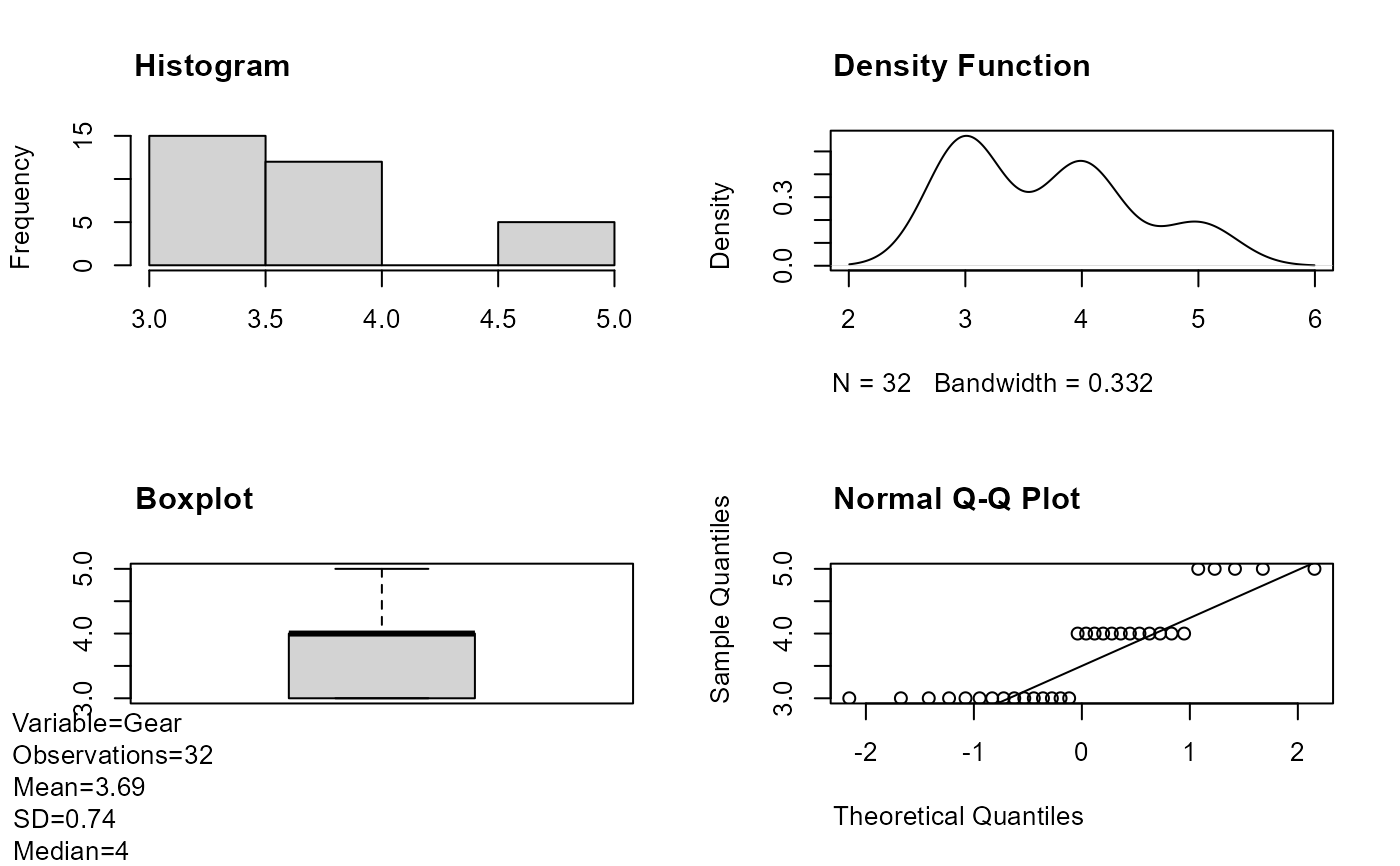
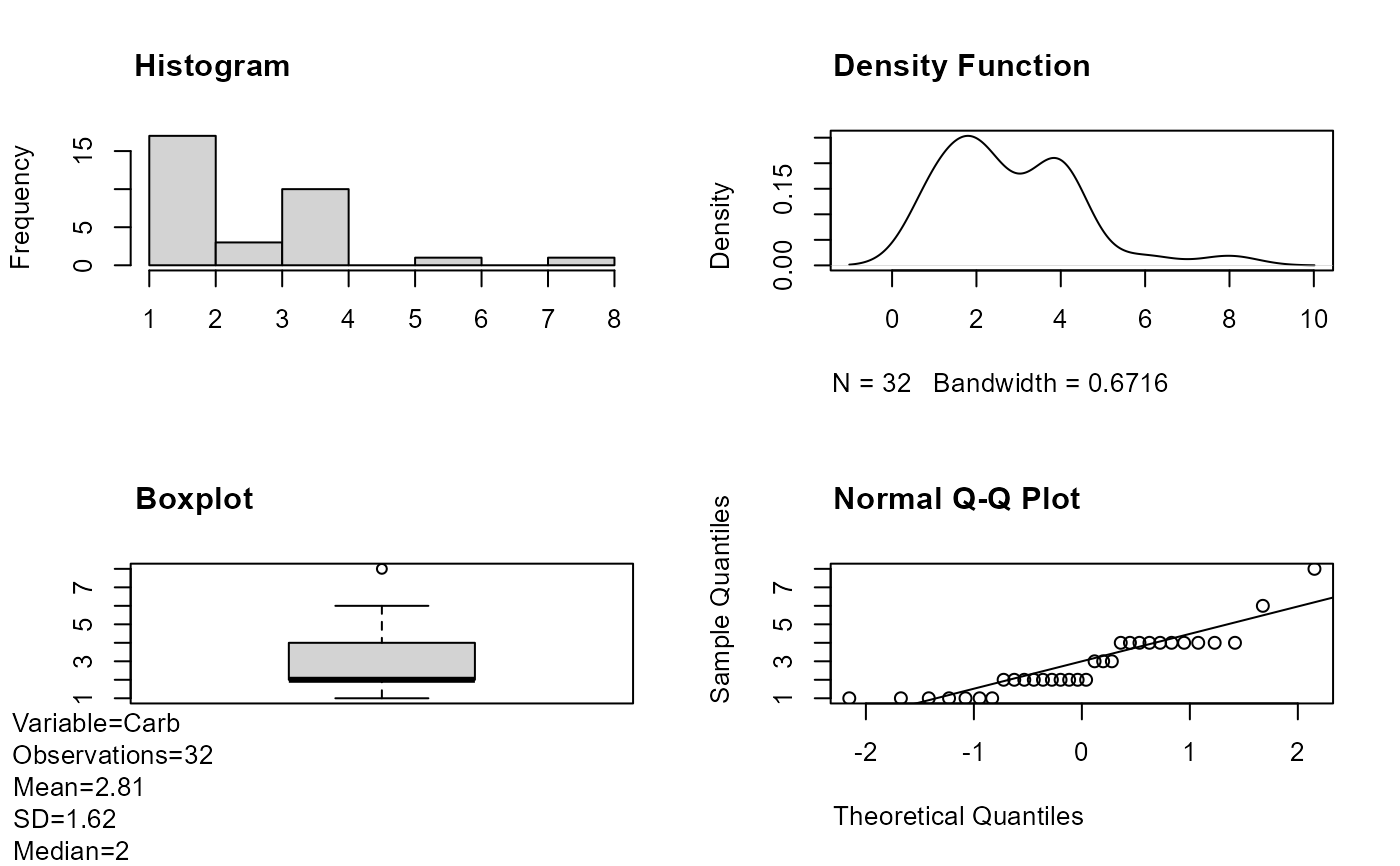
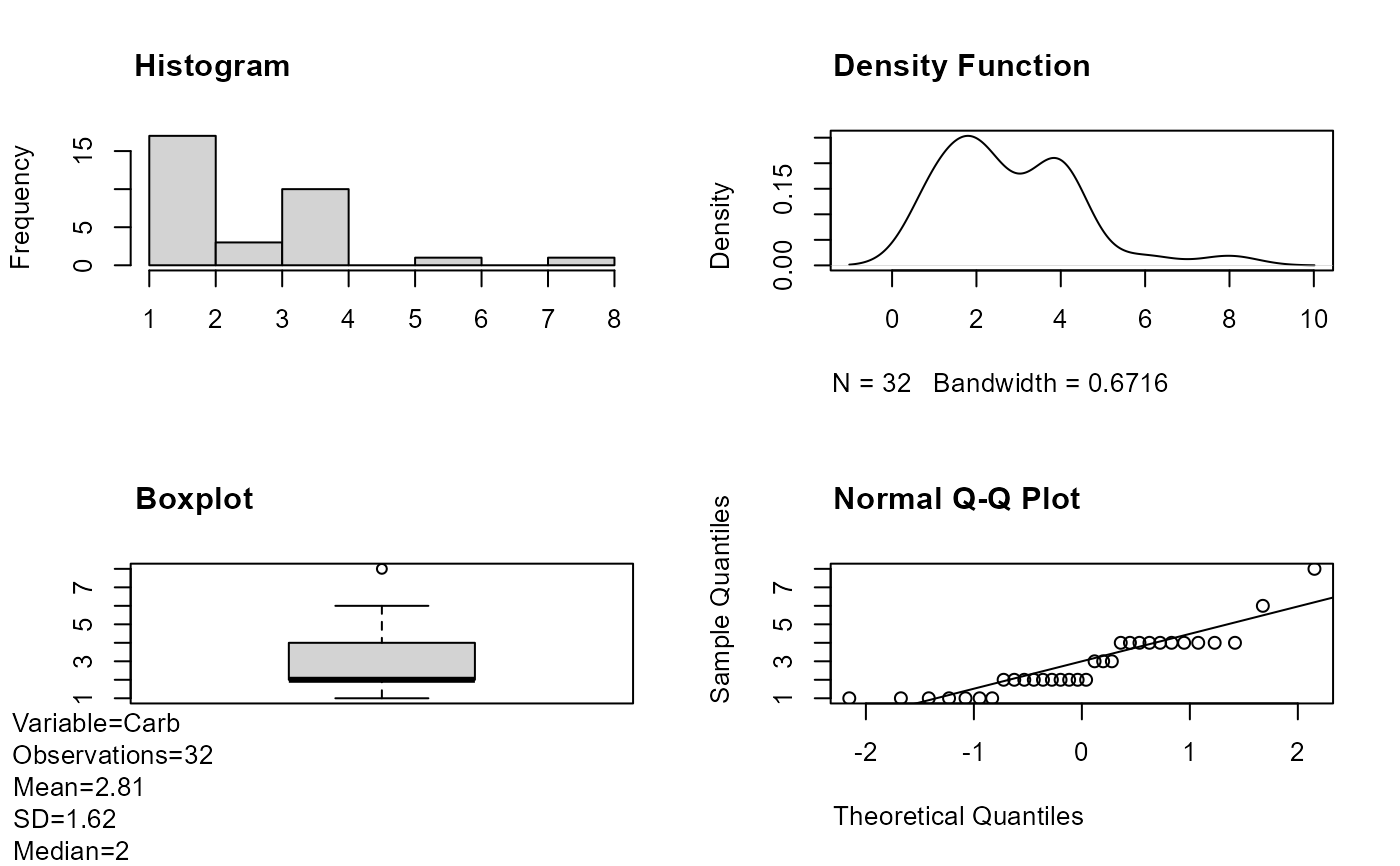
 cars_plot_base <- plot_normality_diagnostics(mtcars)
 report_pdf(p1, p2, print_plot = TRUE)
 report_pdf(p1, p2, file = "report", print_plot = FALSE)
report_pdf(plotlist = cars_plot_multiplot, print_plot = TRUE)
 report_pdf(plotlist = cars_plot_multiplot, file = "report", print_plot = FALSE)
report_pdf(plotlist = cars_plot_base, print_plot = TRUE)
 report_pdf(plotlist = cars_plot_base, file = "report", print_plot = FALSE)