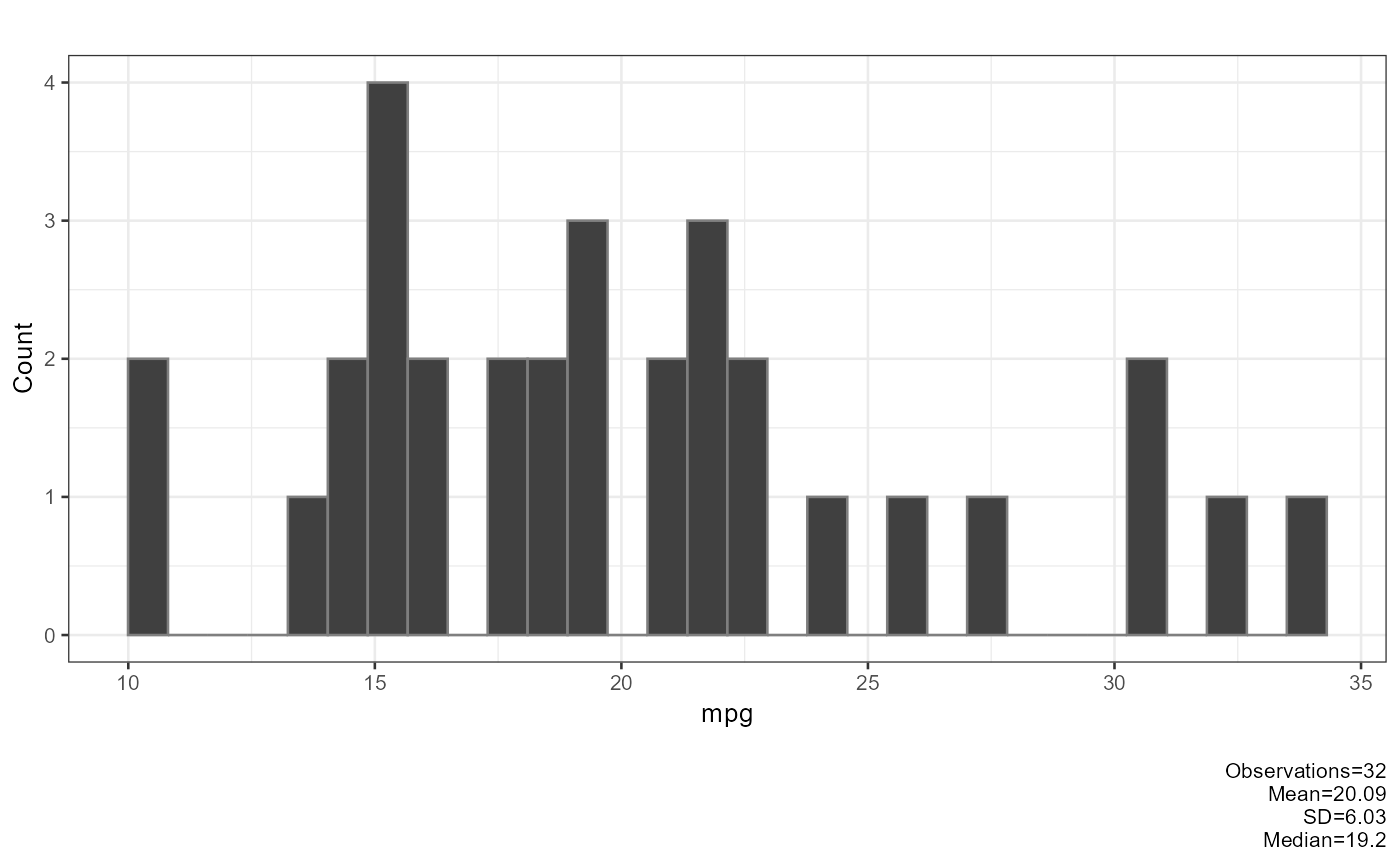
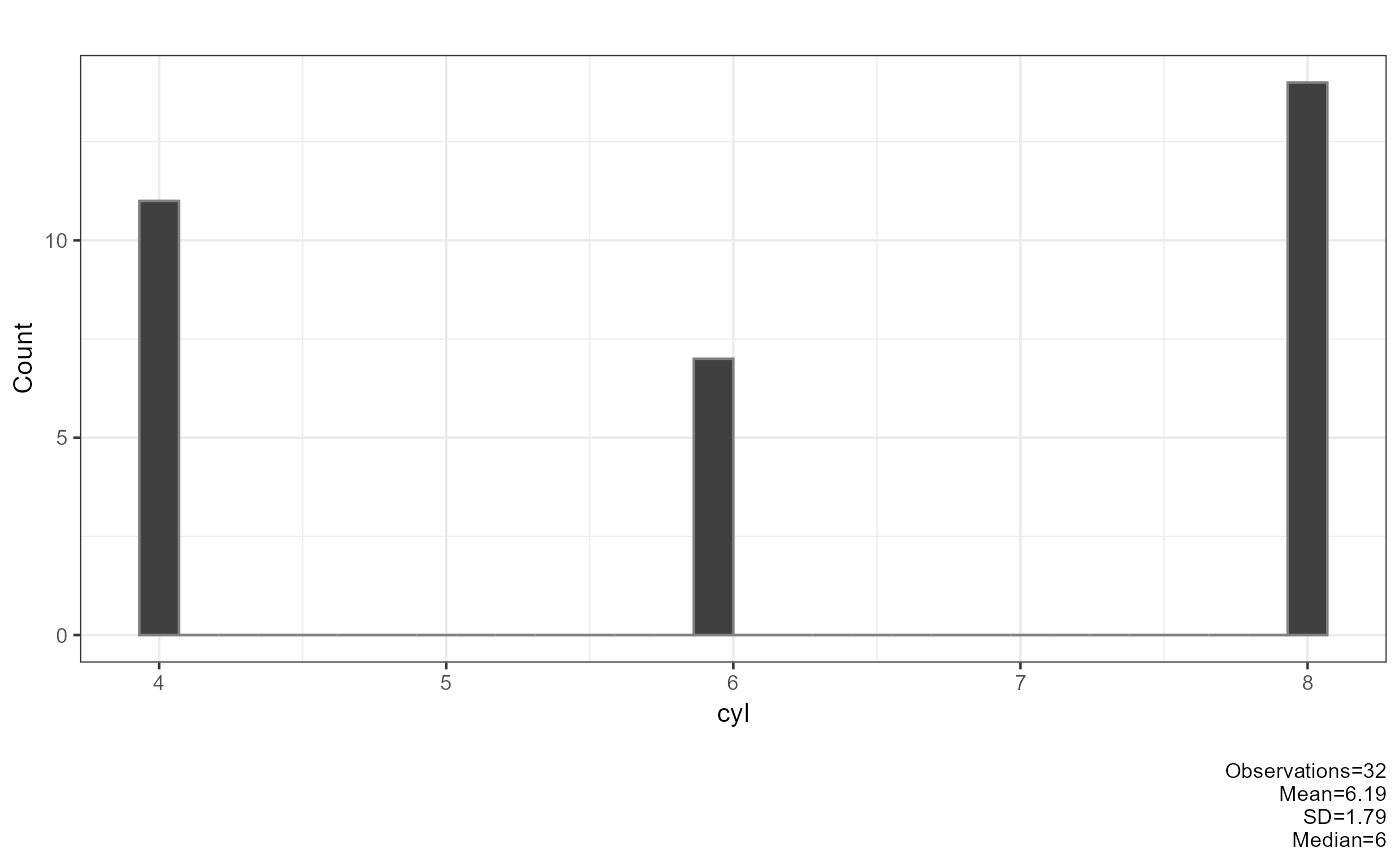
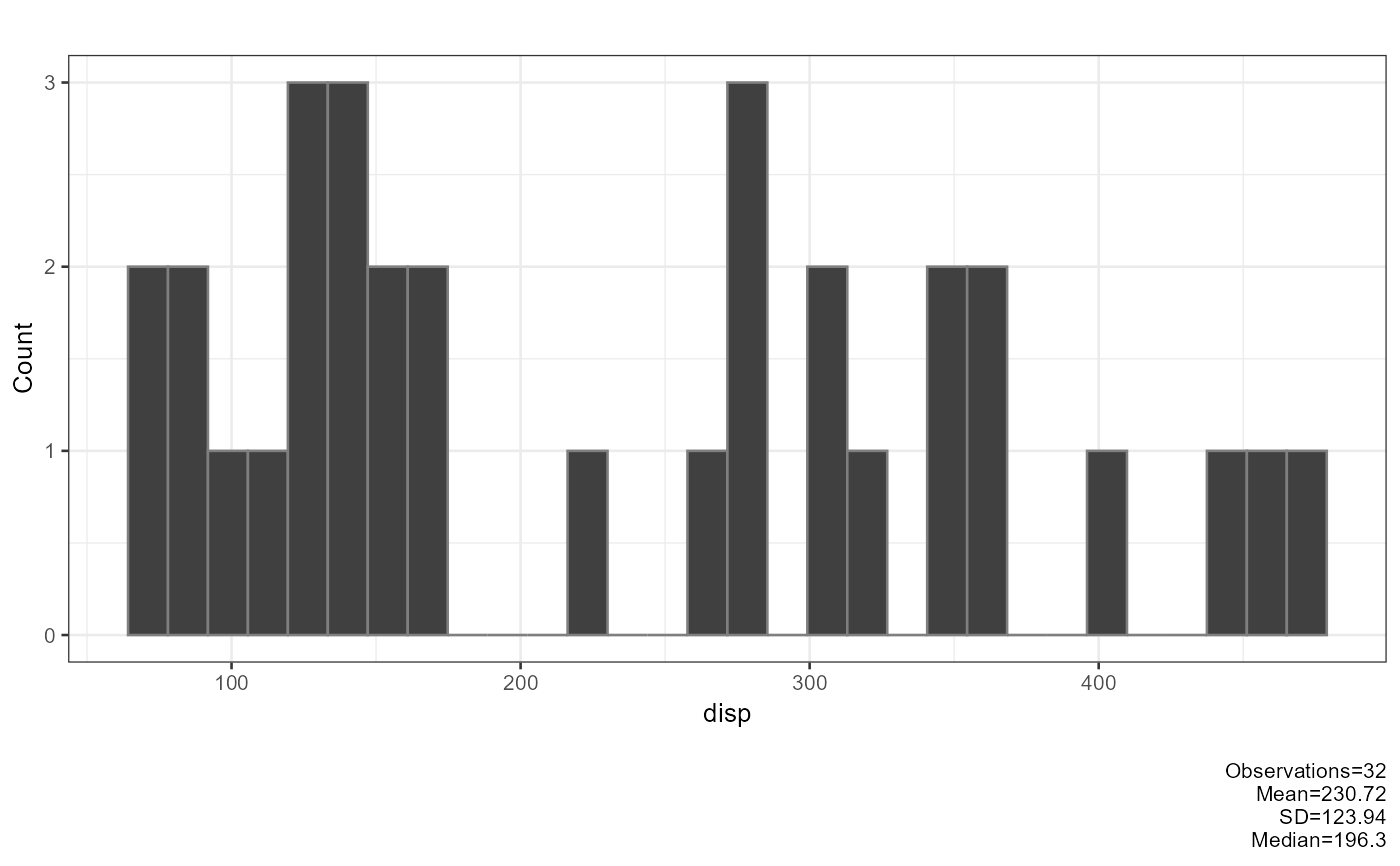
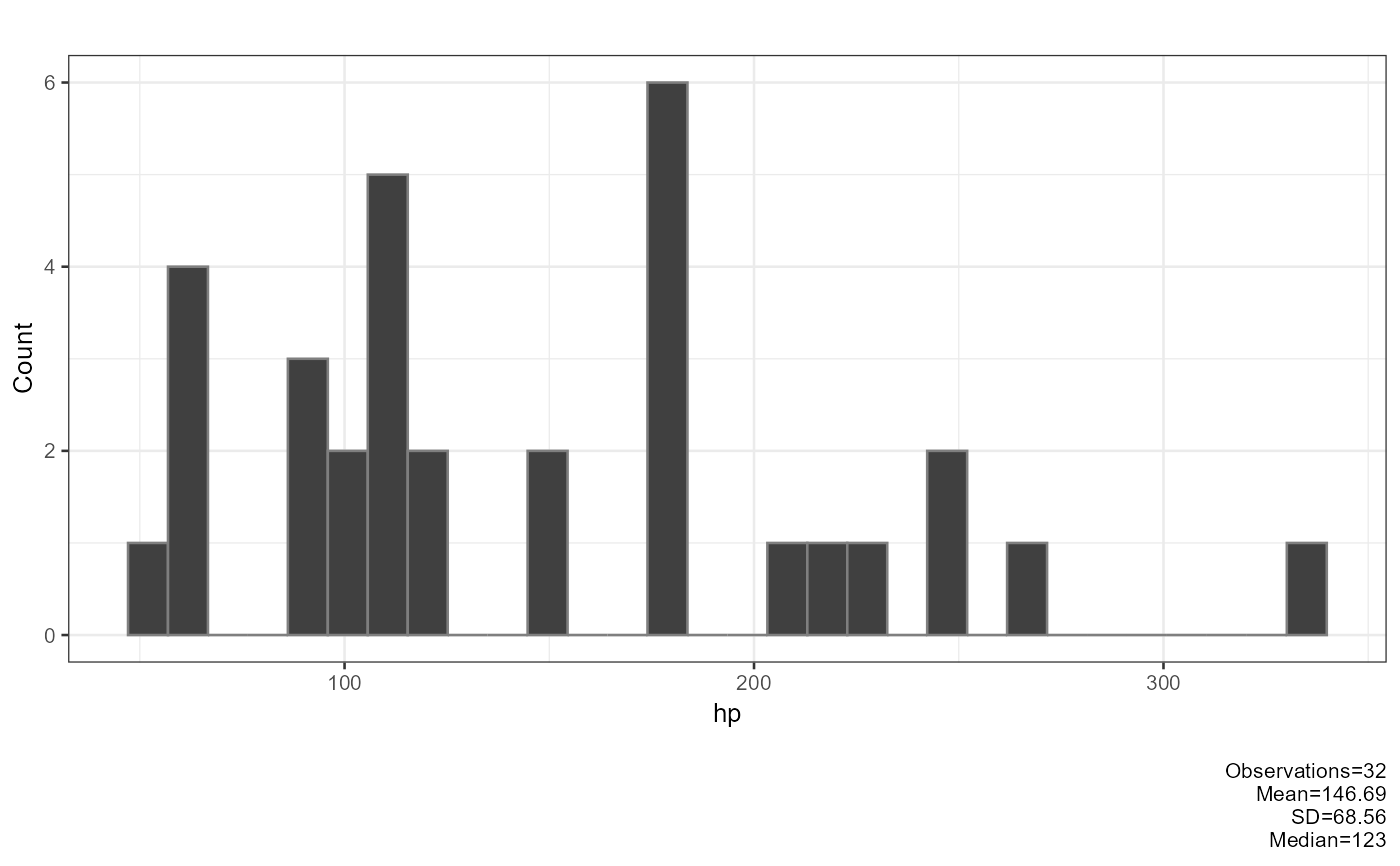
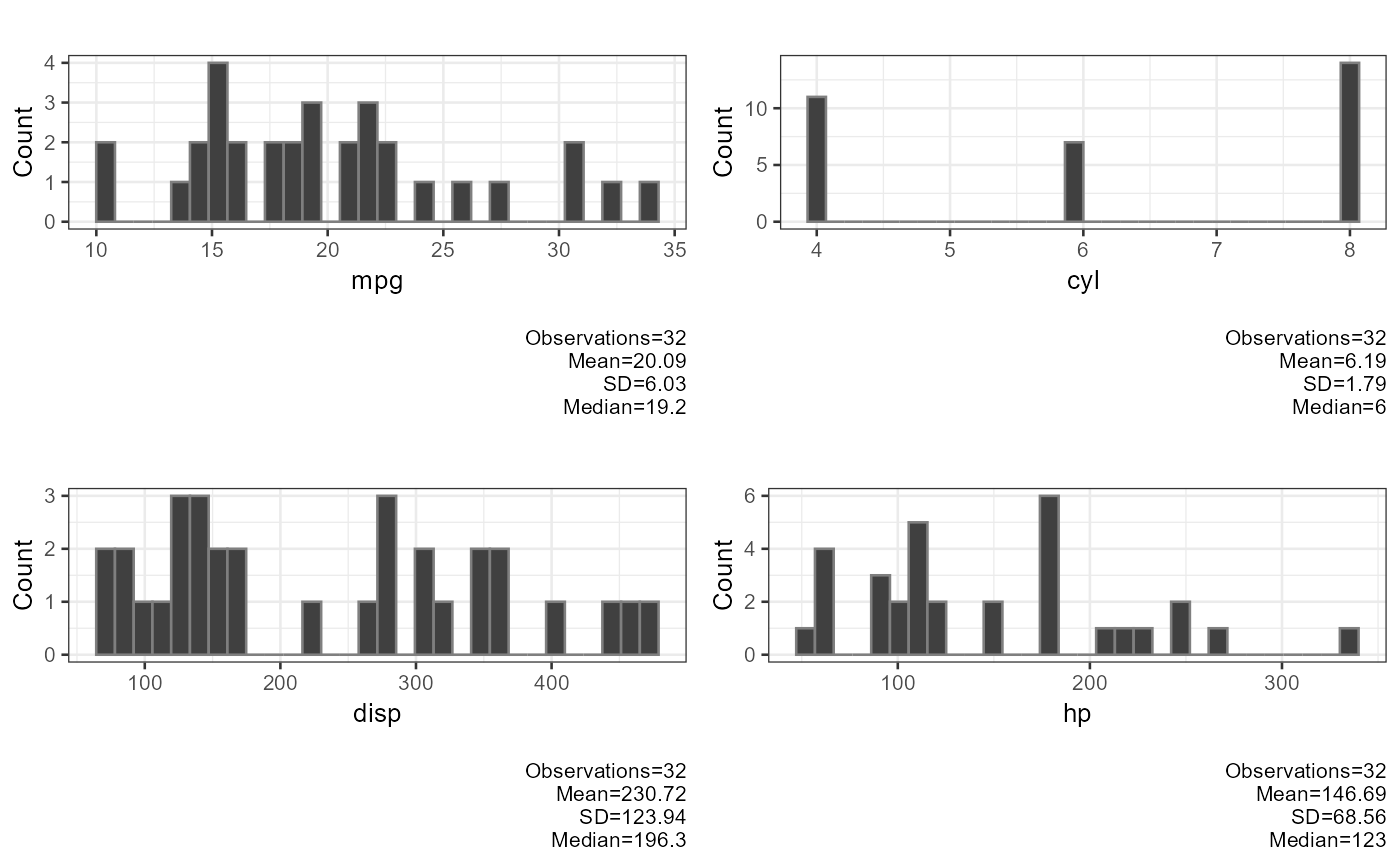
Produces one ggplot histogram per numeric column of
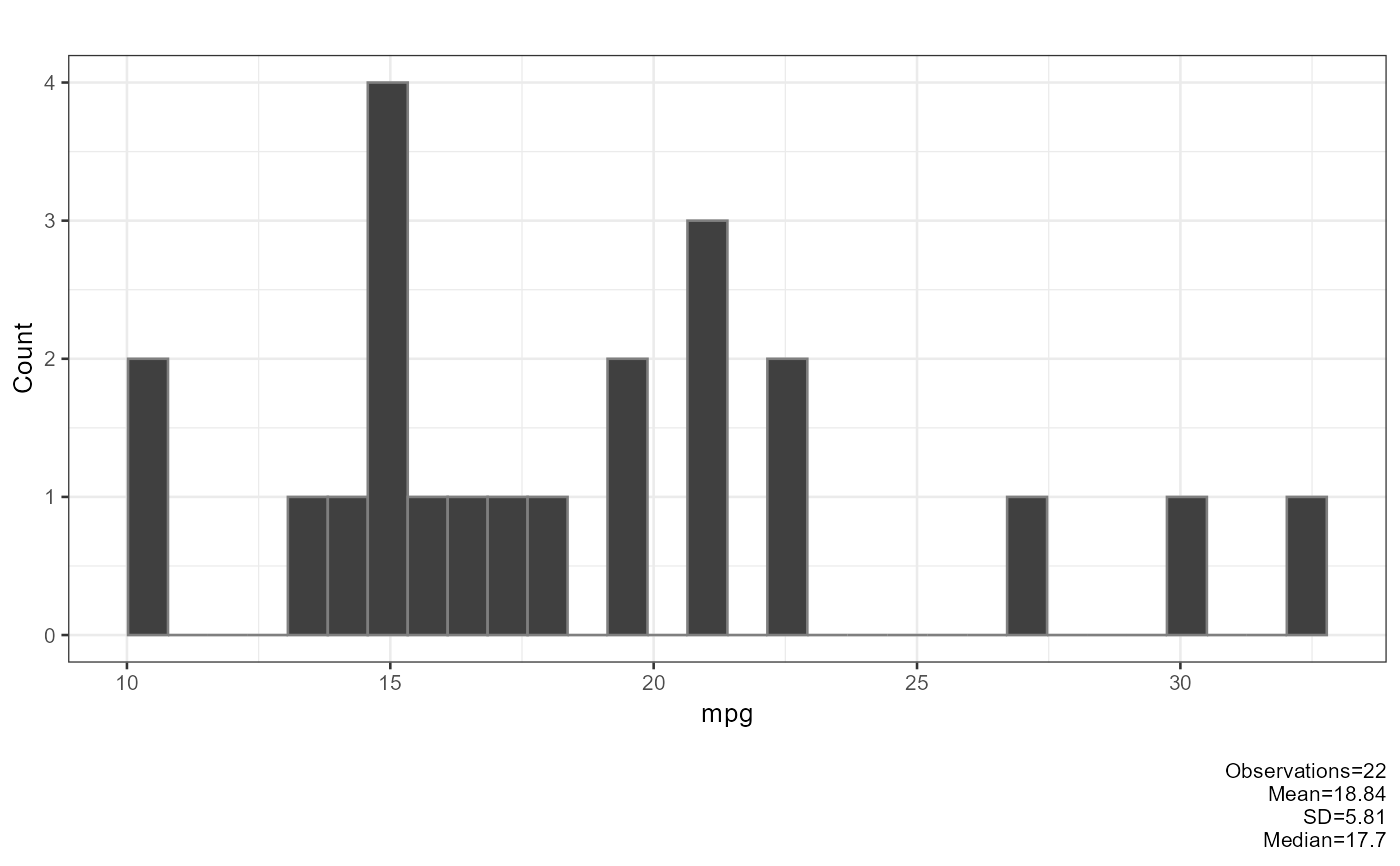
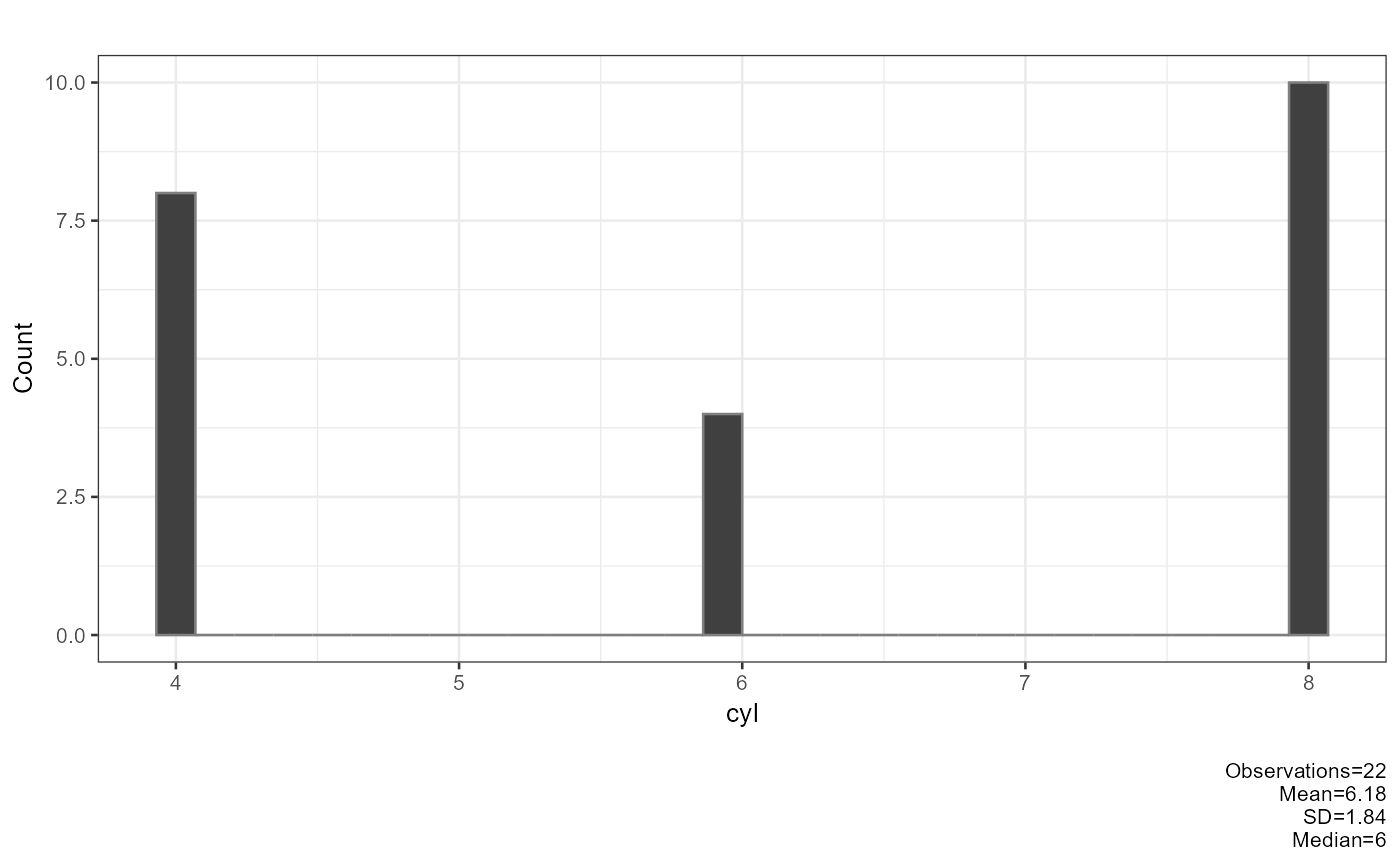
df. Each plot caption shows the observation count, mean, SD, and
median of the column. A progress bar is printed to the console.
Usage
plot_histogram(
  df,
  bins = 30,
  title = "",
  base_size = 10,
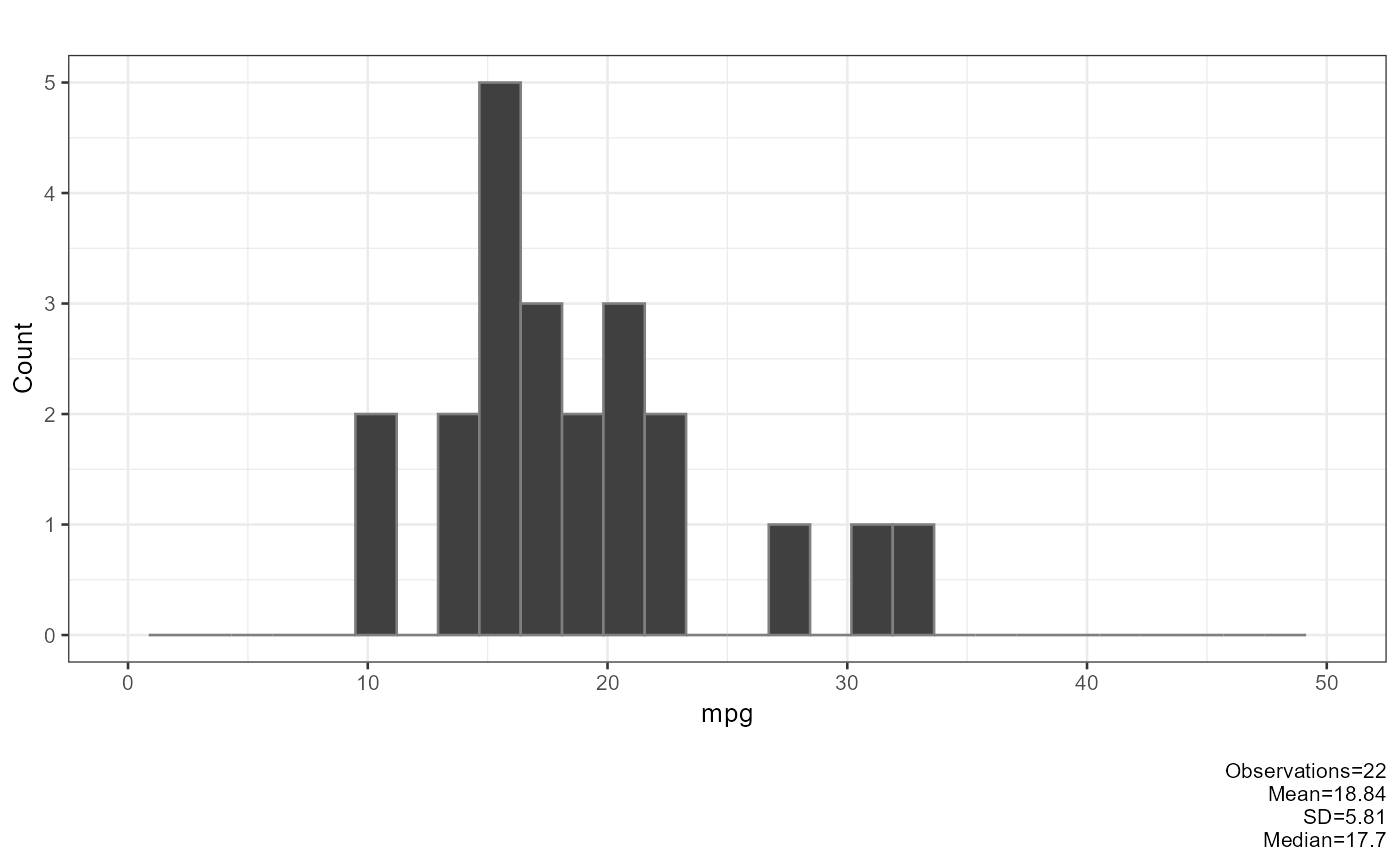
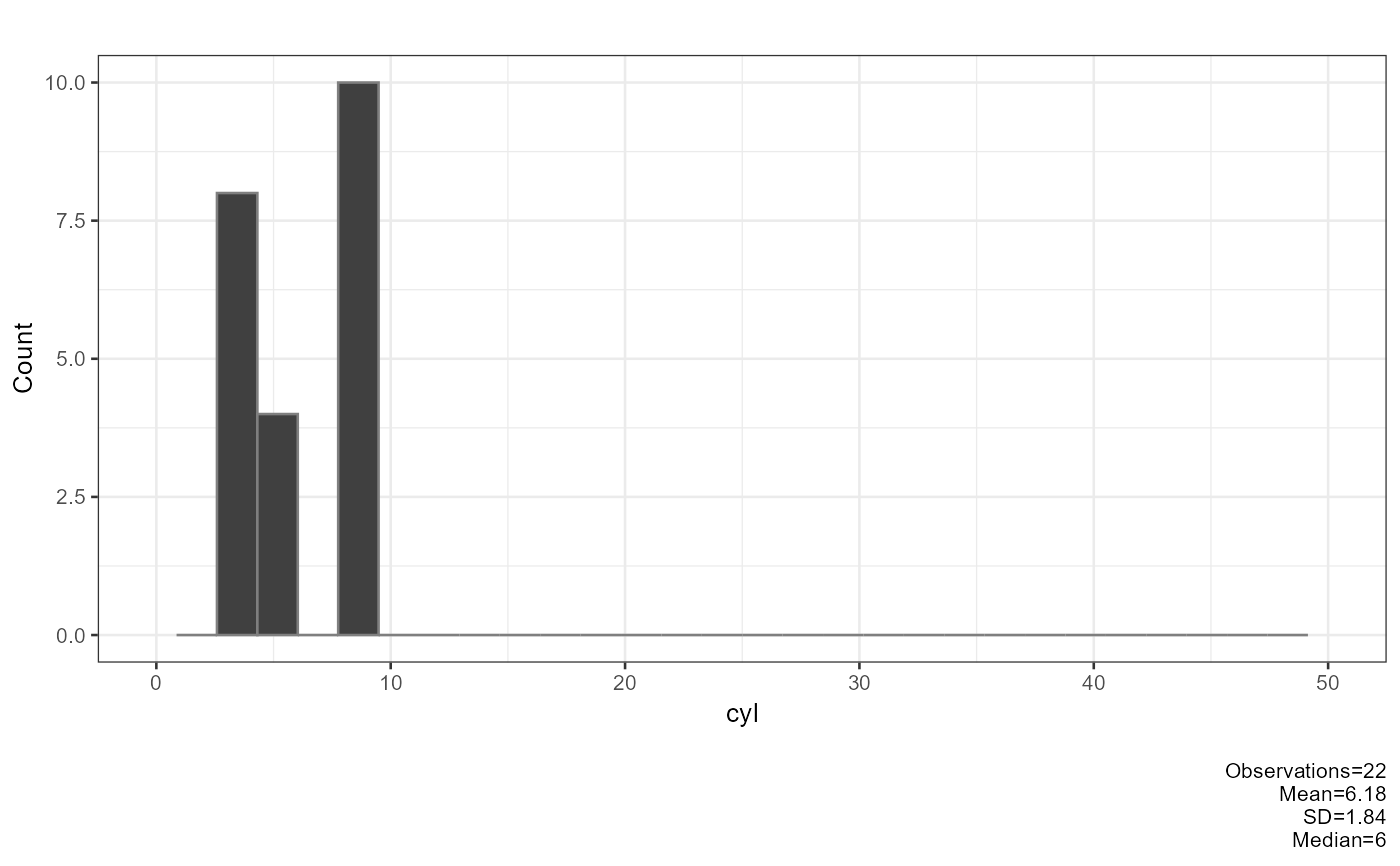
  xlims = NULL,
  fill = "gray25",
  color = "gray50",
  ylab = "Count",
  pb = FALSE
)
Arguments
- df
Data frame or numeric vector. Non-numeric columns are silently dropped.
- bins
Number of histogram bins passed to
ggplot2::geom_histogram(). Default is30.- title
Character string used as the plot title. Default is
"".- base_size
Base font size passed to
theme_bw(). Default is10.- xlims
Length-2 numeric vector setting the x-axis limits, e.g.
c(0, 50). WhenNULL(default) limits are determined automatically.- fill
Fill colour of the histogram bars. Default is
"gray25".- color
Outline colour of the histogram bars. Default is
"gray50".- ylab
Y-axis label. Default is
"Count".- pb
Logical; whether to display a progress bar in the console. Default is
FALSE.
Examples
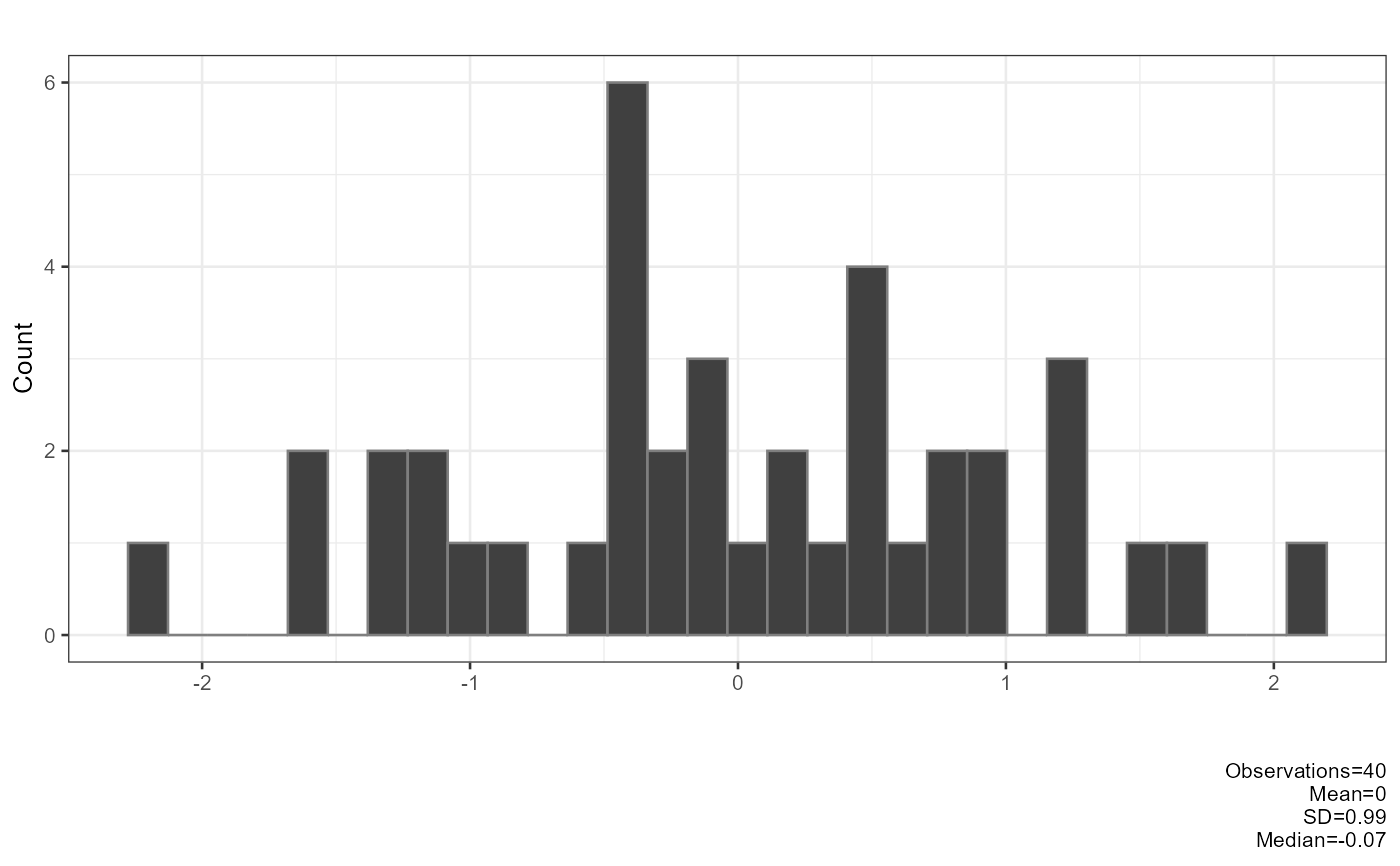
vector <- generate_missing(rnorm(50), missing = 10)
df <- generate_missing(mtcars[, 1:2], missing = 10)
plot_histogram(df = vector)
 plot_histogram(df = df, xlims = c(0, 50))
 plot_histogram(df = df)
 plot_multiplot(plotlist = plot_histogram(df = mtcars[,1:4]), cols = 2)