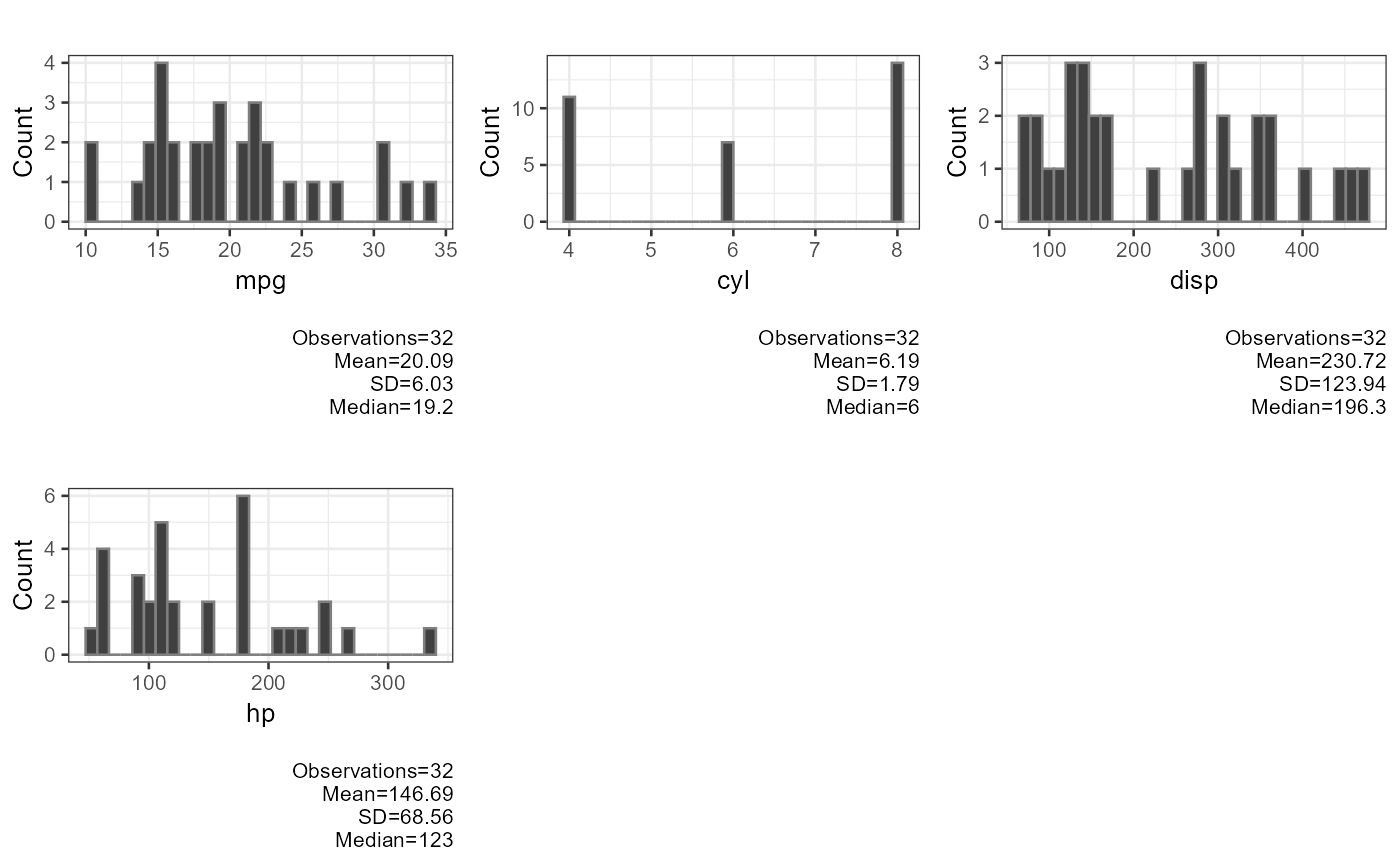
Combines multiple ggplot objects into a single paged display using a grid layout. Plots are arranged by column across one or more pages, with each page recorded and returned as a list.
Arguments
- ...
ggplot objects passed directly.
- plotlist
A list of ggplot objects. Combined with any plots passed via
....- cols
Integer. Number of columns in the layout grid. Ignored if
layoutis provided. Default is2.- layout
A matrix specifying plot positions. Each cell contains the index of the plot to display at that position. If
NULL, a layout is generated automatically fromcols. Default isNULL.
Value
If a single plot is provided, returns it directly. Otherwise returns
a list of plots recorded with grDevices::recordPlot(), one per page.
Examples
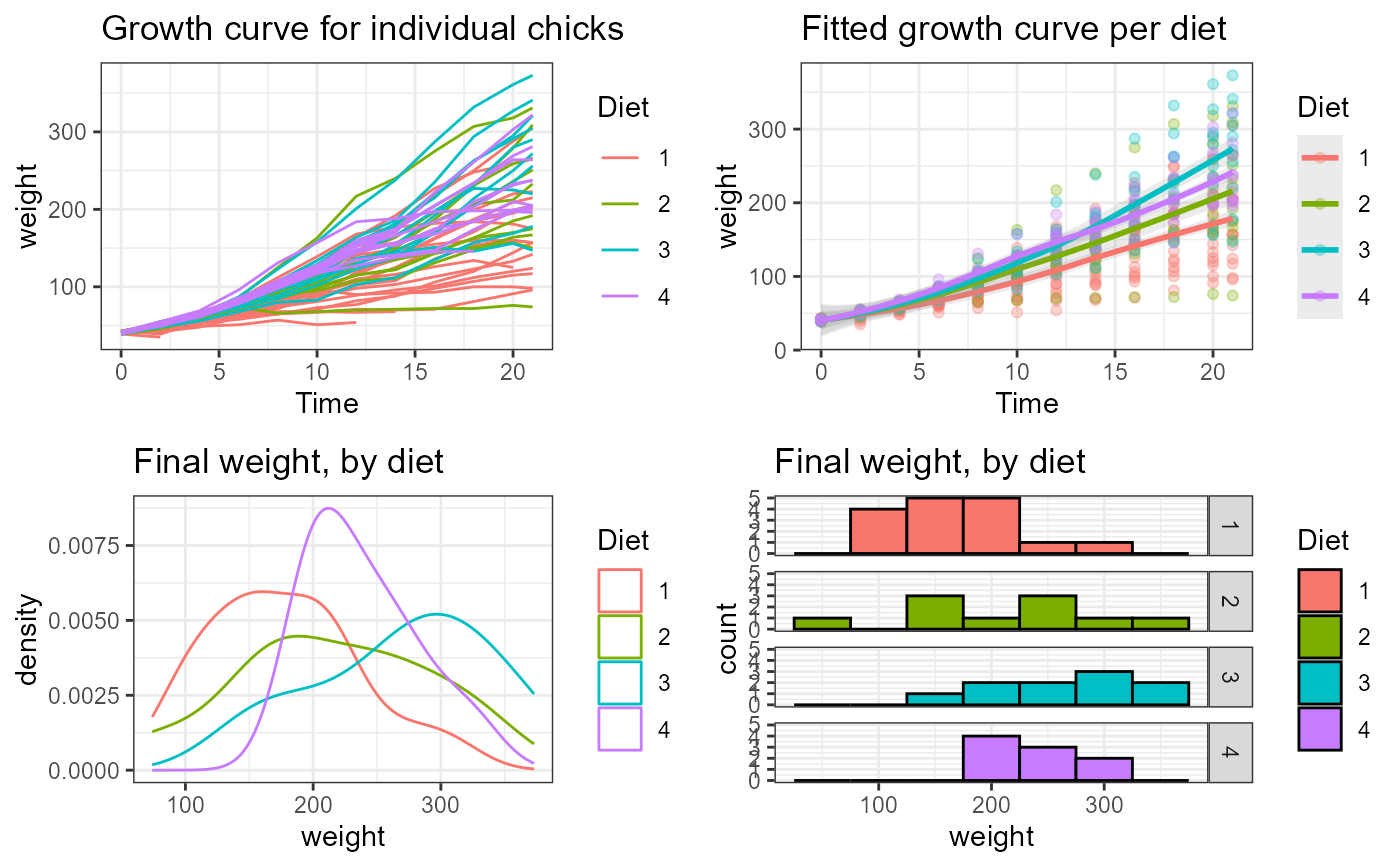
p1 <- ggplot(ChickWeight, aes(x = Time, y = weight, colour = Diet, group = Chick)) +
geom_line() +
ggtitle("Growth curve for individual chicks") +
theme_bw()
p2 <- ggplot(ChickWeight, aes(x = Time, y = weight, colour = Diet)) +
geom_point(alpha = .3) +
geom_smooth(alpha = .2, size = 1, method = "loess", formula = "y~x") +
ggtitle("Fitted growth curve per diet") +
theme_bw()
p3 <- ggplot(subset(ChickWeight, Time == 21), aes(x = weight, colour = Diet)) +
geom_density() +
ggtitle("Final weight, by diet") +
theme_bw()
p4 <- ggplot(subset(ChickWeight, Time == 21), aes(x = weight, fill = Diet)) +
geom_histogram(colour = "black", binwidth = 50) +
facet_grid(Diet ~ .) +
ggtitle("Final weight, by diet") +
theme_bw()
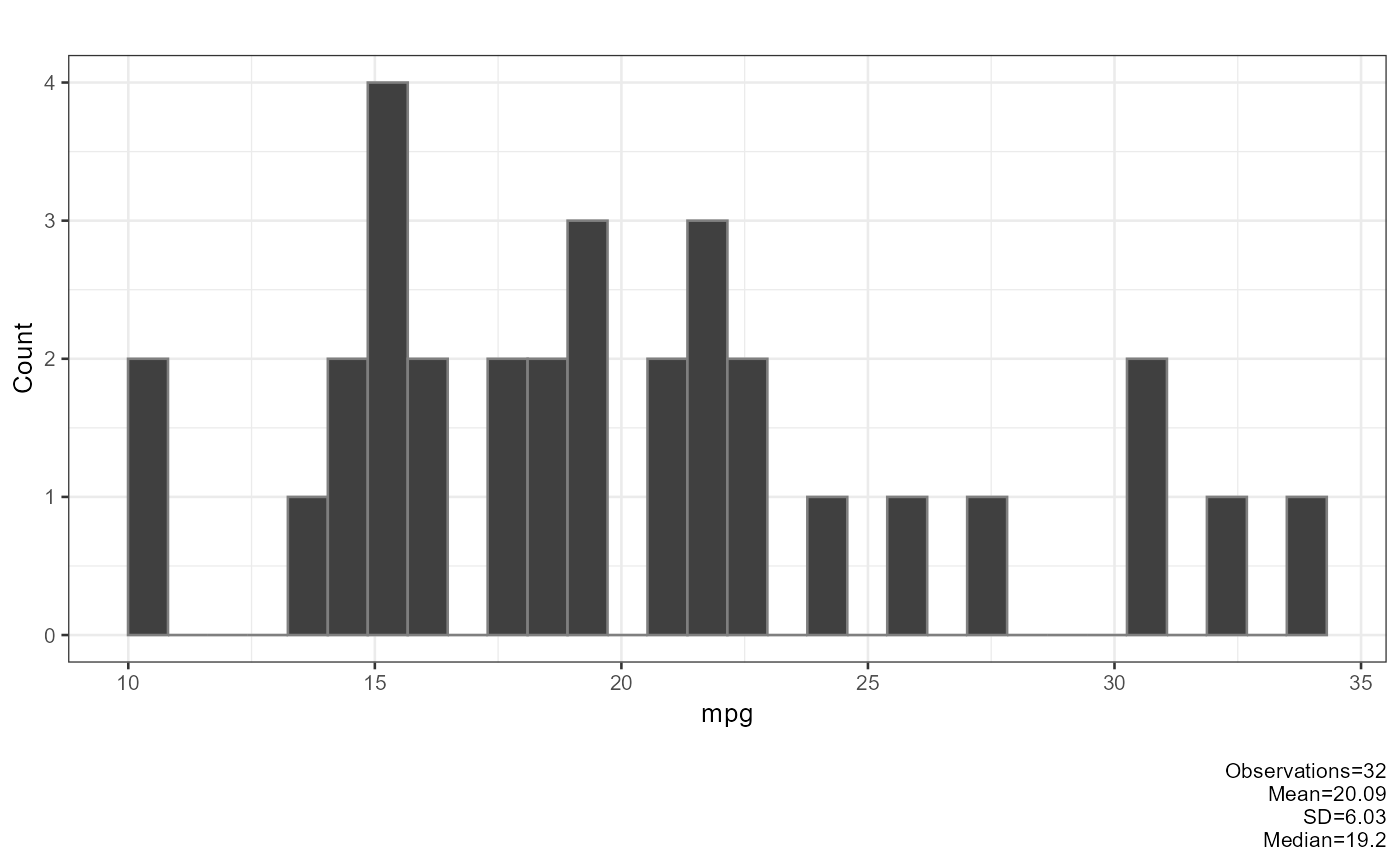
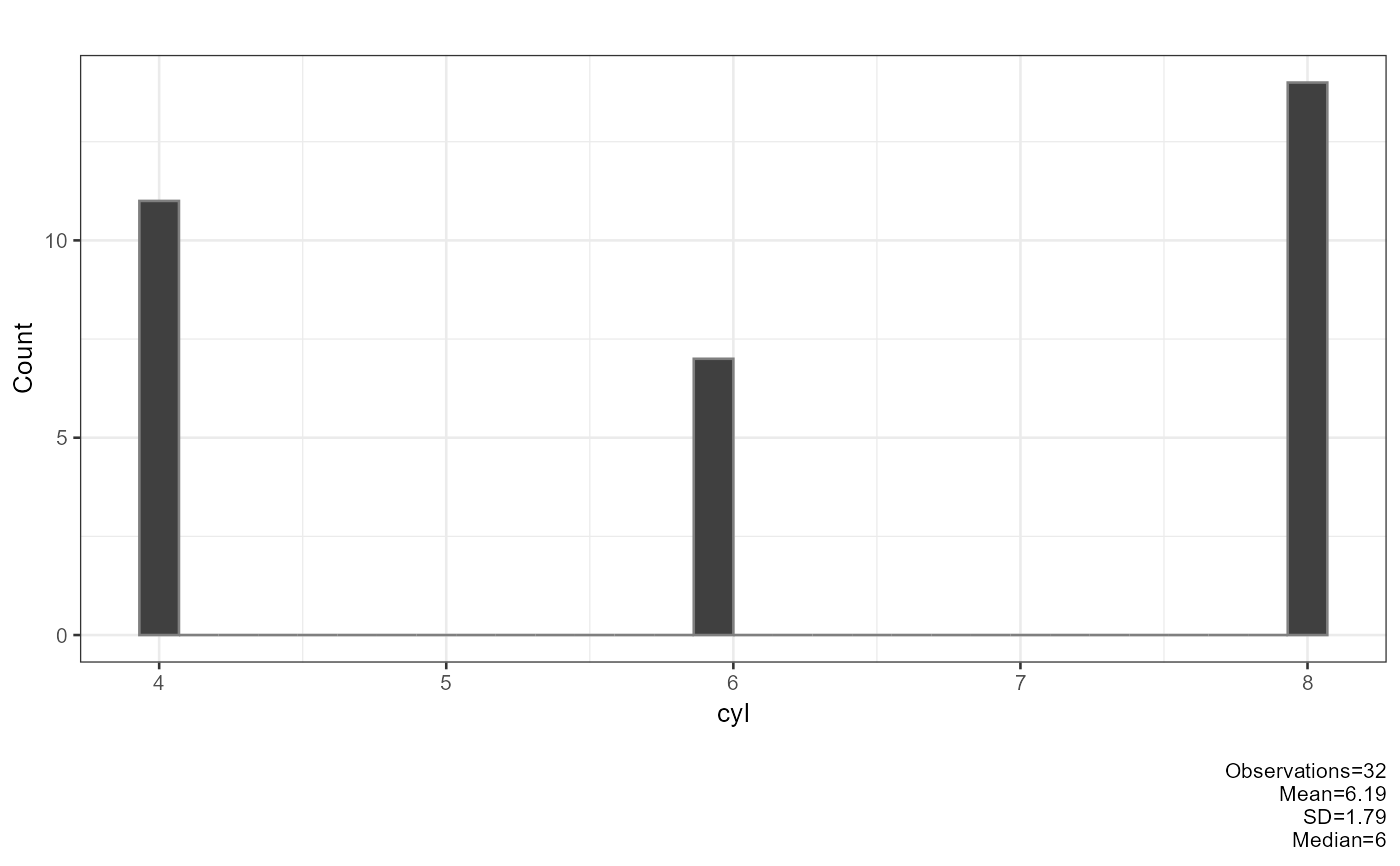
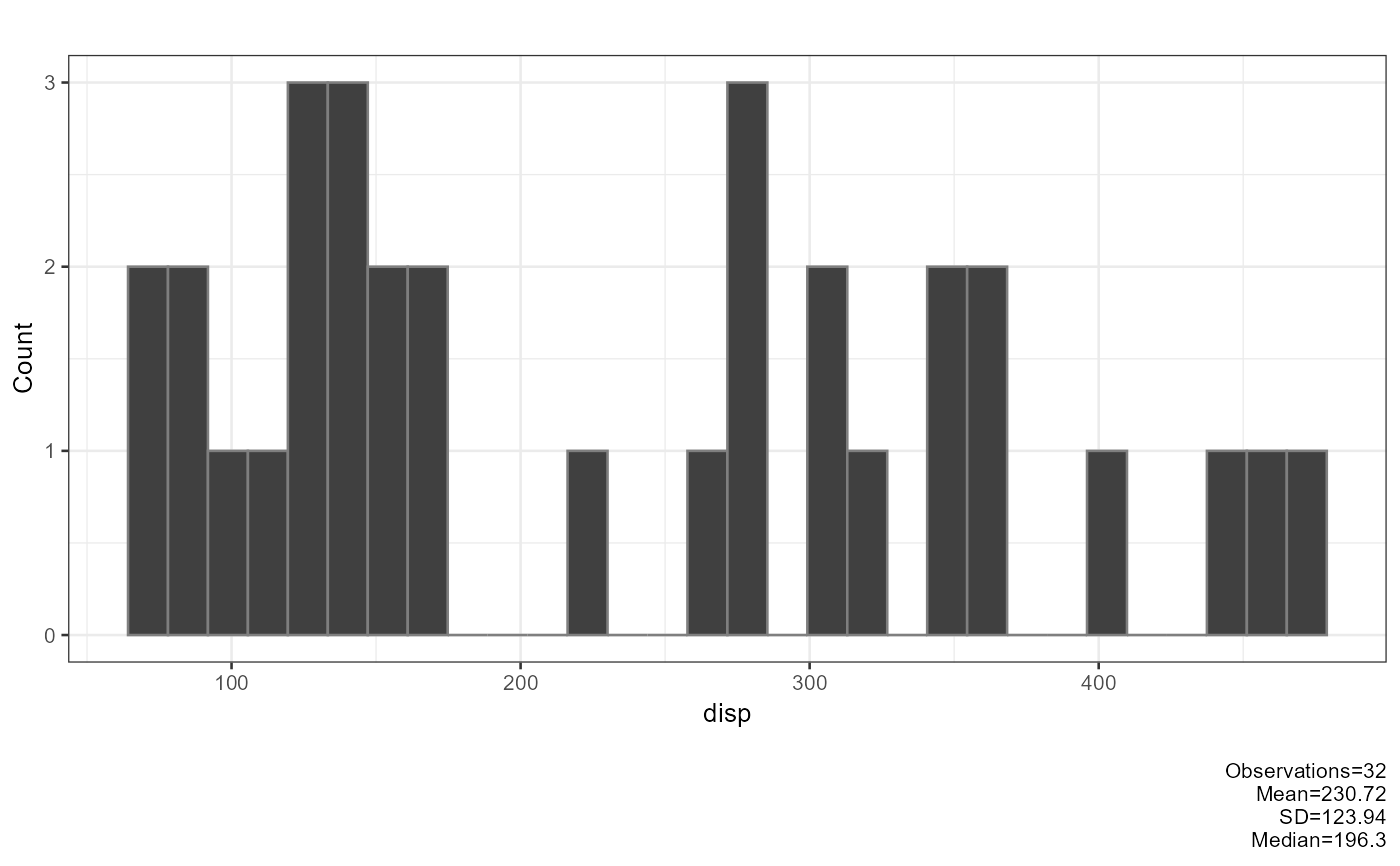
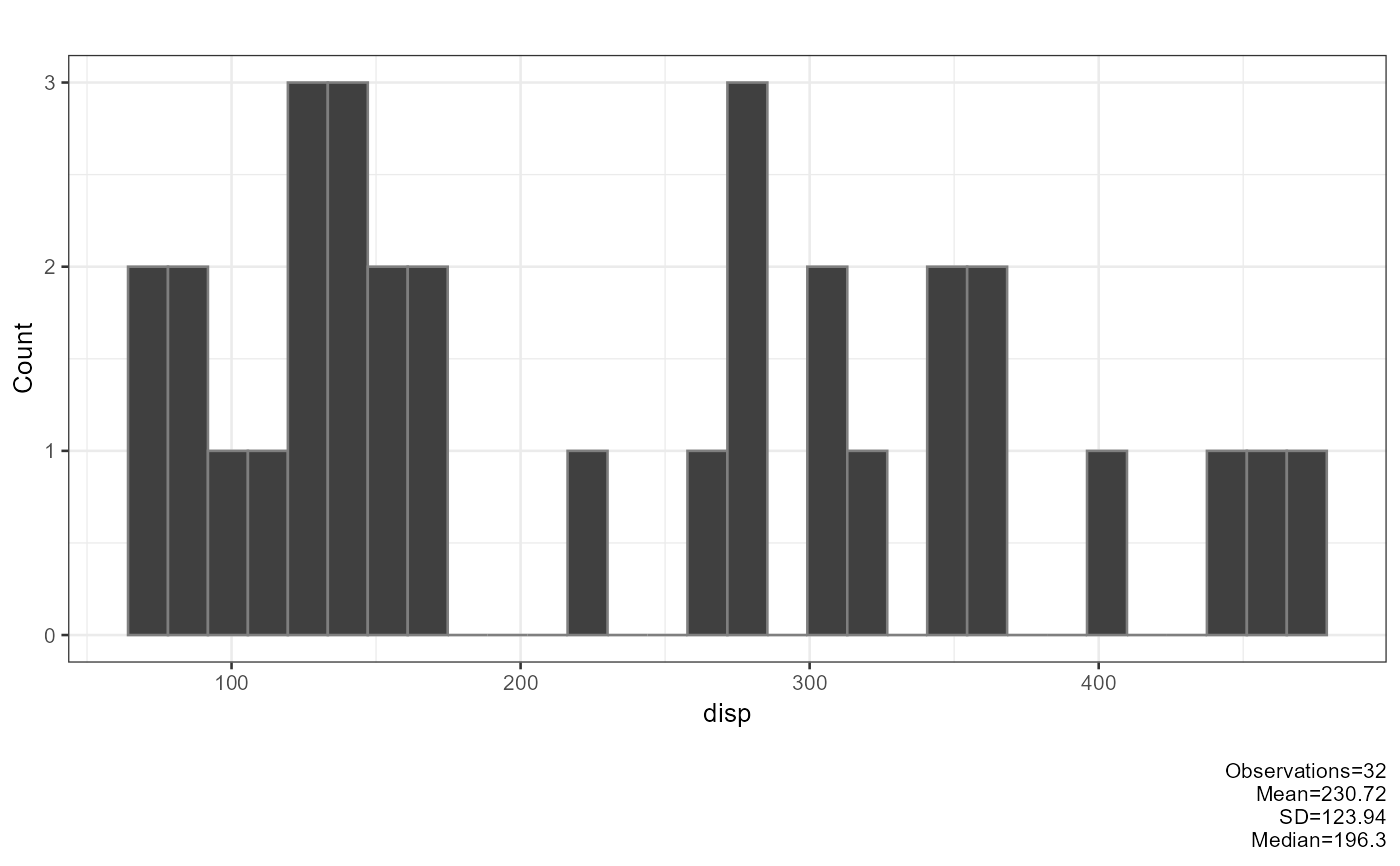
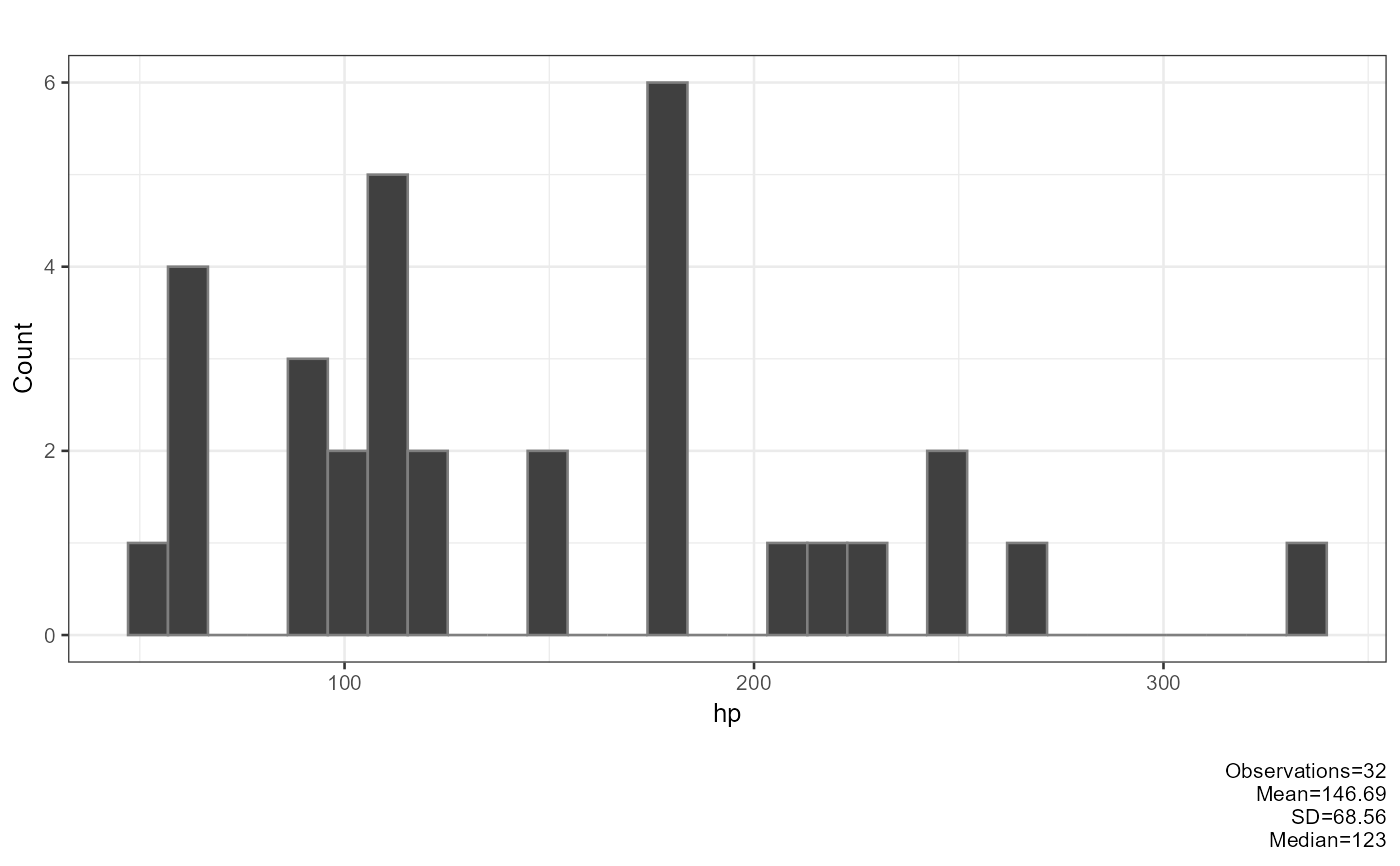
cars_plot <- plot_histogram(mtcars[1:4])
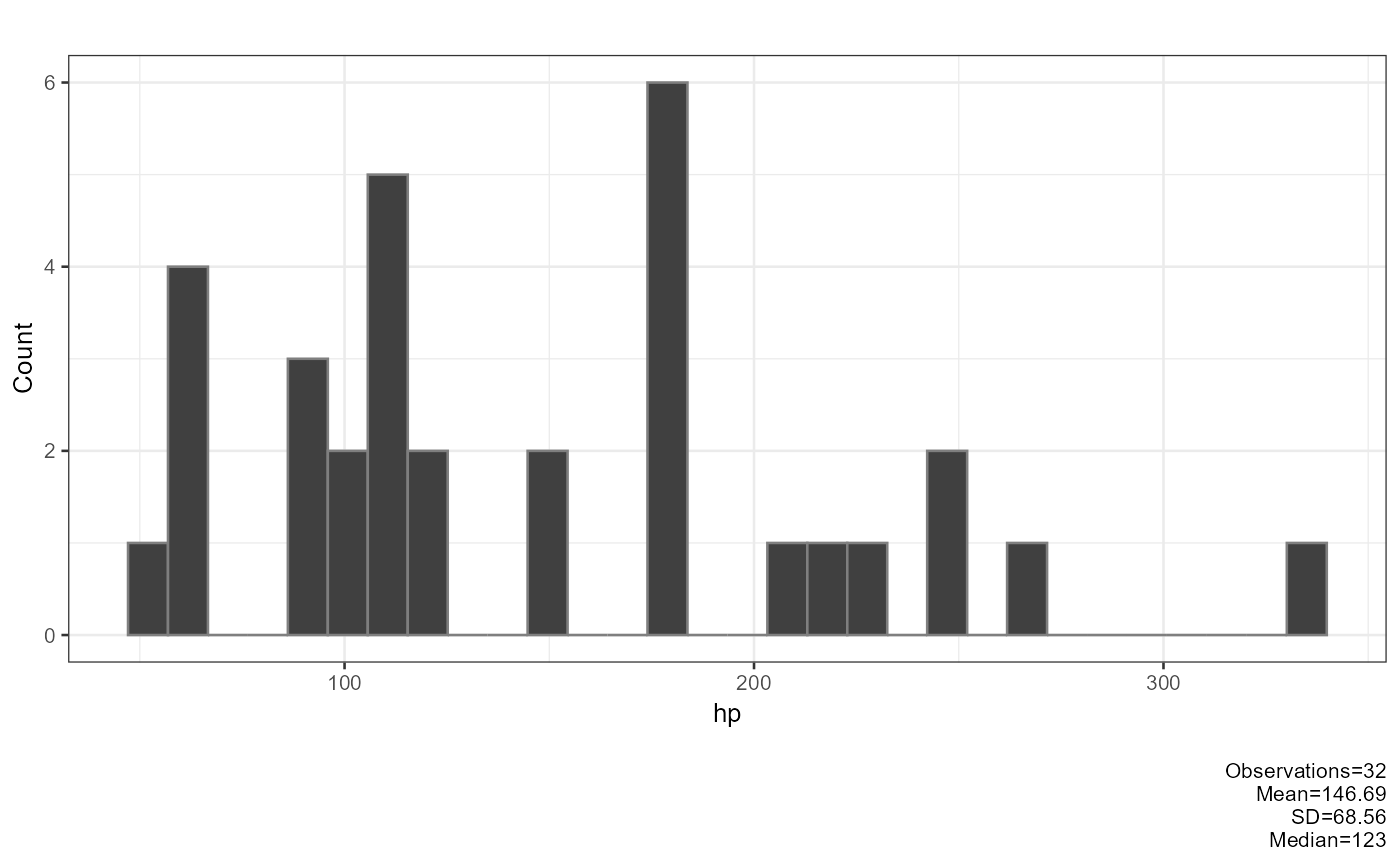 plot_multiplot(p1, p2, p3, p4, cols = 2)
 plot_multiplot(plotlist = plot_histogram(mtcars[, 1:4]), cols = 2)
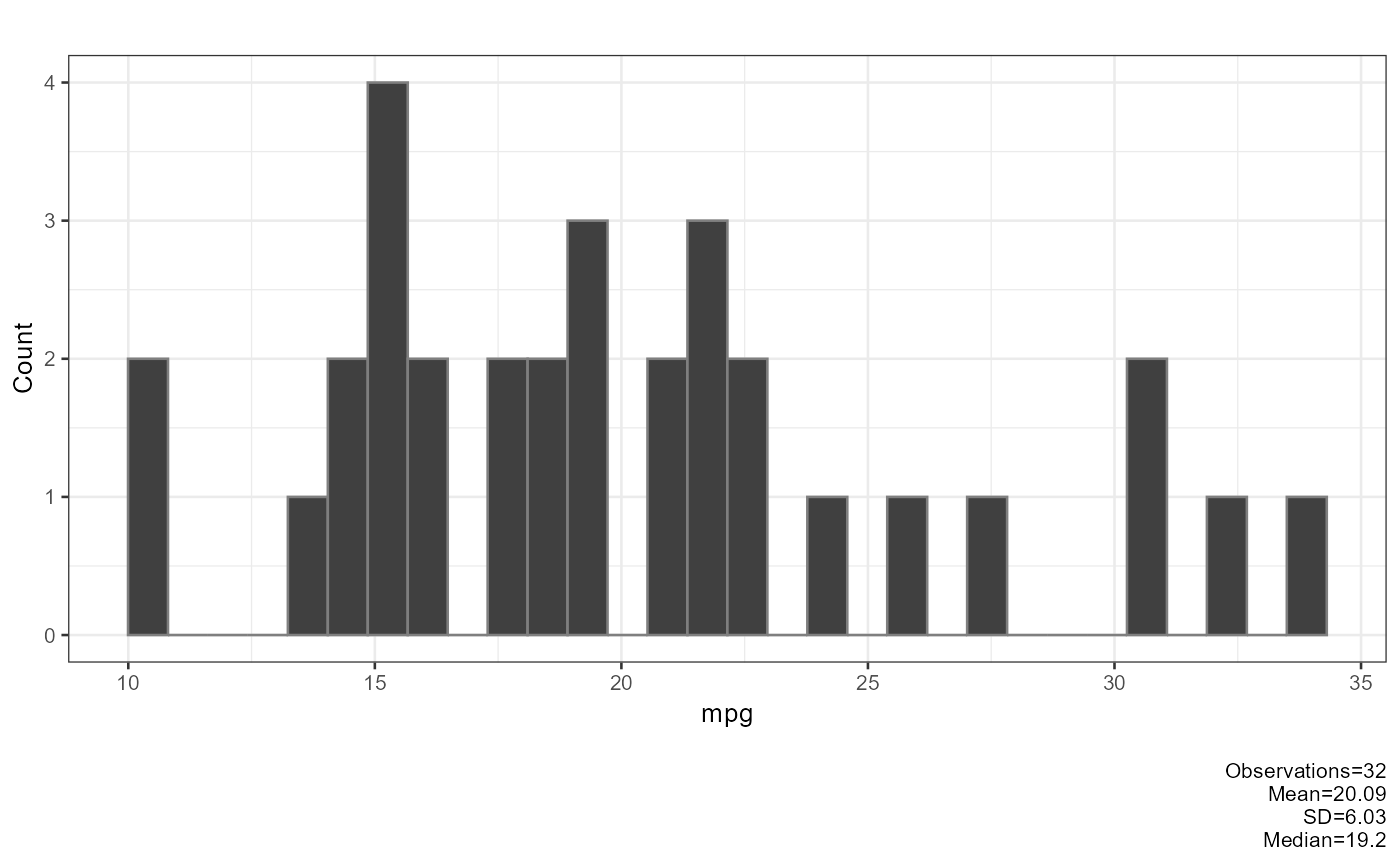
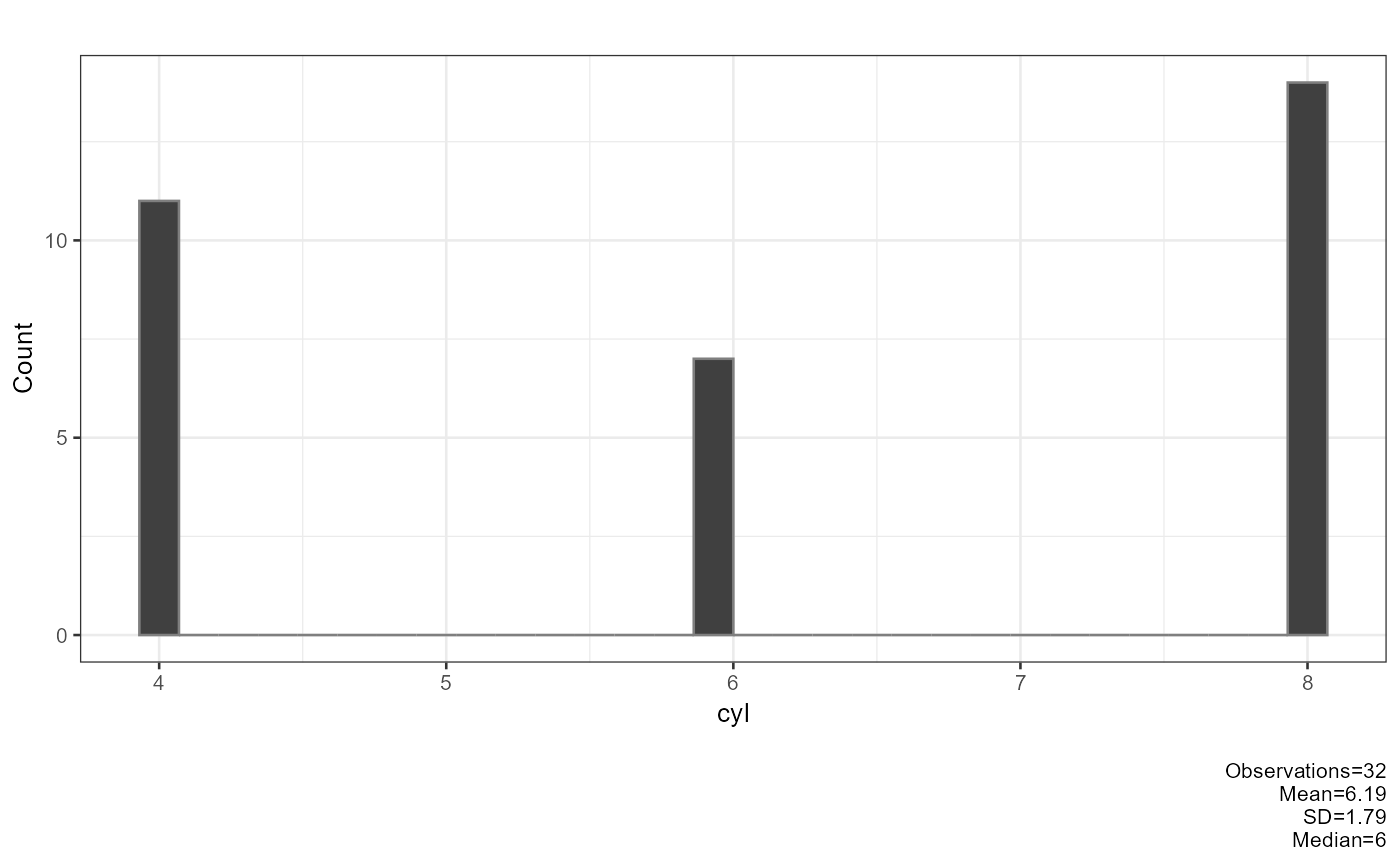
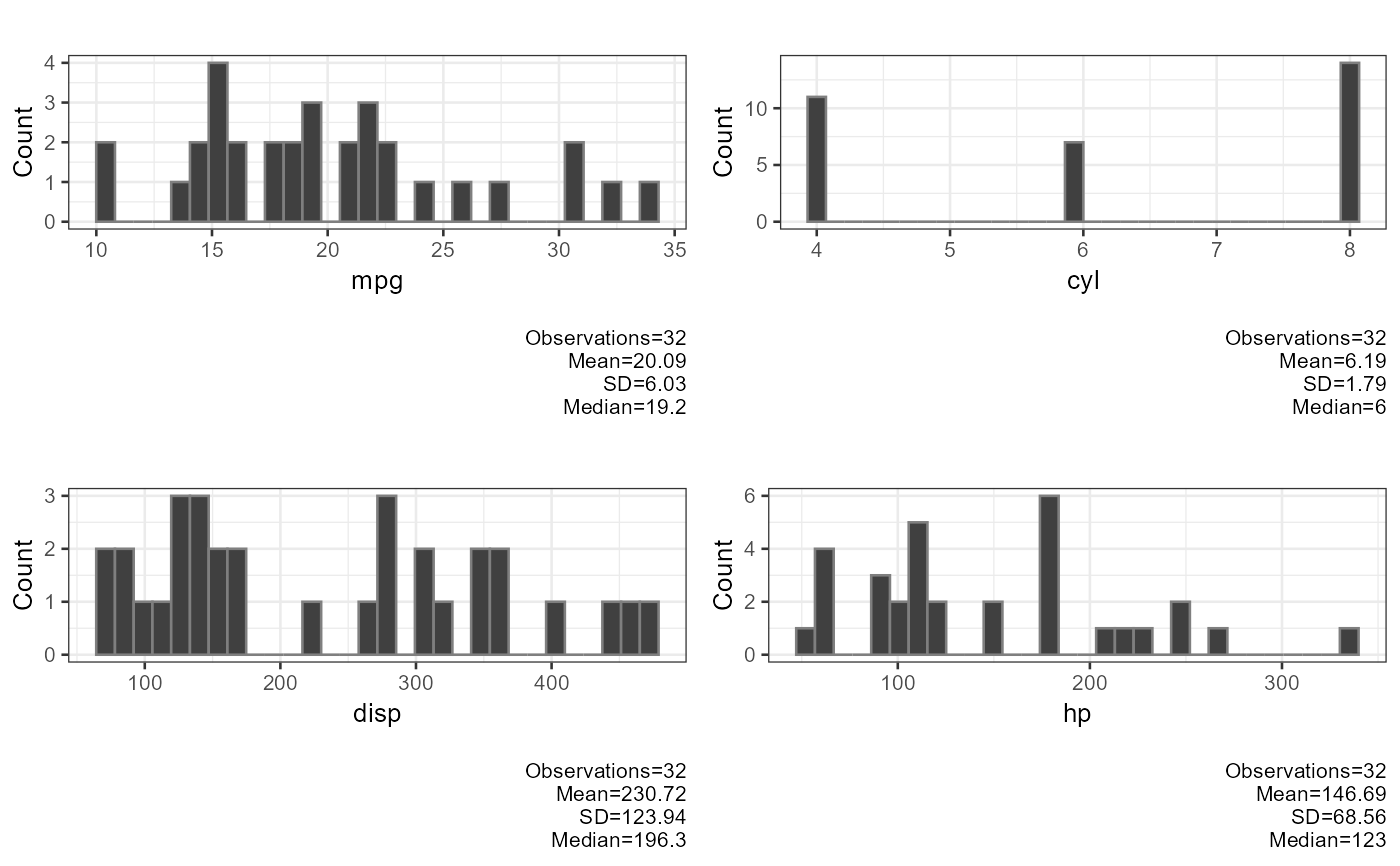 plot_multiplot(plotlist = plot_histogram(mtcars),
layout = matrix(1:4, ncol = 2, byrow = TRUE))
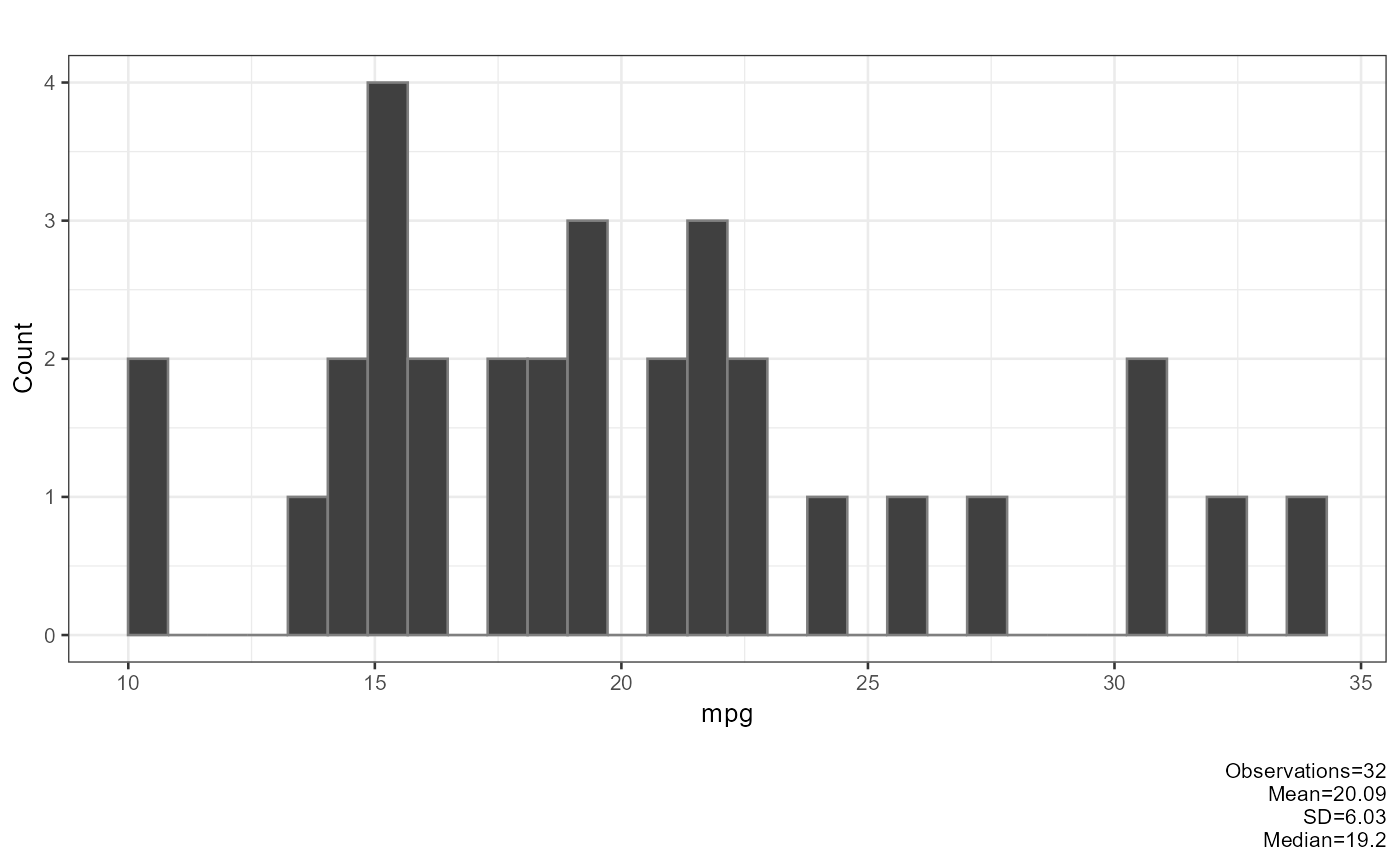
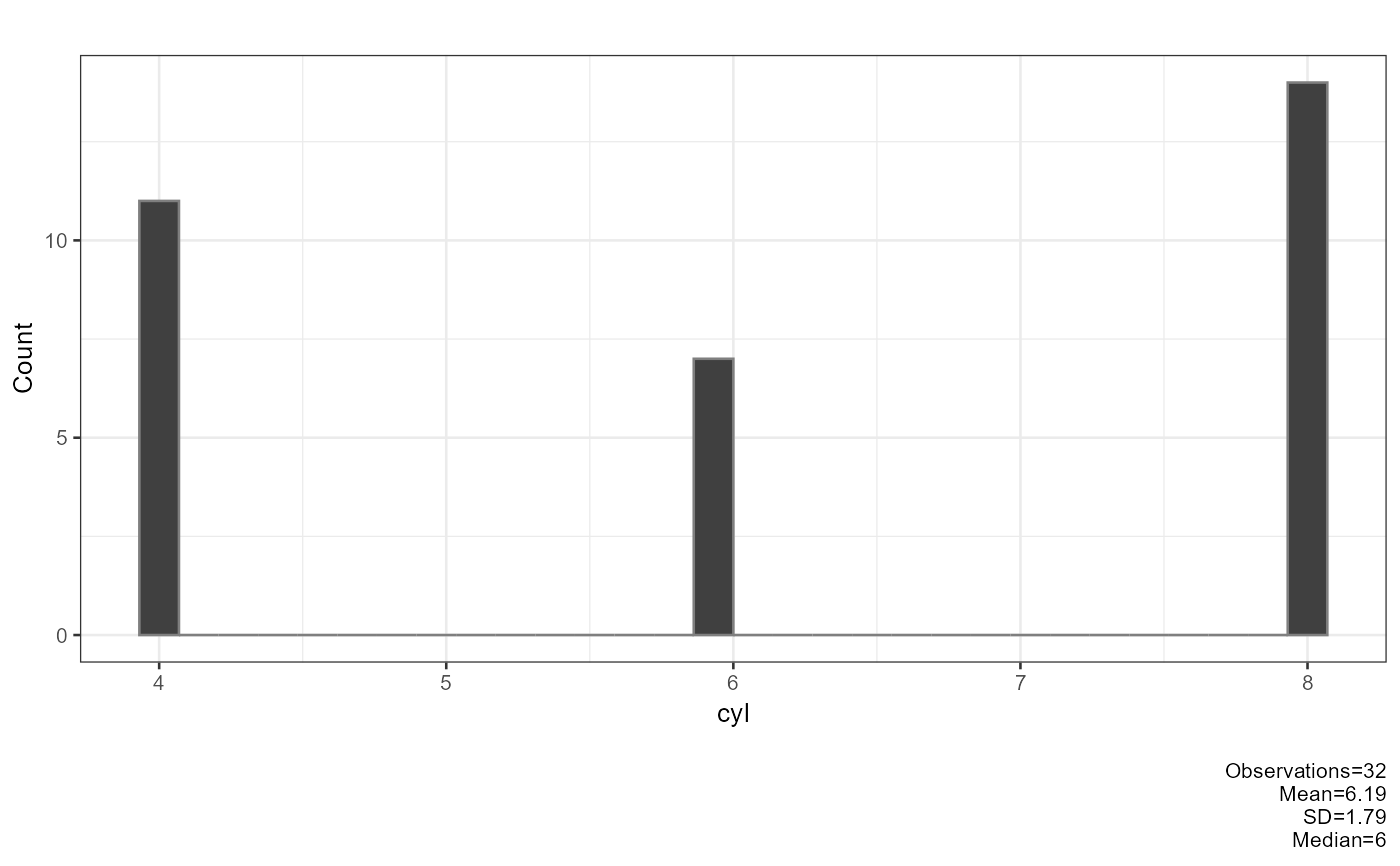
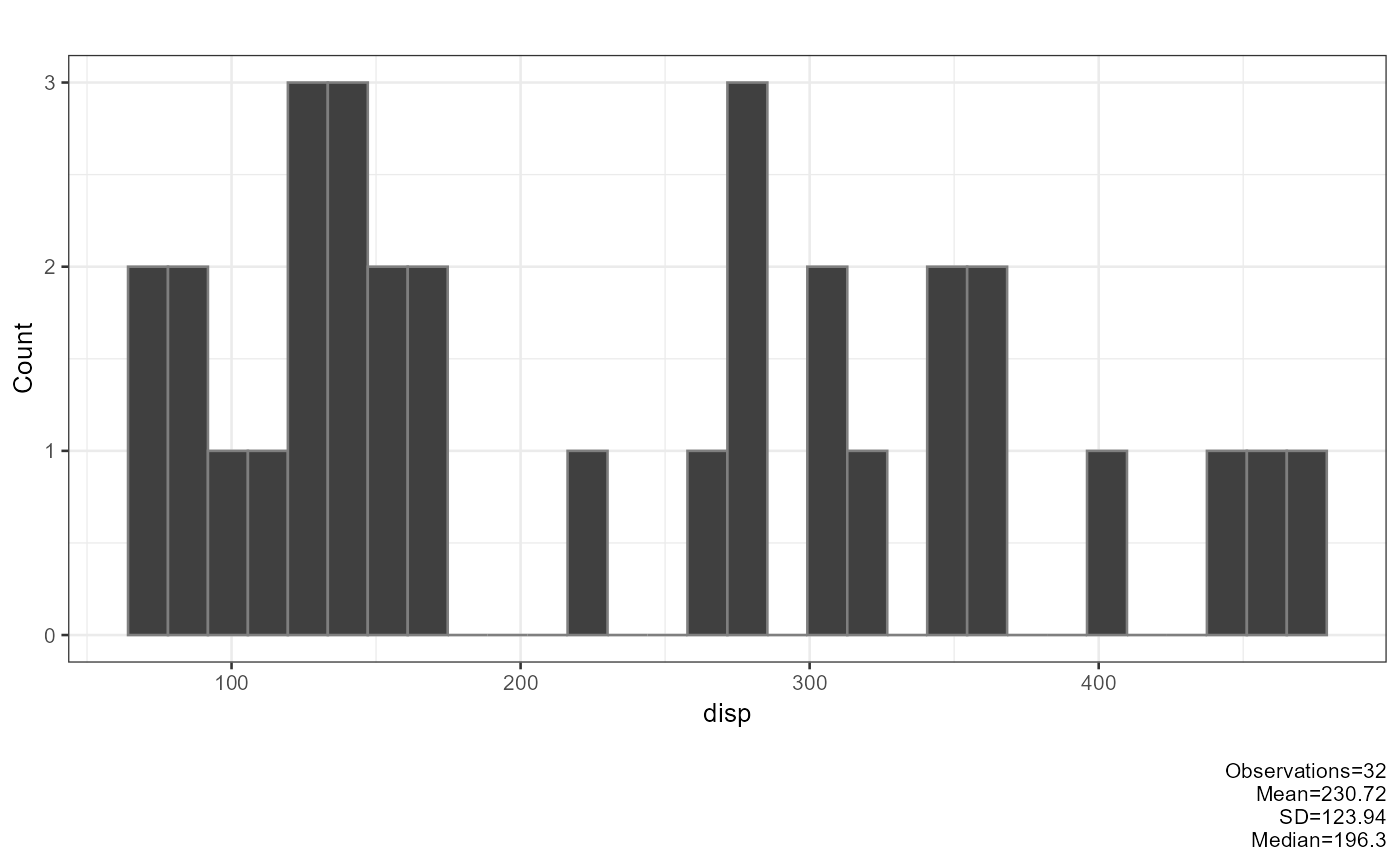
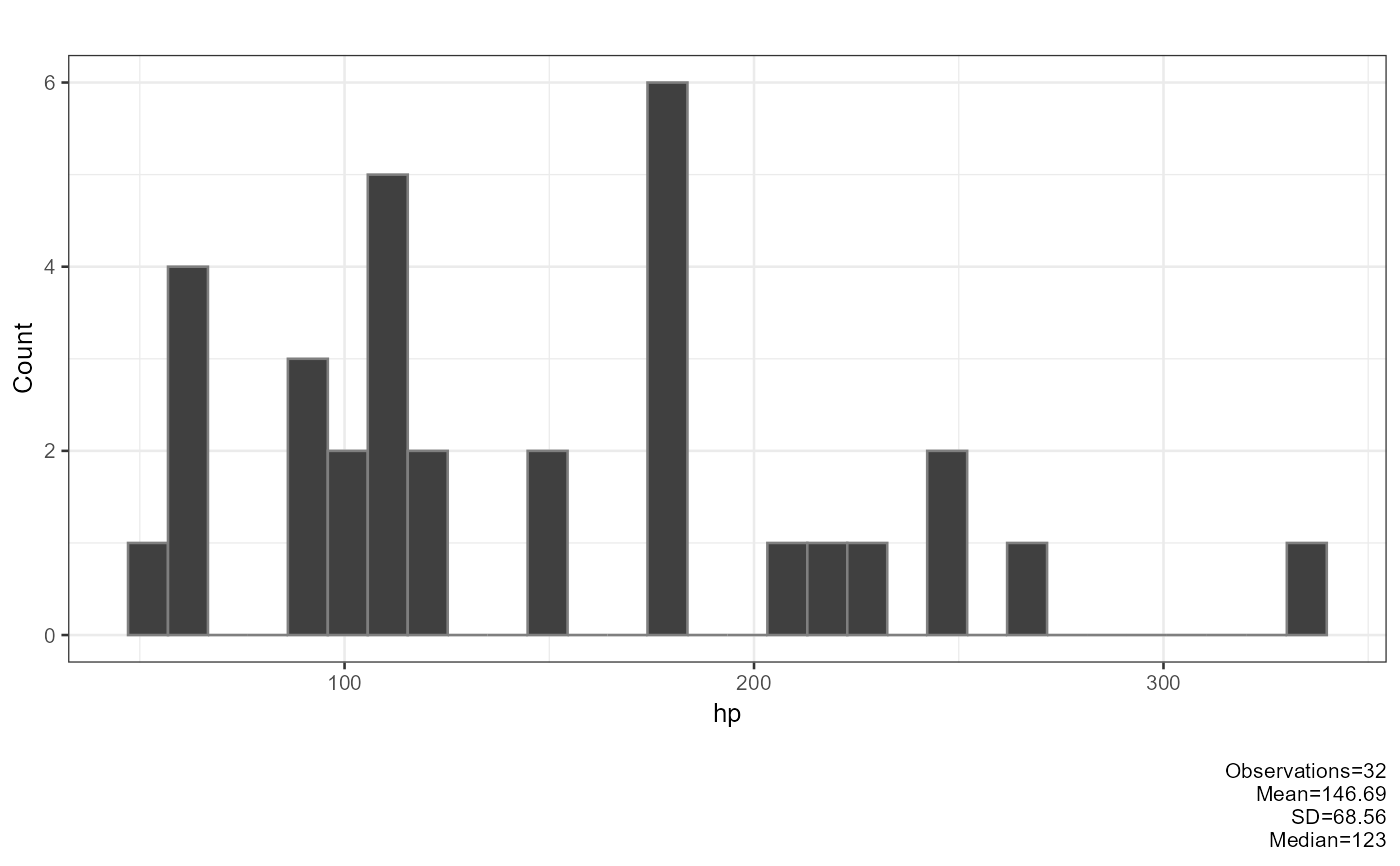
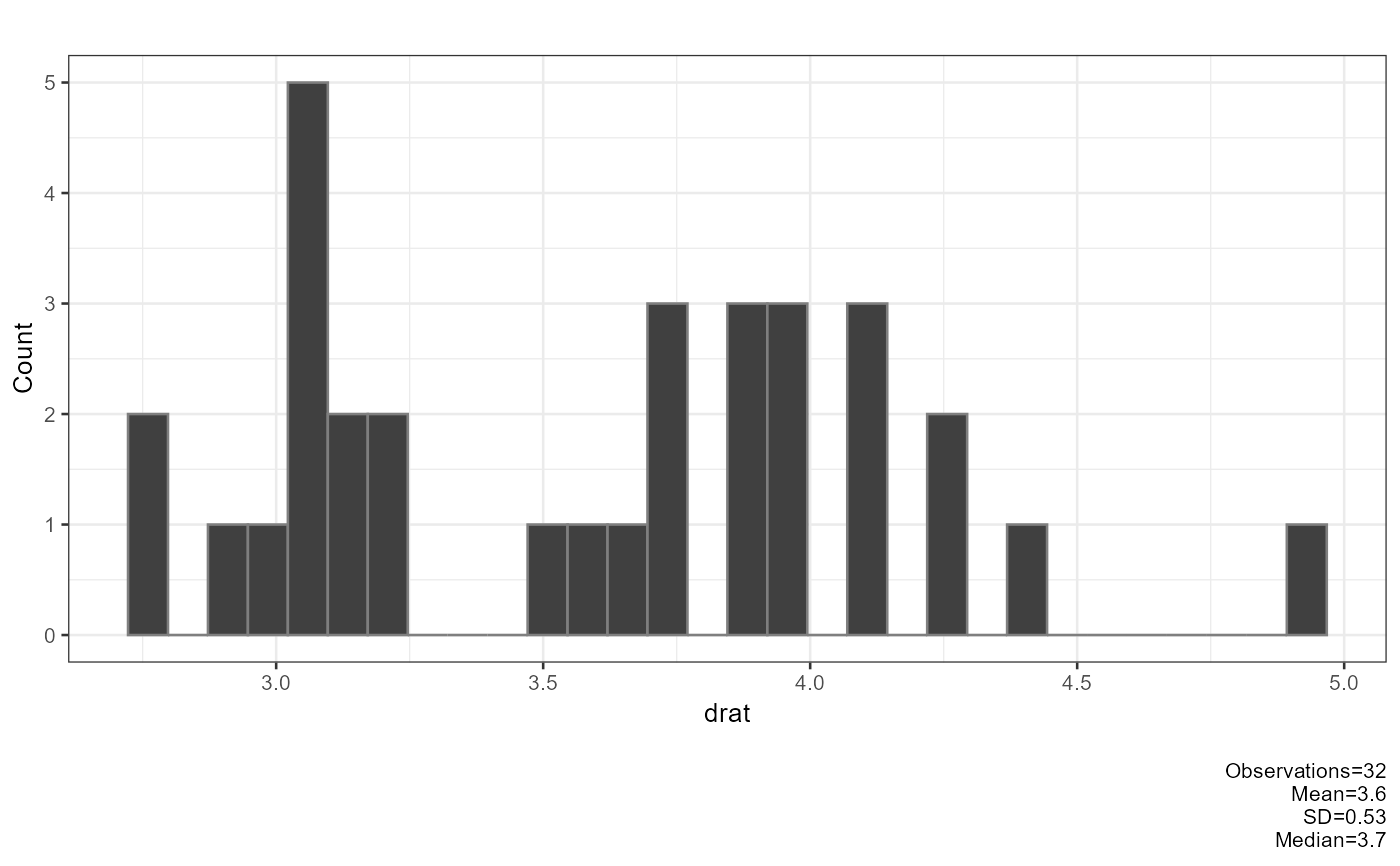
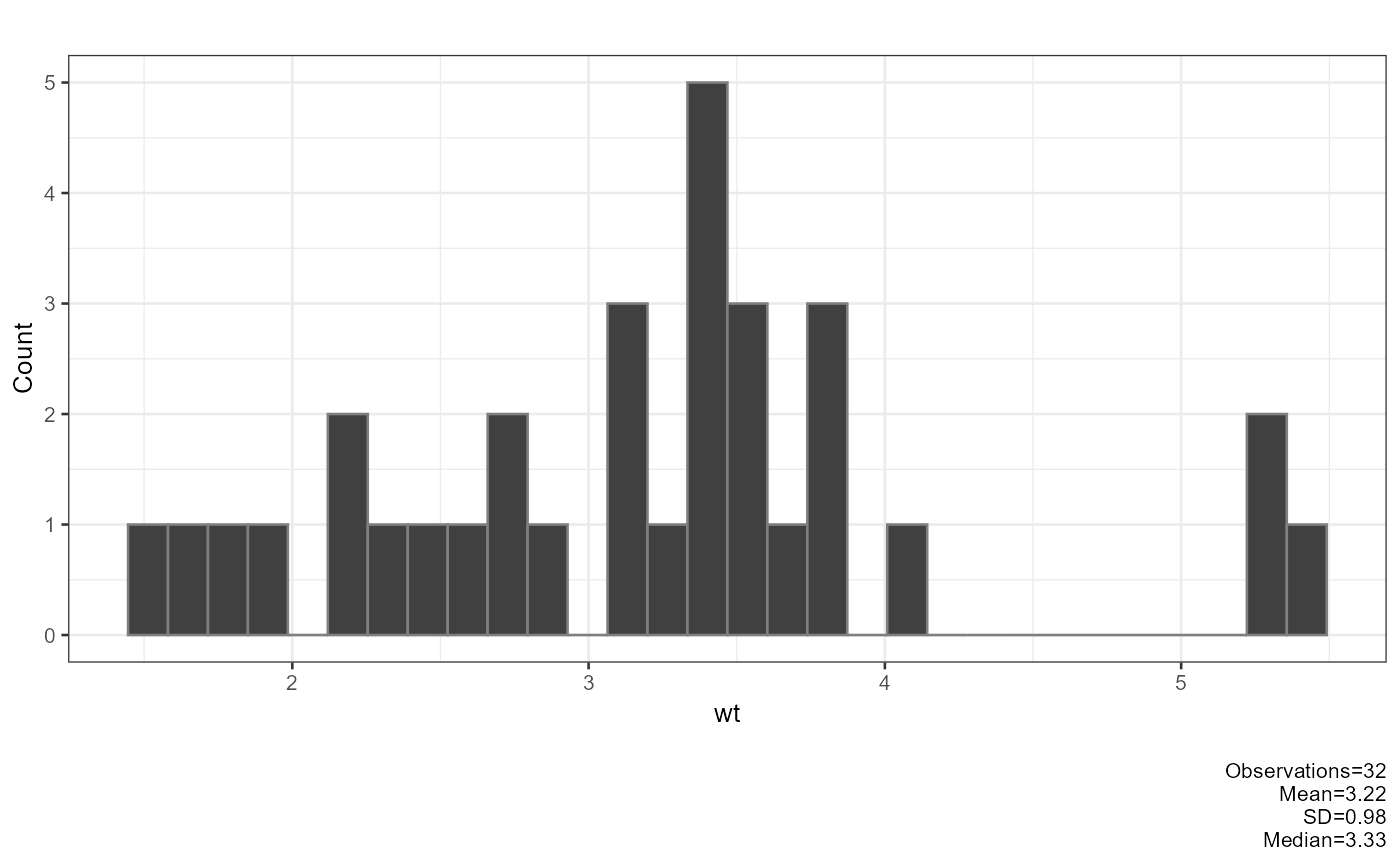
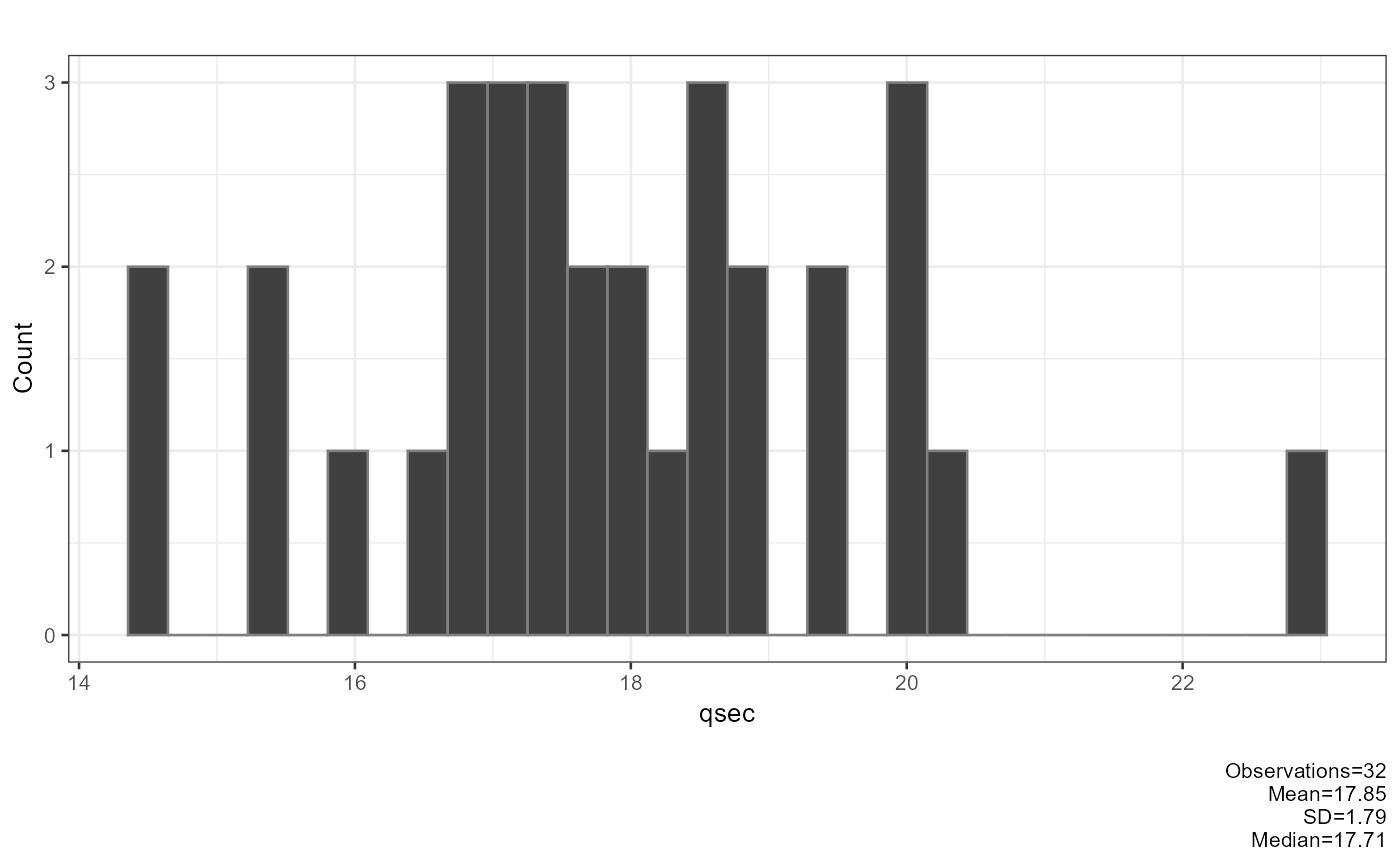
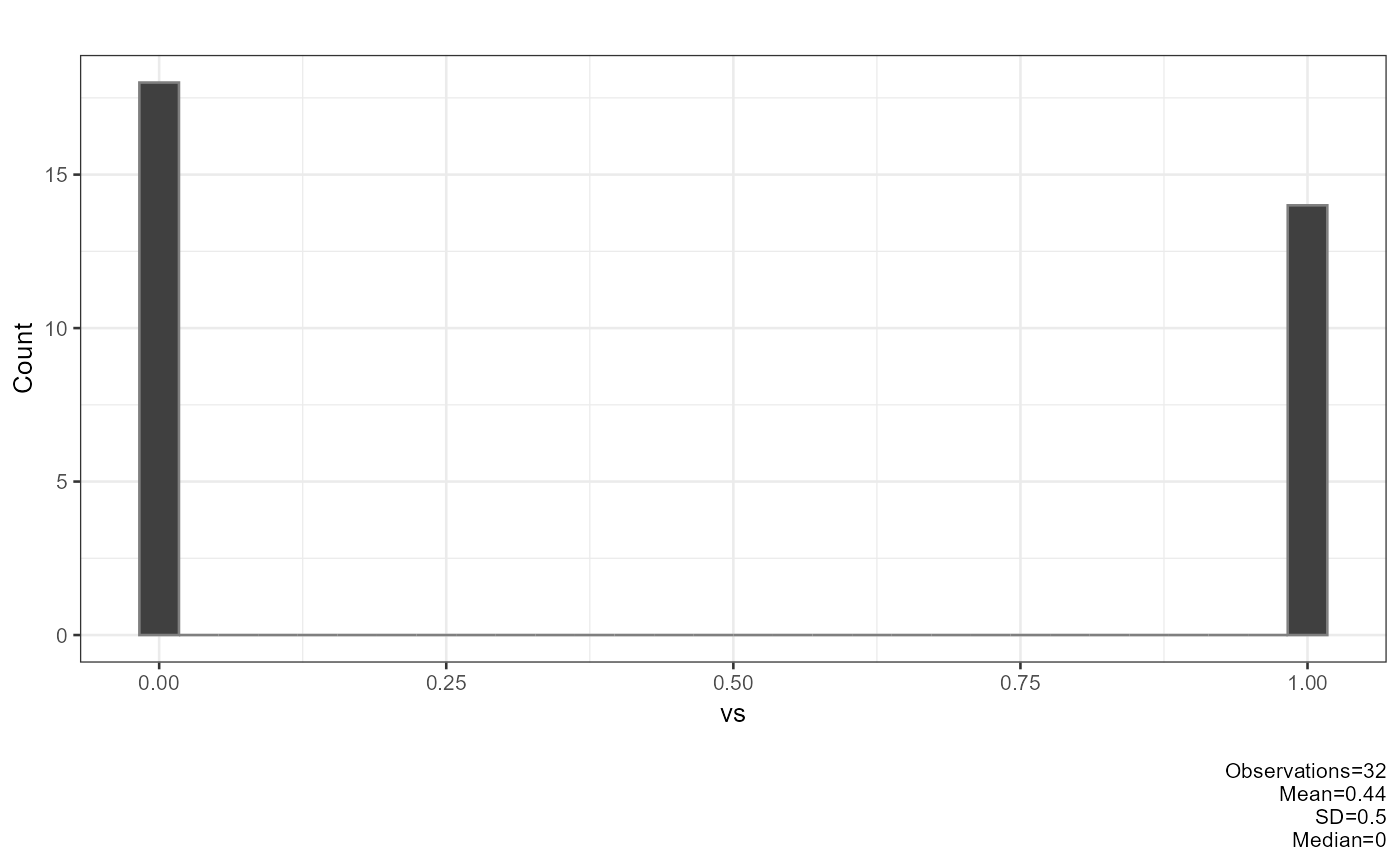
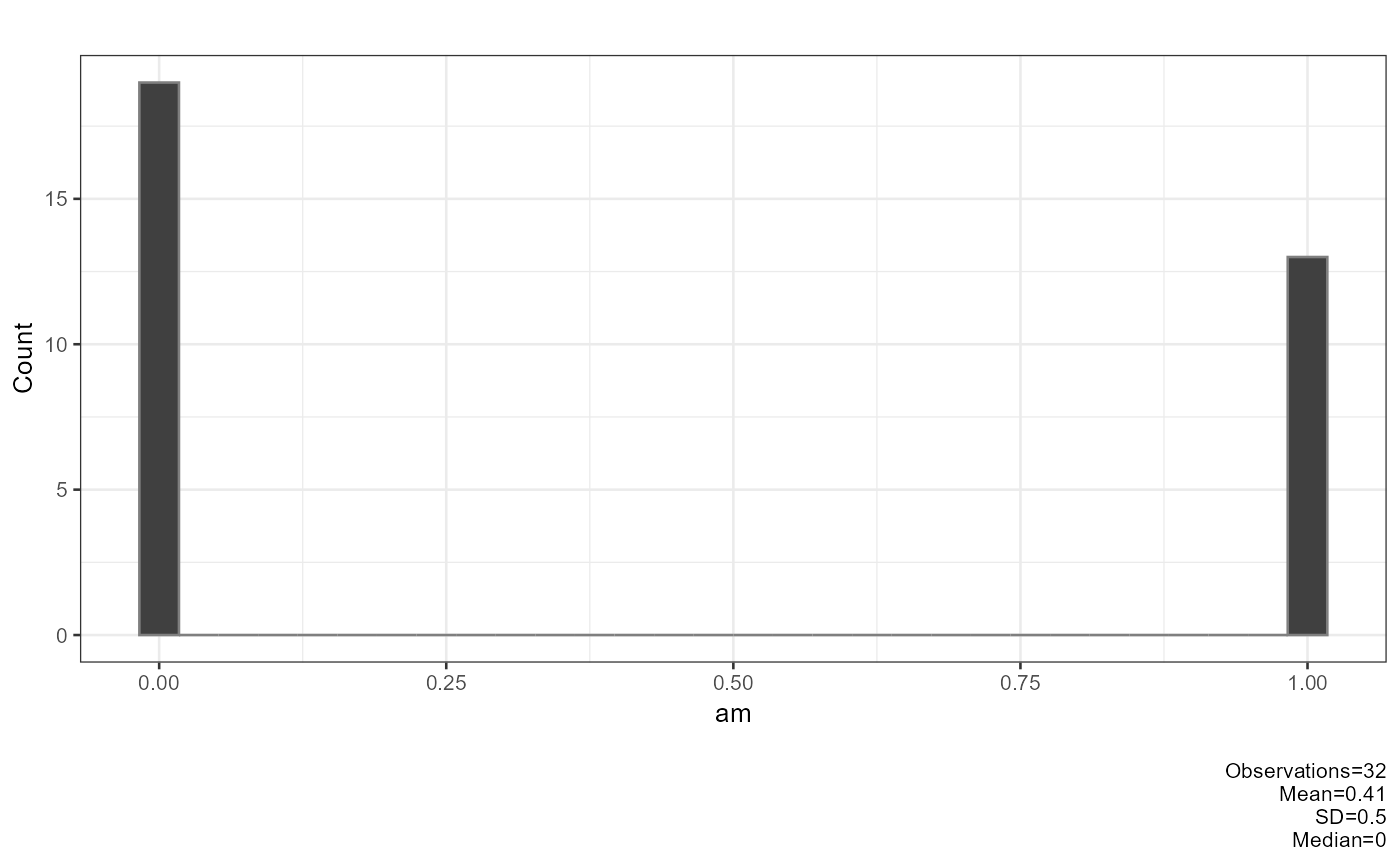
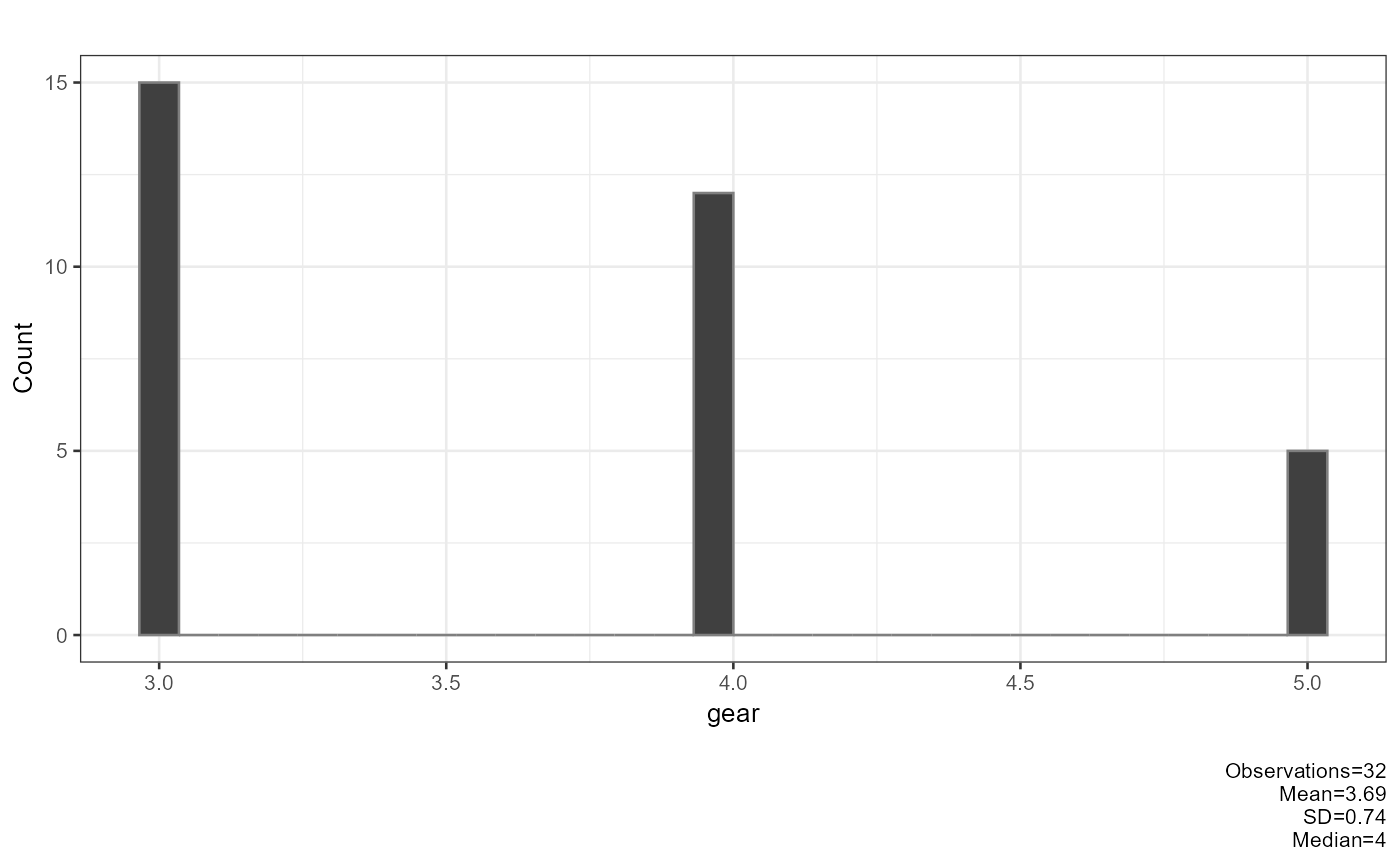
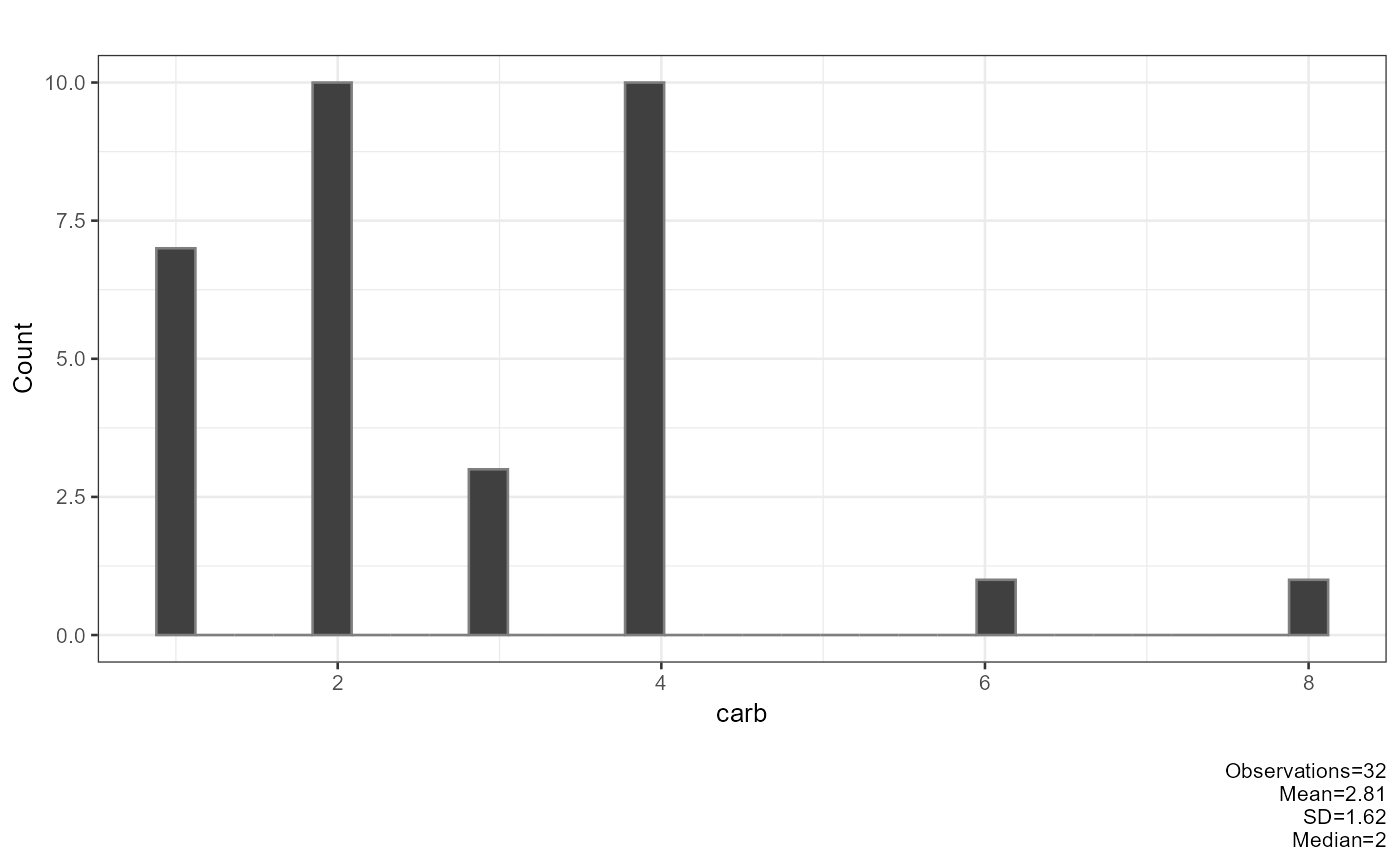
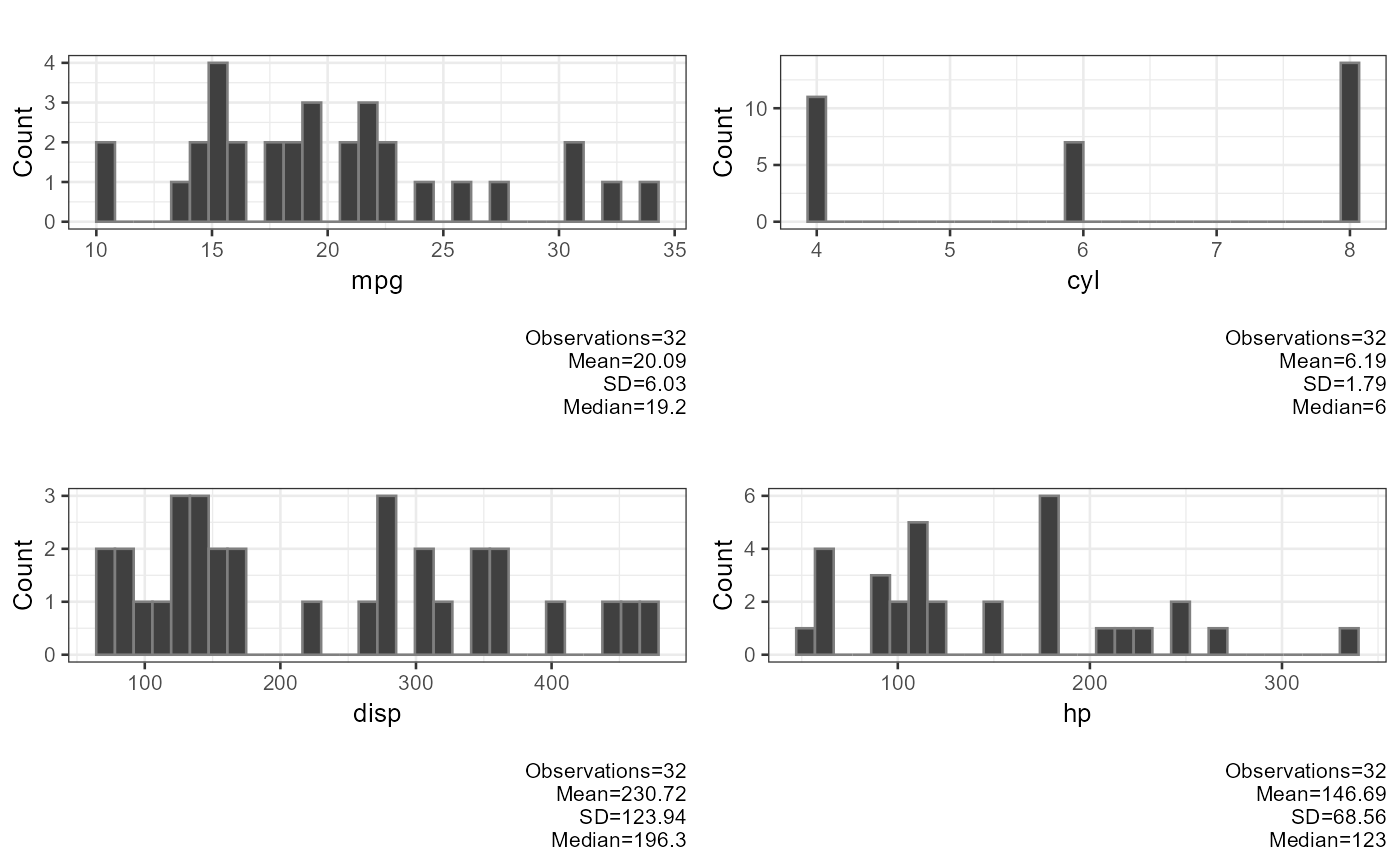
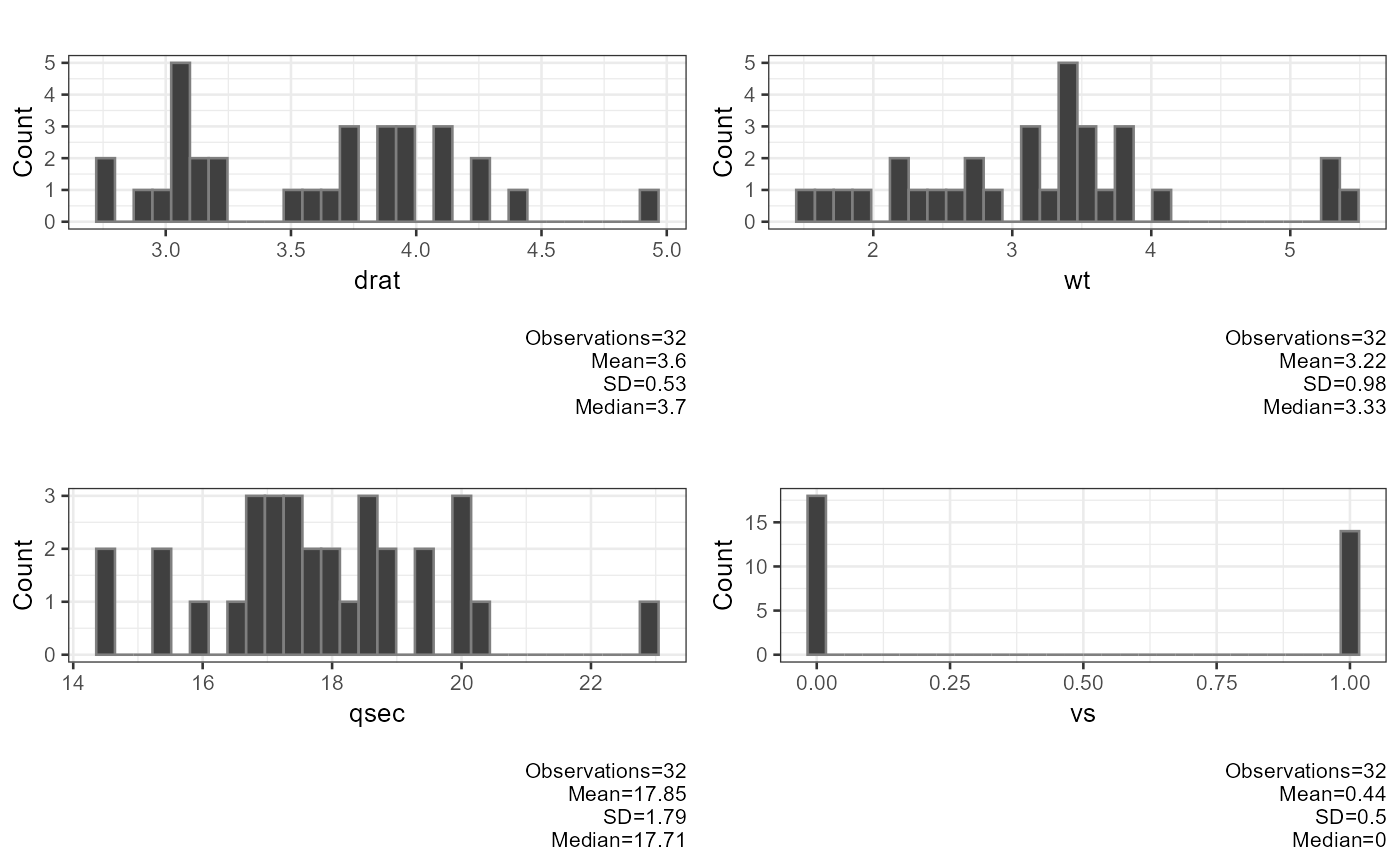
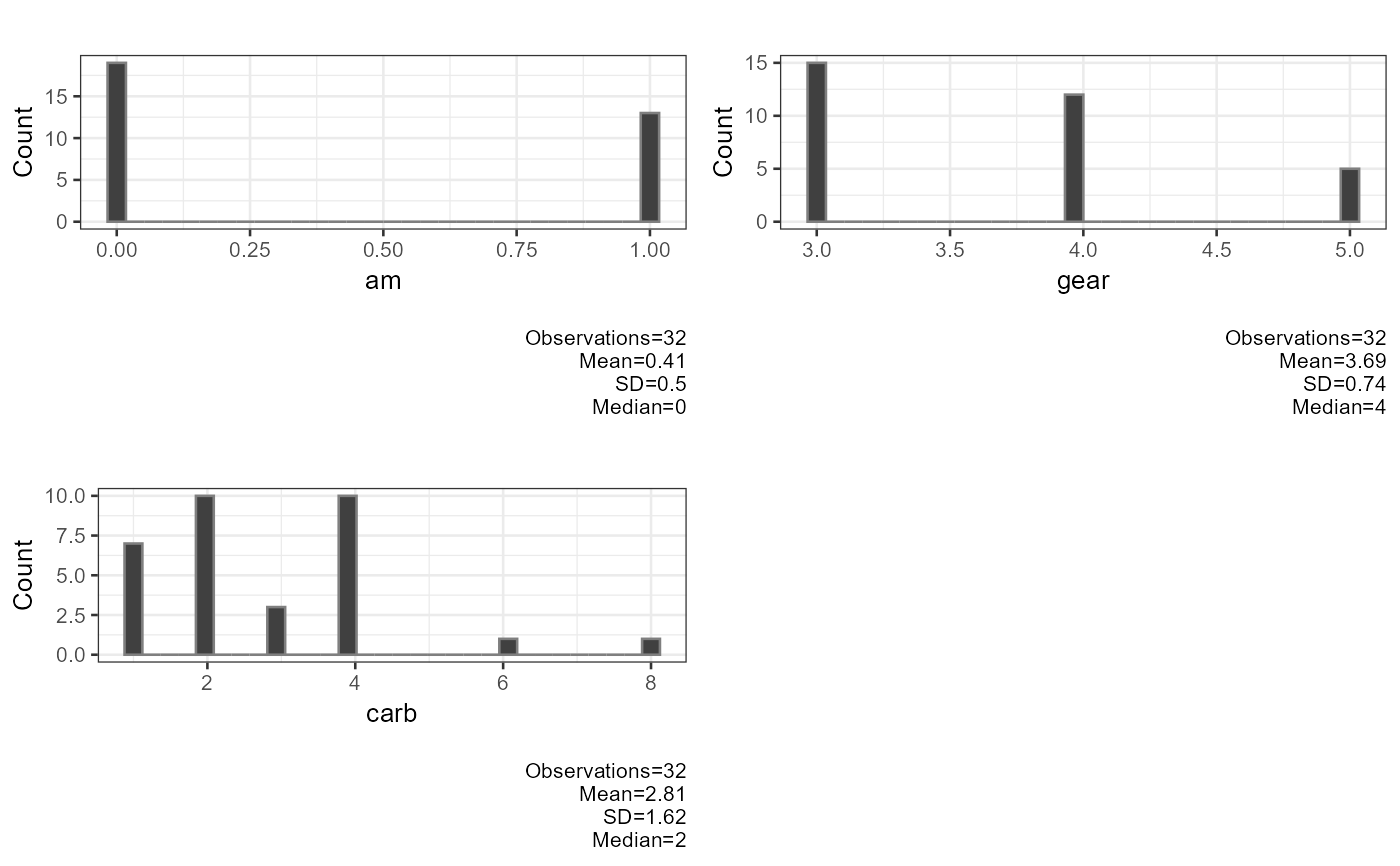 plot_multiplot(plotlist = cars_plot, layout = matrix(1:4, ncol = 2, byrow = TRUE))
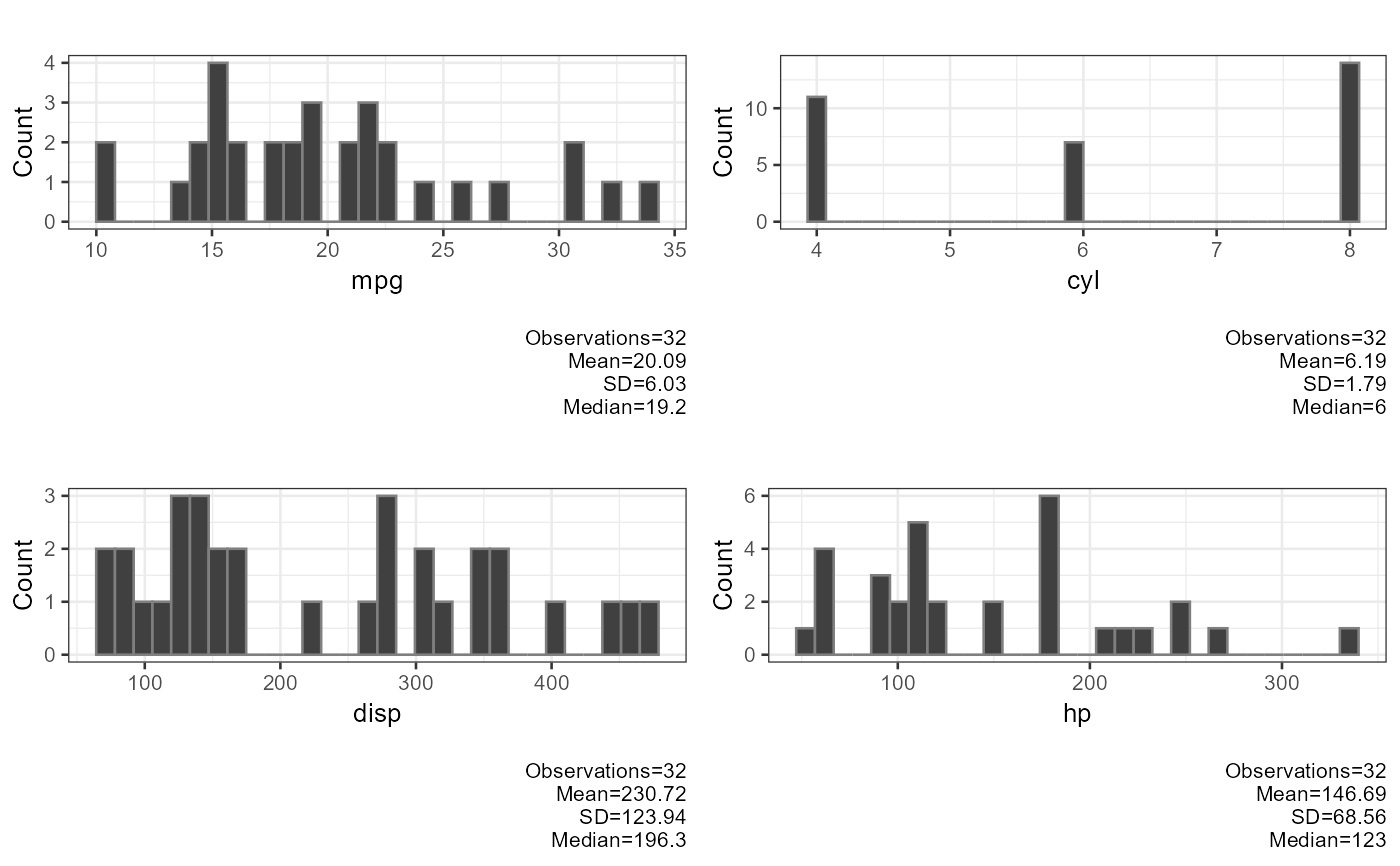 plot_multiplot(plotlist = cars_plot, cols = 3)