Normality diagnostic plots (histogram, density, boxplot, Q-Q)
Source:R/EXPLORE_ASSUMPTIONS.R
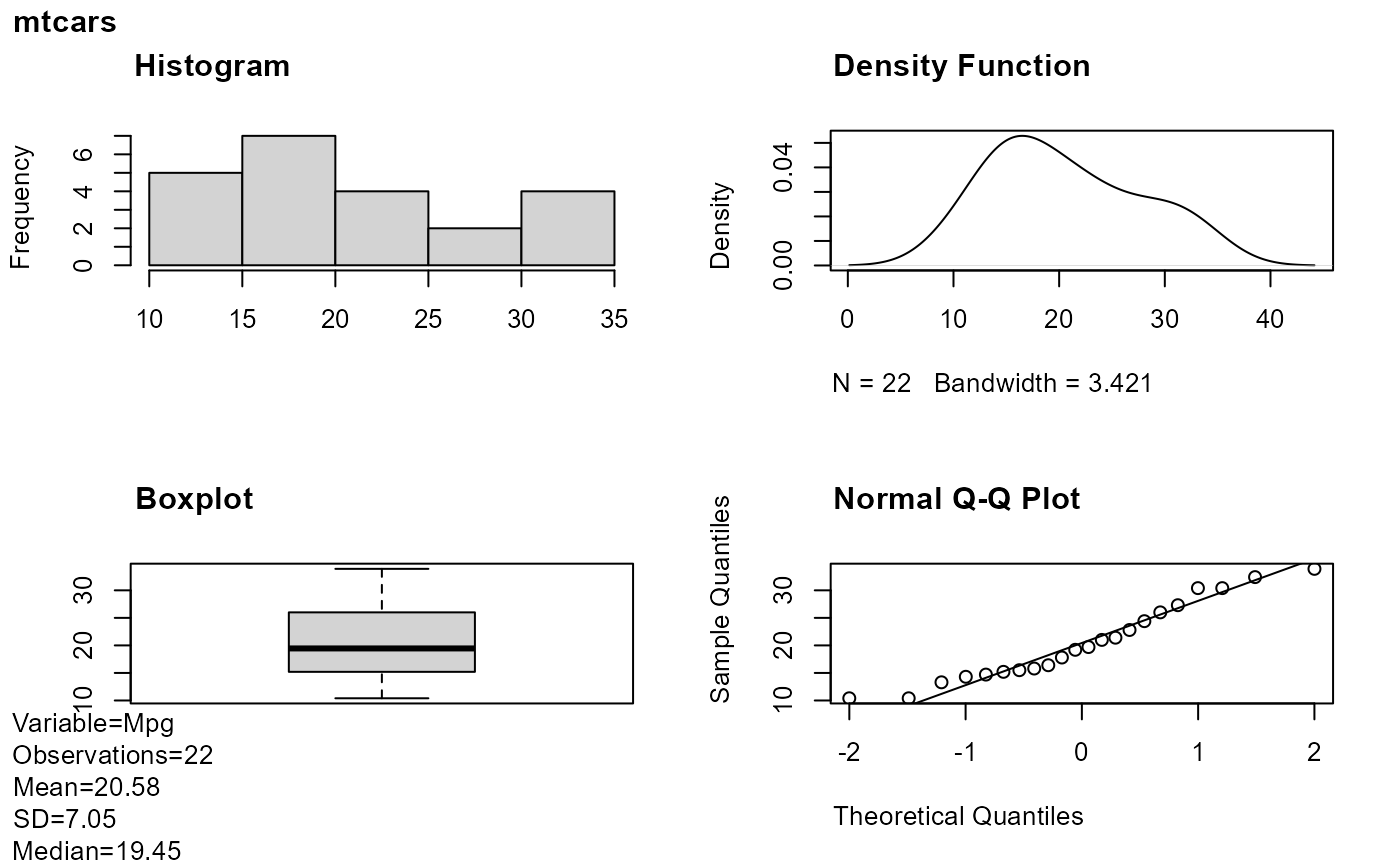
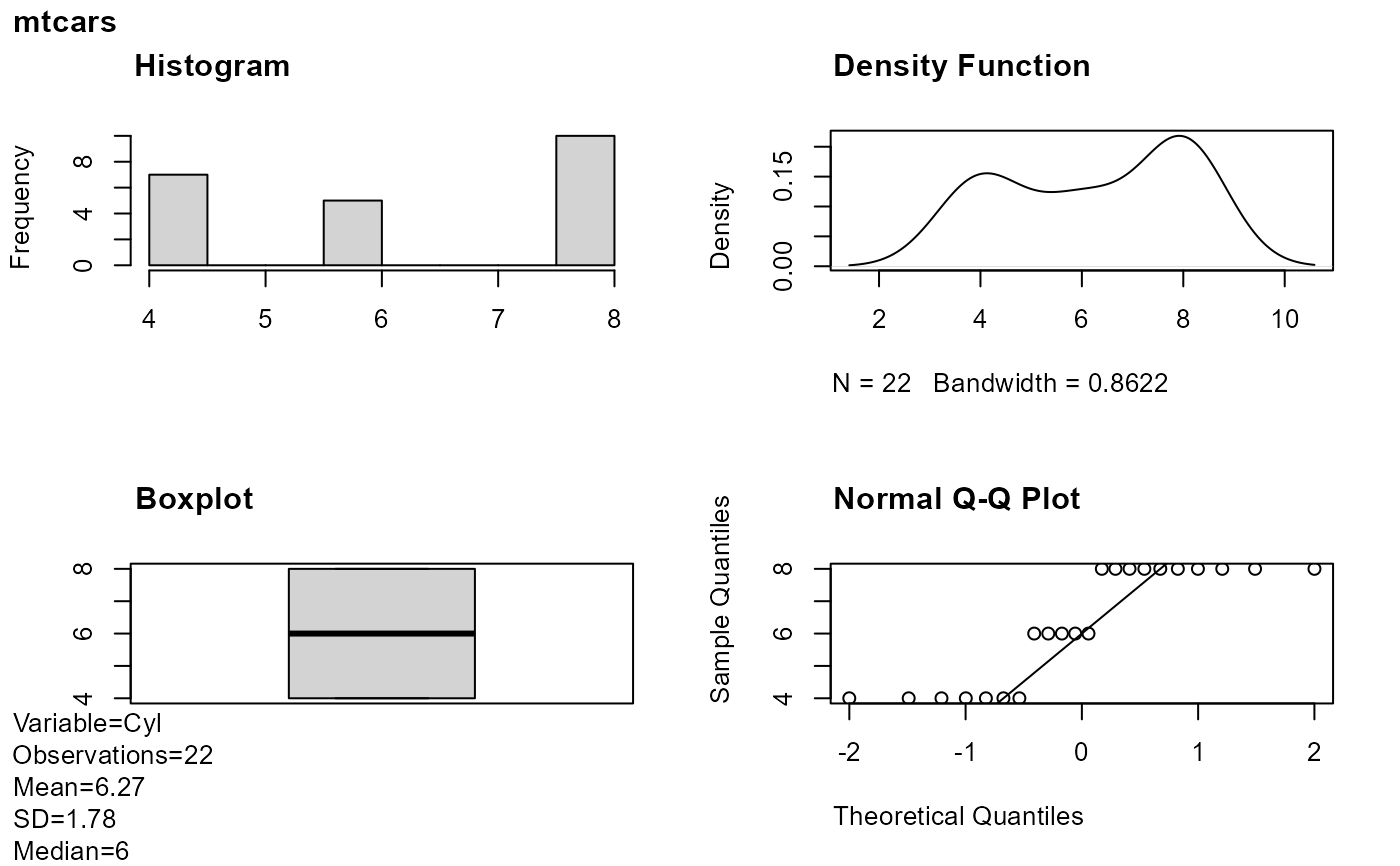
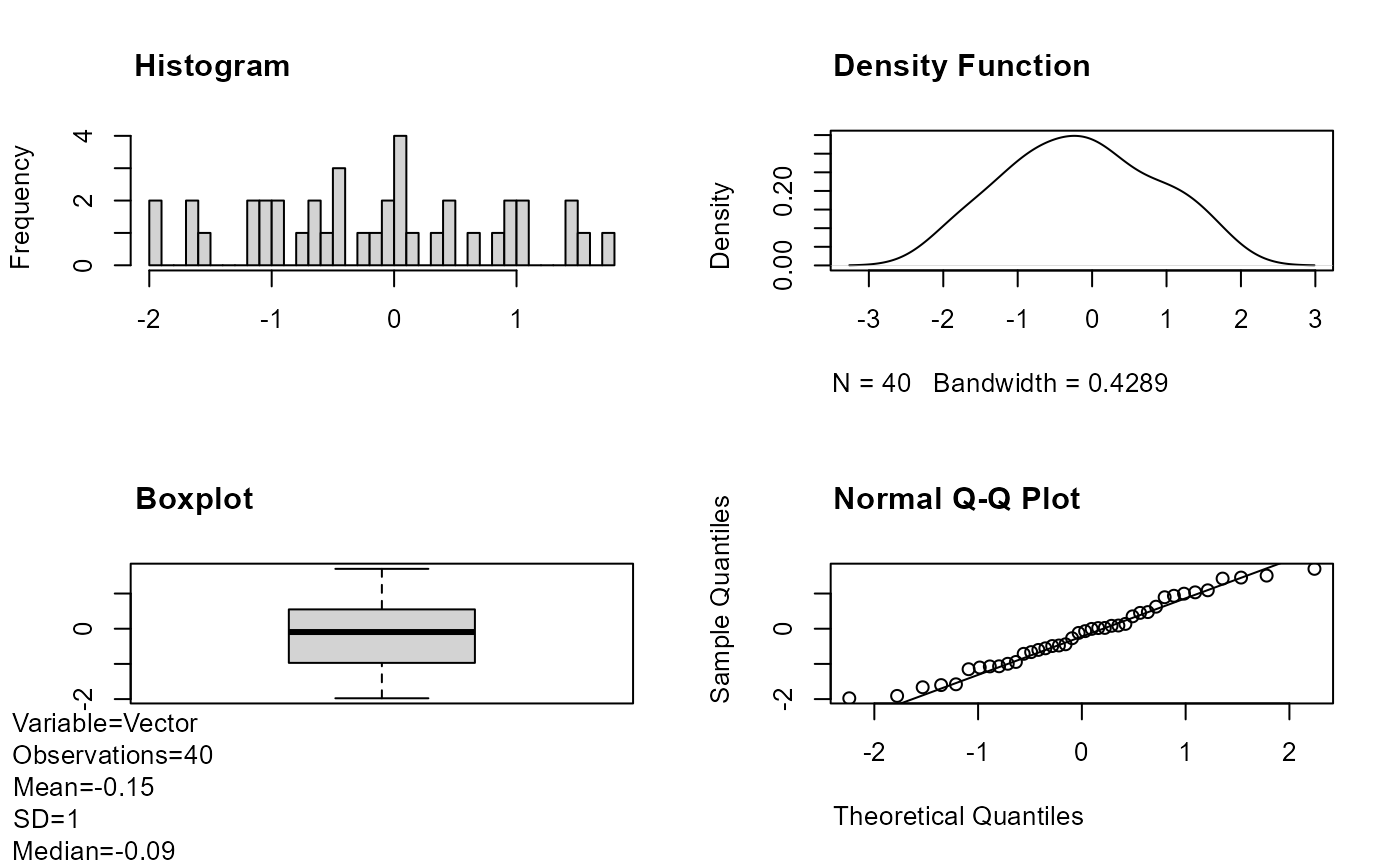
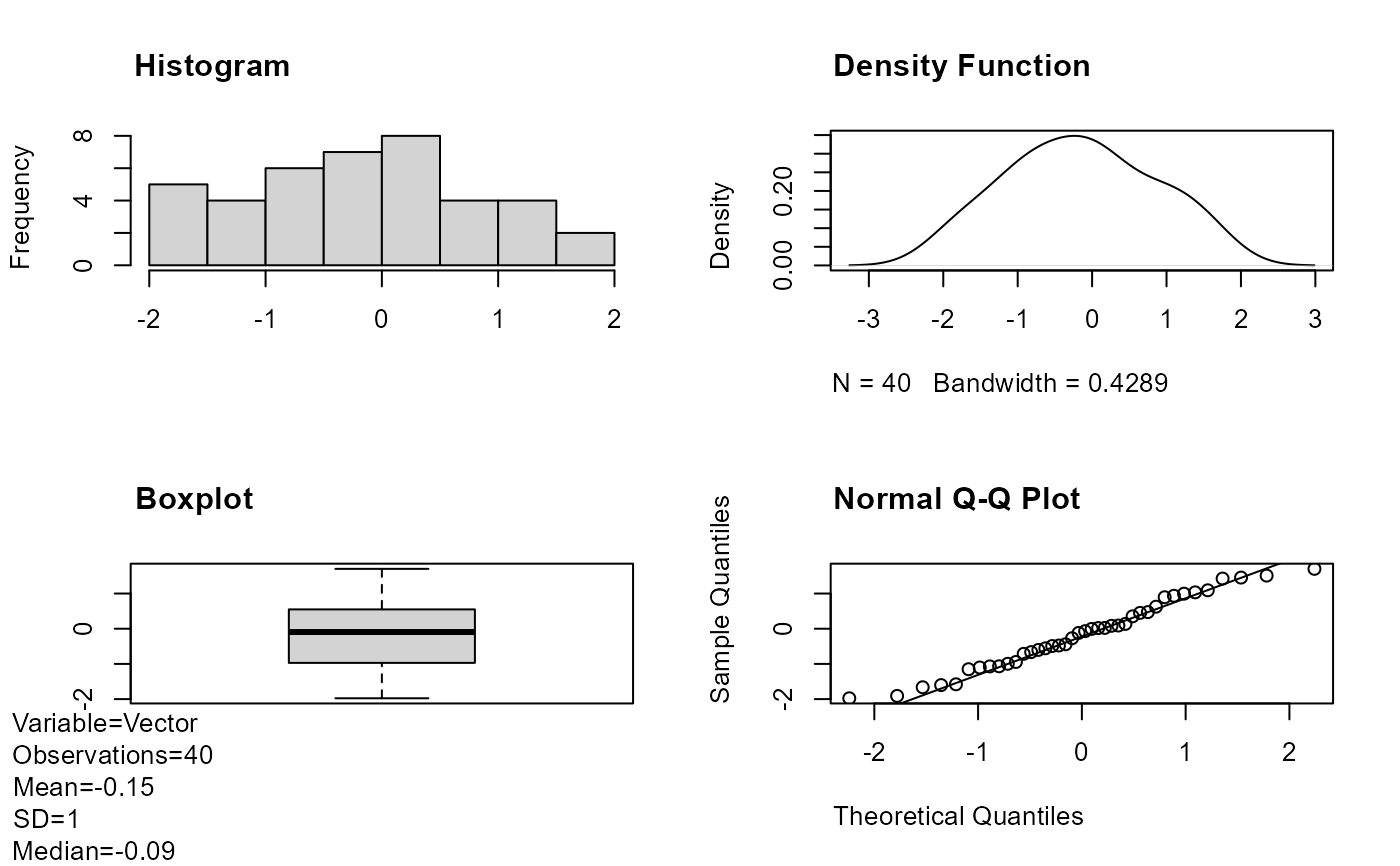
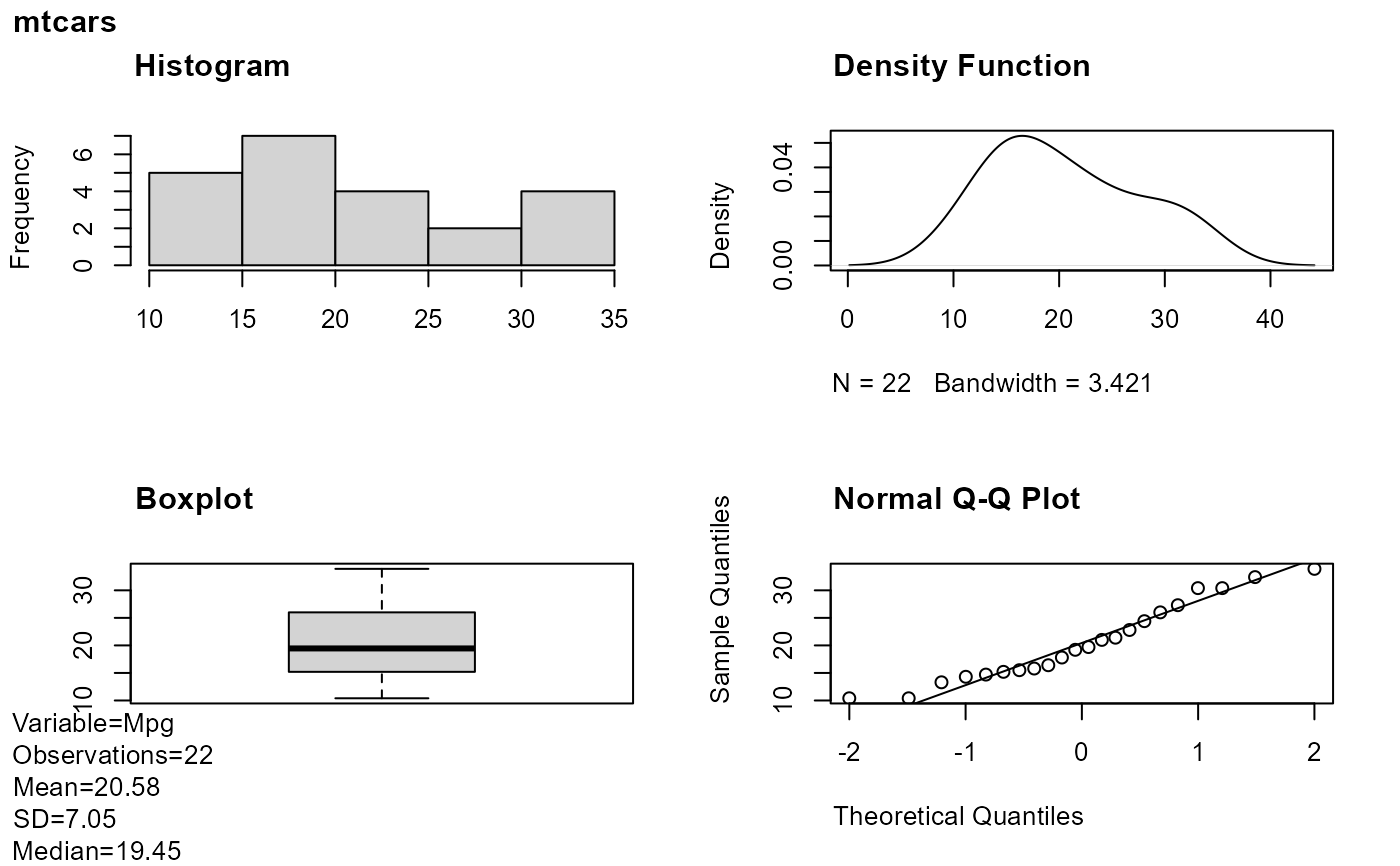
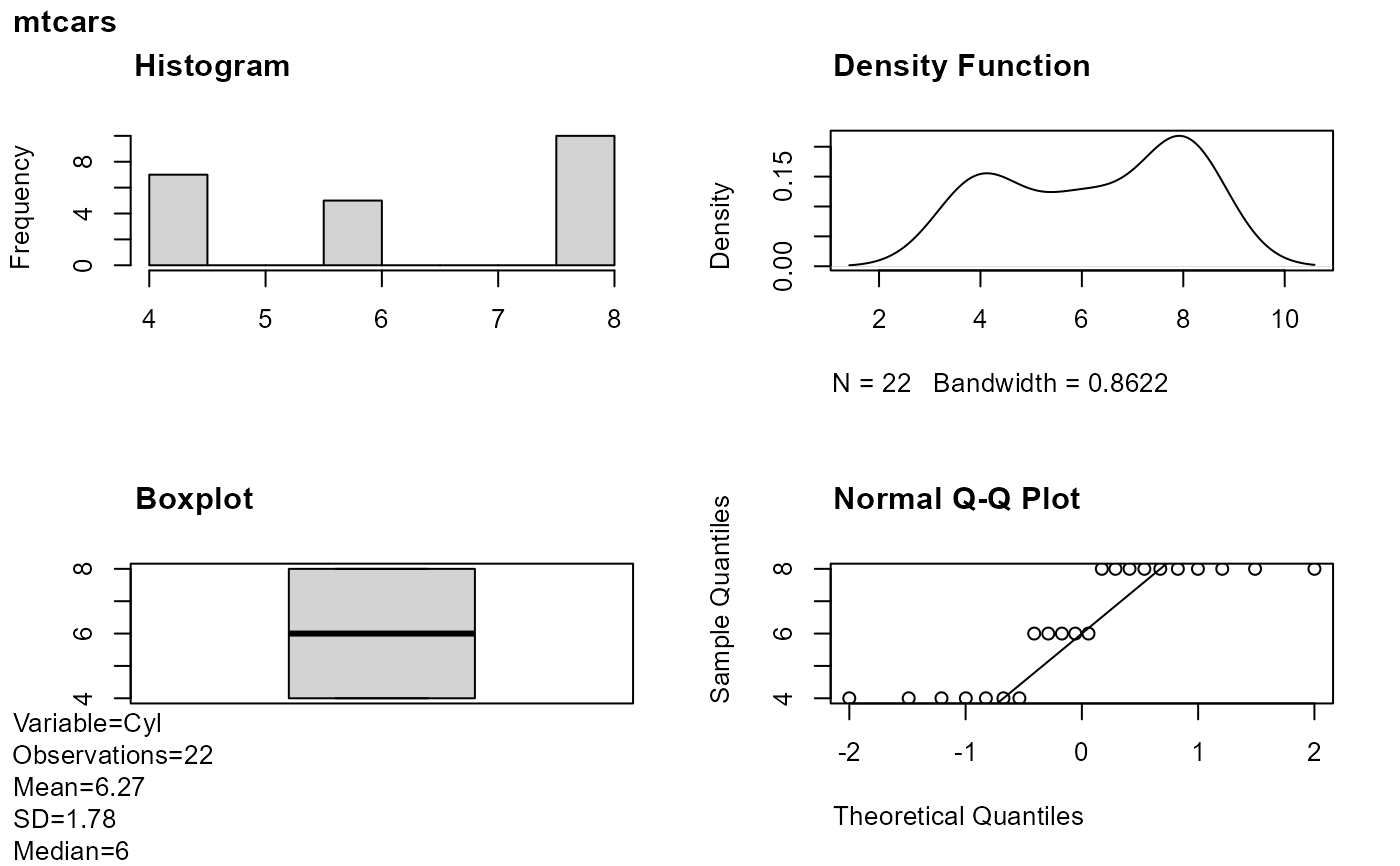
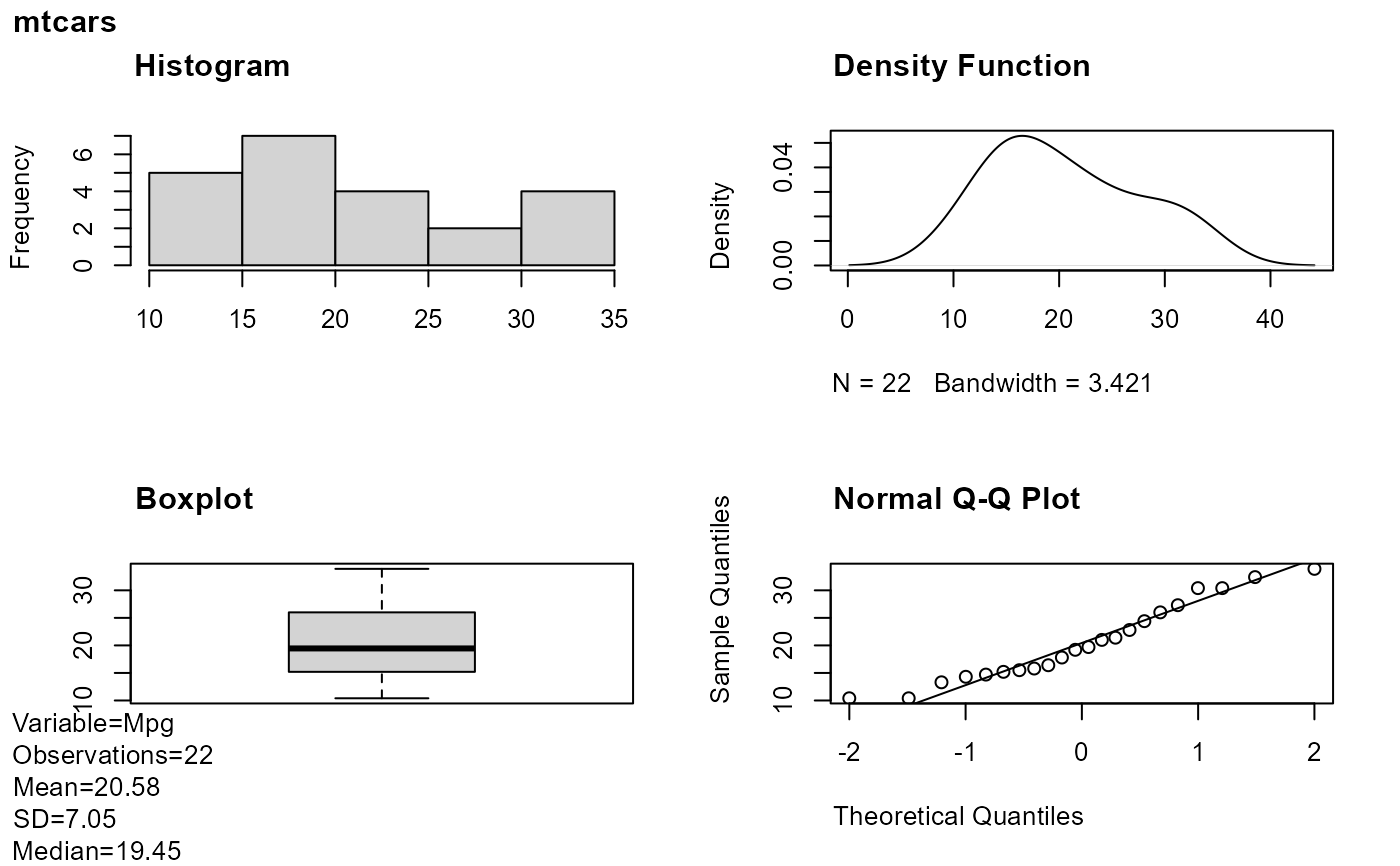
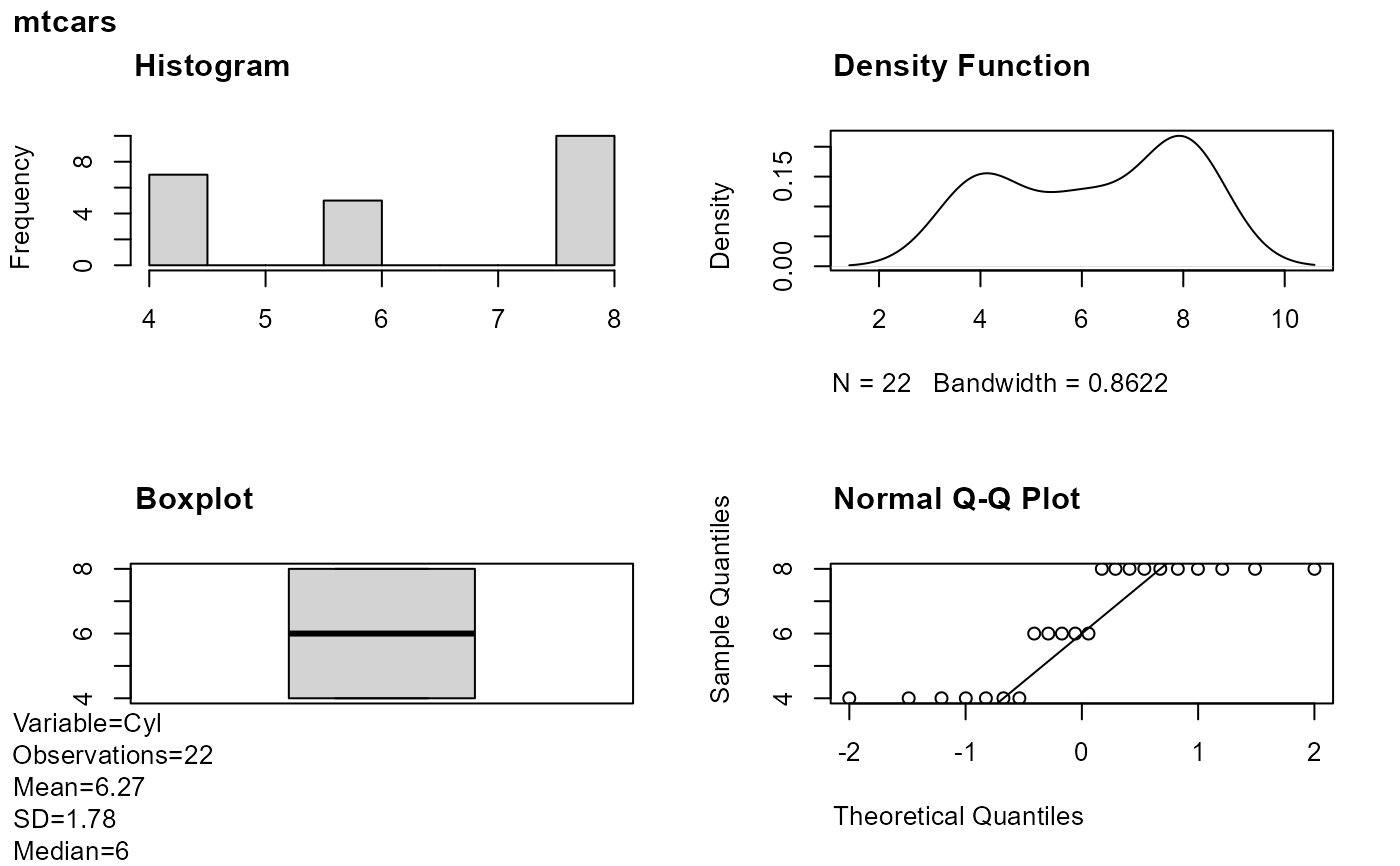
plot_normality_diagnostics.RdFor each numeric column of df, produces a 2×2 panel of
base-graphics normality diagnostics: histogram, density curve, boxplot, and
Q-Q plot with a reference line. When file is supplied the panels
are also written to a PDF.
Usage
plot_normality_diagnostics(
  df,
  breaks = NULL,
  title = "",
  file = NULL,
  w = 10,
  h = 10,
  pb = FALSE
)
Arguments
- df
Data frame or numeric vector. Non-numeric columns are silently dropped. Columns with fewer than three non-missing values or zero variance are skipped.
- breaks
Histogram breaks passed to
graphics::hist(). This may be a method name ("Sturges","Scott","FD") or a positive integer specifying the number of bins. Default is"Sturges".- title
Character string used as the outer plot title and as the PDF title. Default is
"".- file
Character string naming the output PDF file (without extension). When
NULL(default) no PDF is written.- w
Width of the PDF in inches. Default is
10.- h
Height of the PDF in inches. Default is
10.- pb
Logical; whether to display a progress bar in the console. Default is
FALSE.
Value
A named list of recorded plots (one element per numeric column),
returned invisibly. Each element is a plot recorded with
grDevices::recordPlot().
Examples
vector <- generate_missing(rnorm(50), missing = 10)
df <- generate_missing(mtcars[, 1:2], missing = 10)
plot_normality_diagnostics(df = vector, file = "rnorm", breaks = 30)
 plot_normality_diagnostics(df = vector)
 plot_normality_diagnostics(df = df, title = "mtcars")
 plot_normality_diagnostics(df = df, title = "mtcars", pb = TRUE)
#>
|
| | 0%
|
|=============================================================================================== | 50%
 #>
|
|==============================================================================================================================================================================================| 100%
 #>
plot_normality_diagnostics(df = df, title = "mtcars", file = "rnorm")