Overview
golemirt is an R package with an interactive Shiny application, built with golem, for learning and teaching Item Response Theory (IRT). It brings together two earlier apps in one site:
- modelsirt, which draws the response curves of the main IRT models, so that you can see how each item parameter shapes them;
- mleirt, which shows how abilities and item parameters are estimated, by maximum likelihood and by Bayesian EAP and MAP estimation.
Both were adapted from the irtDemo package by Wes Bonifay and Metin Bulus. Every plot is an interactive plotly chart that is redrawn as soon as a slider moves.
Features
The app has eleven tabs in two menus.
Models menu
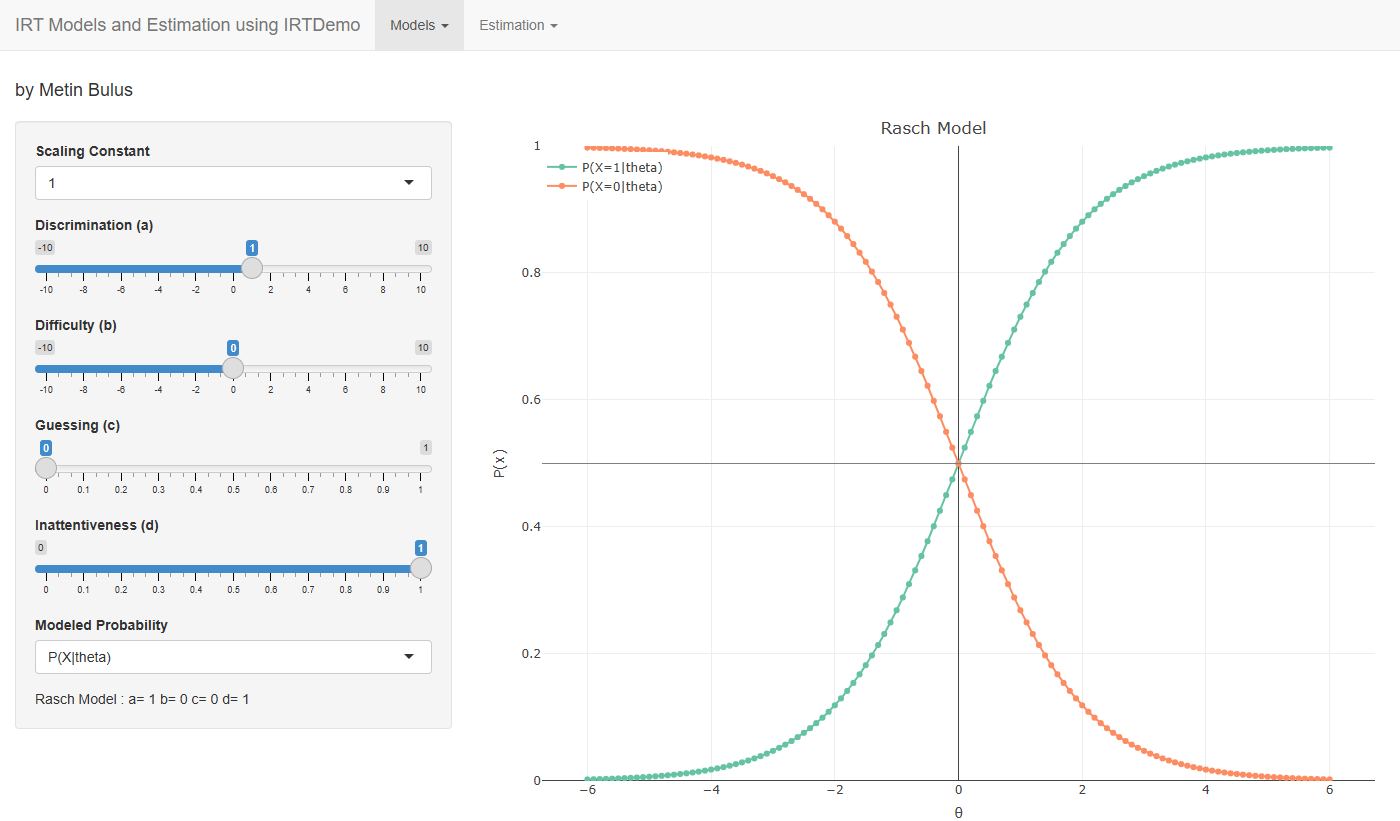
- Rasch-4PL: the item characteristic curve of a dichotomous item under the Rasch, 1PL, 2PL, 3PL and 4PL models, with the name of the model that the parameters define
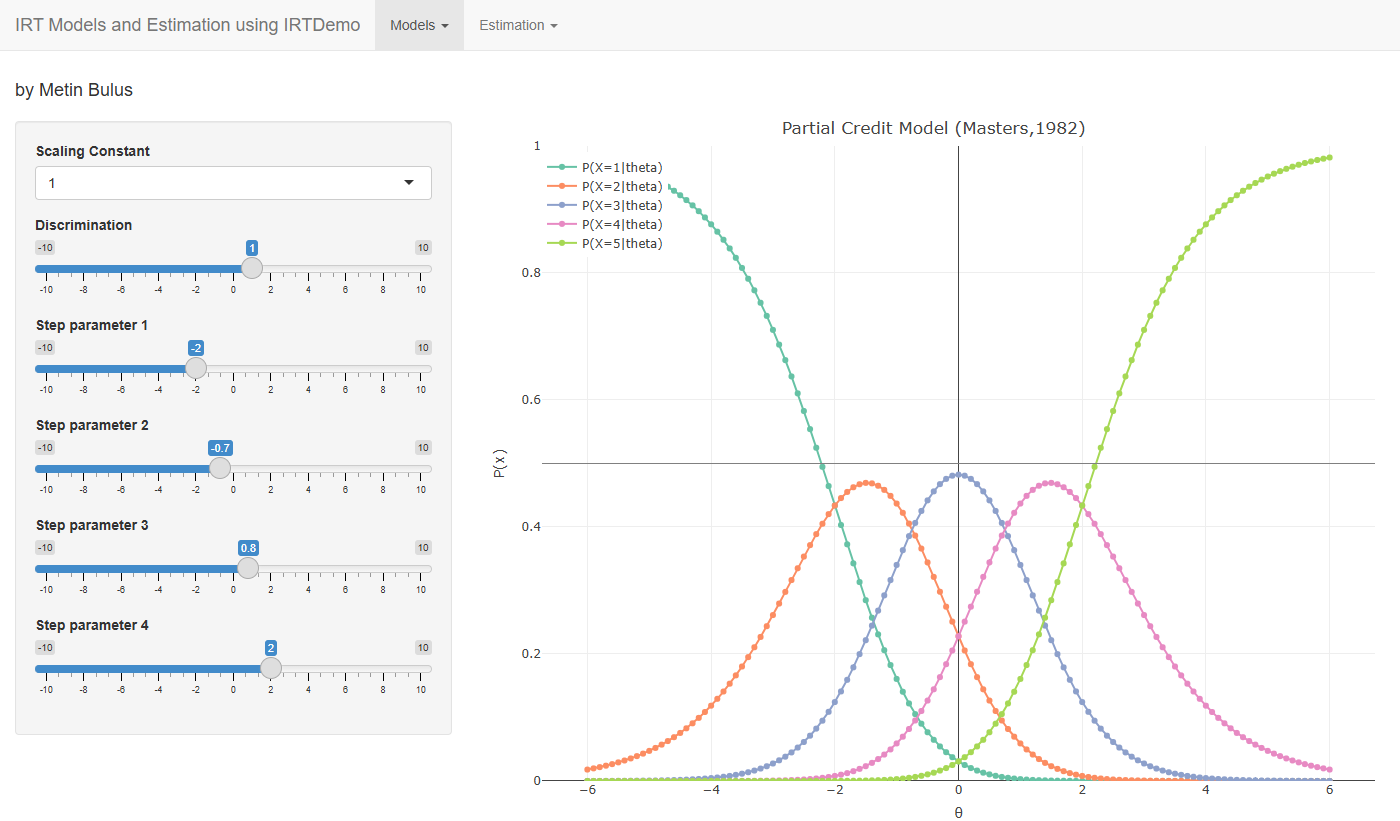
- PCM-GPCM: category response curves of the partial credit and generalized partial credit models
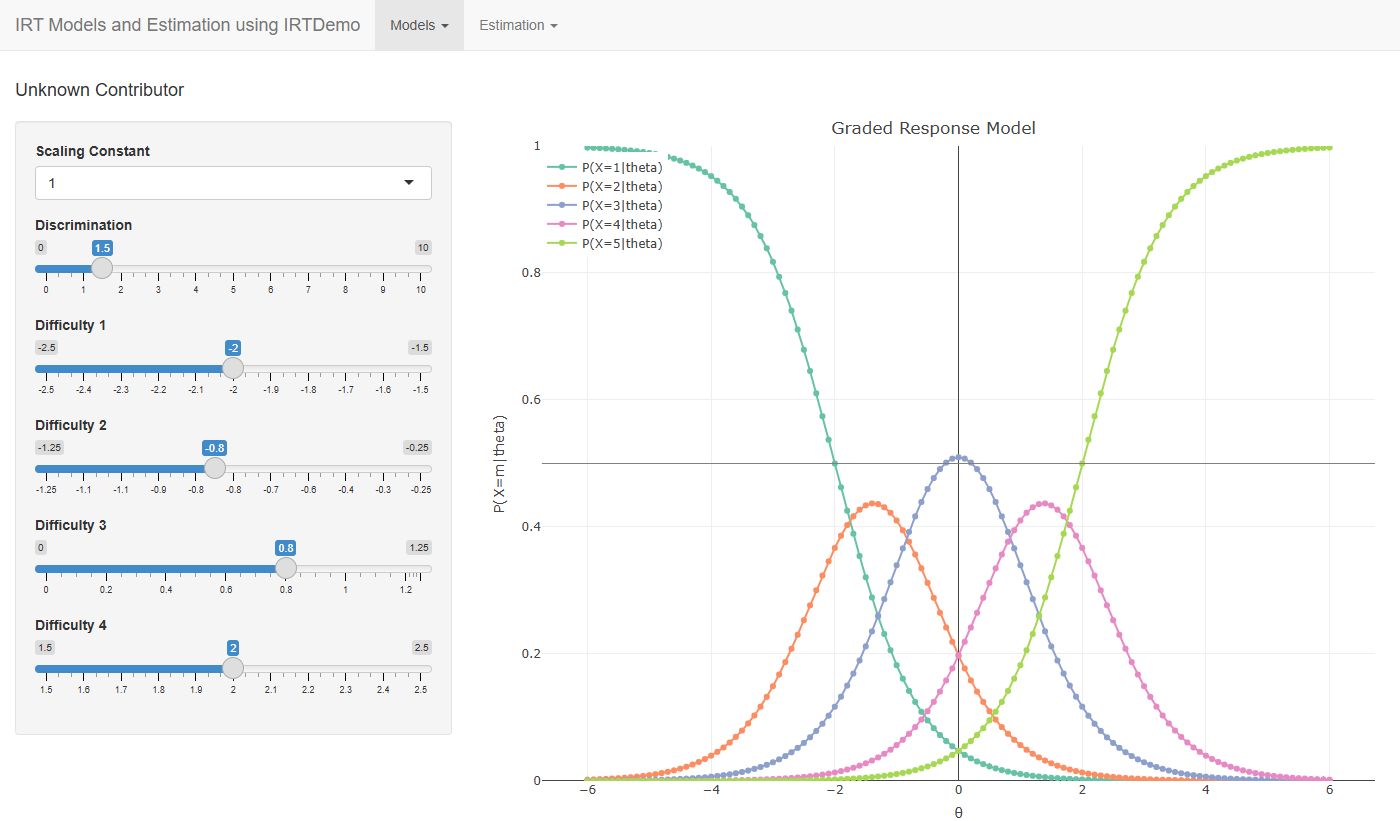
- GRM: category response curves of the graded response model
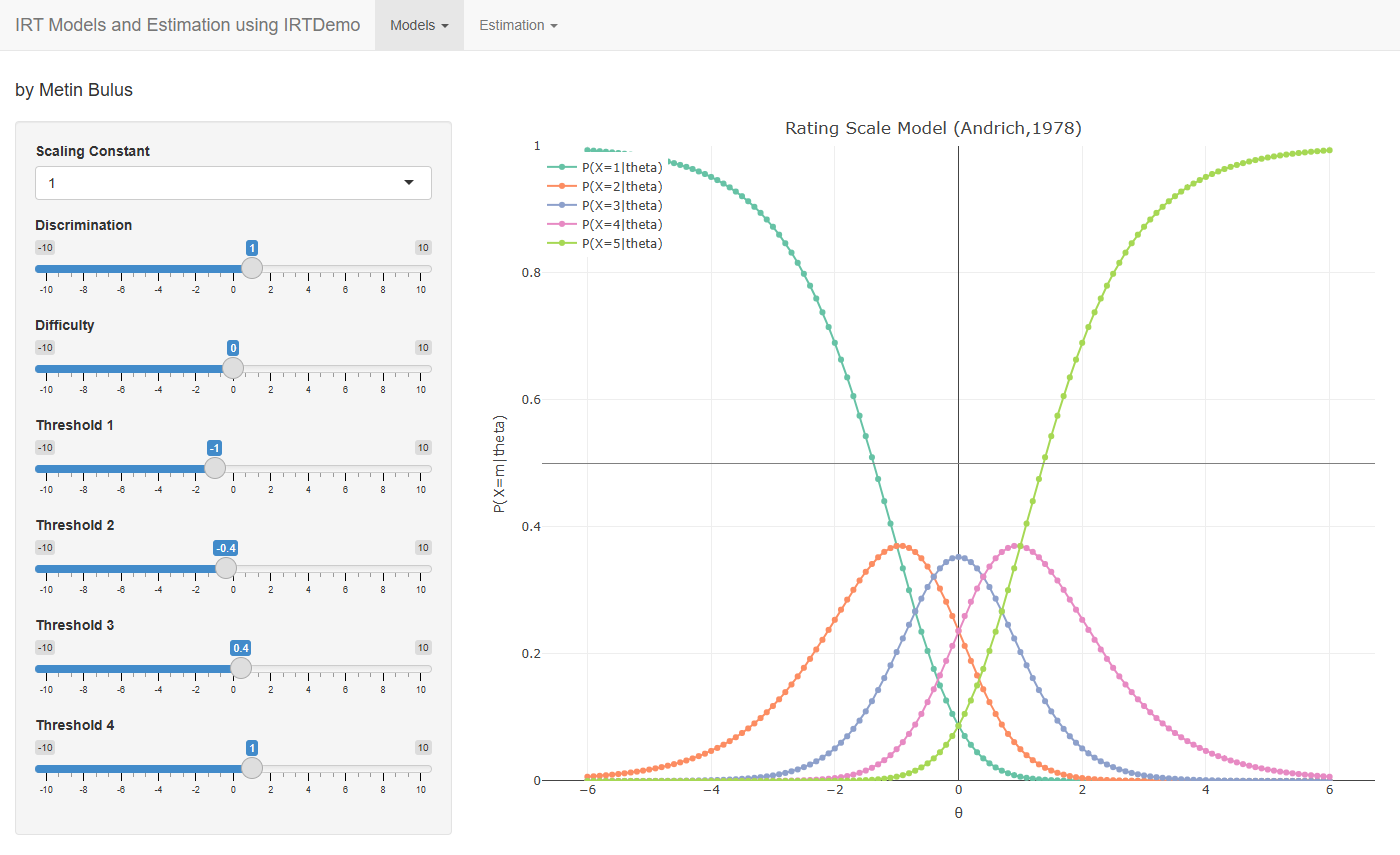
- RSM-GRSM: category response curves of the rating scale and generalized rating scale models
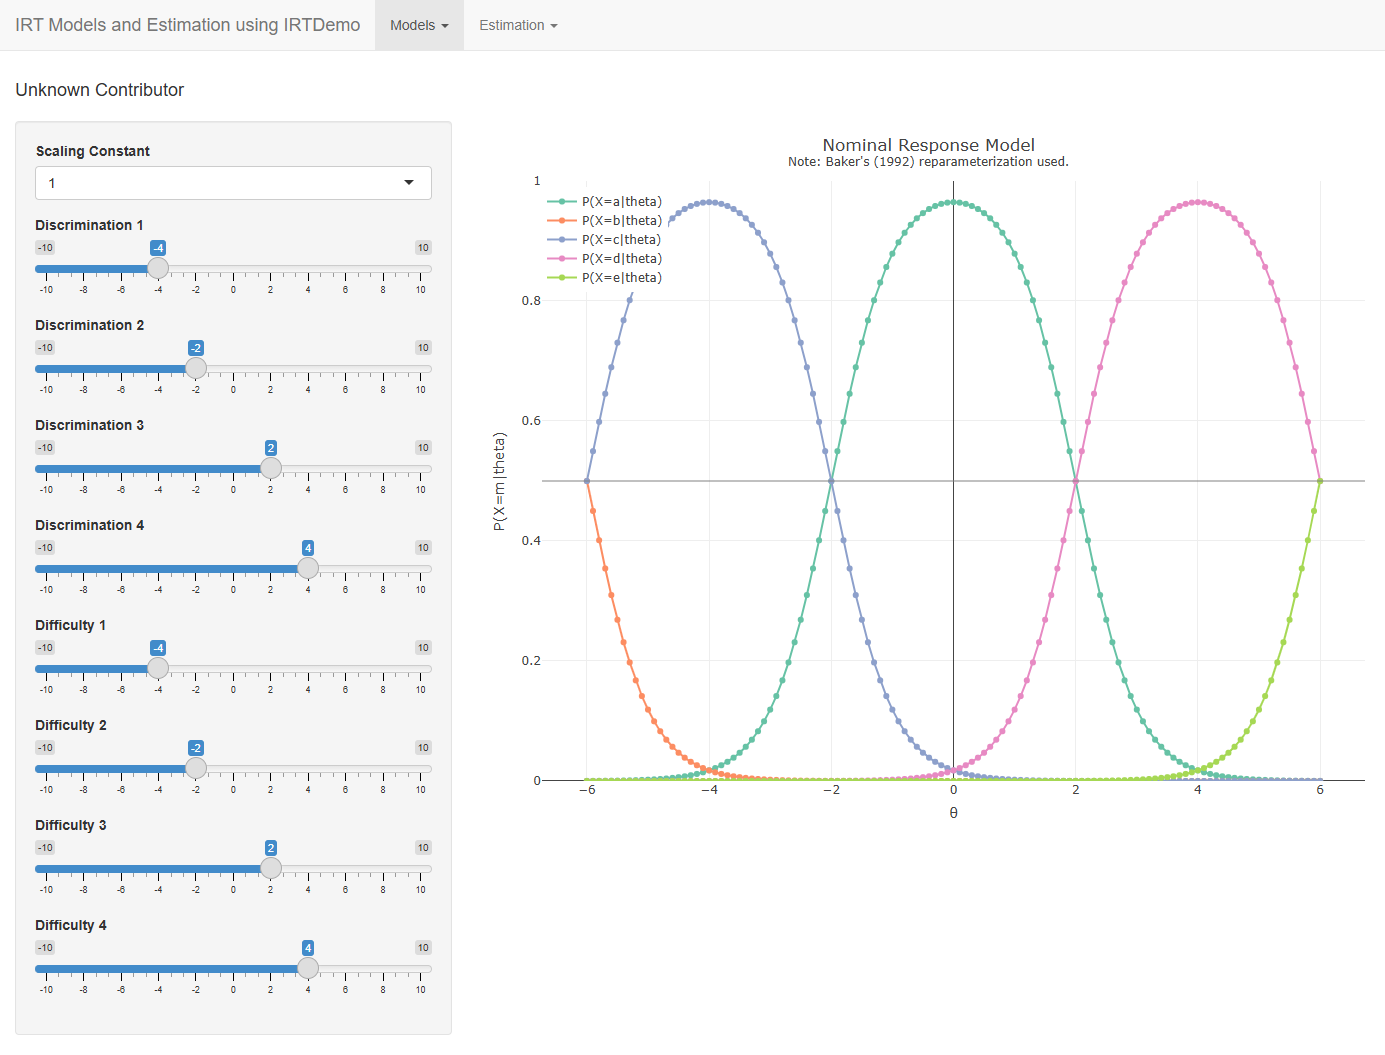
- NRM: category response curves of the nominal response model, for unordered categories
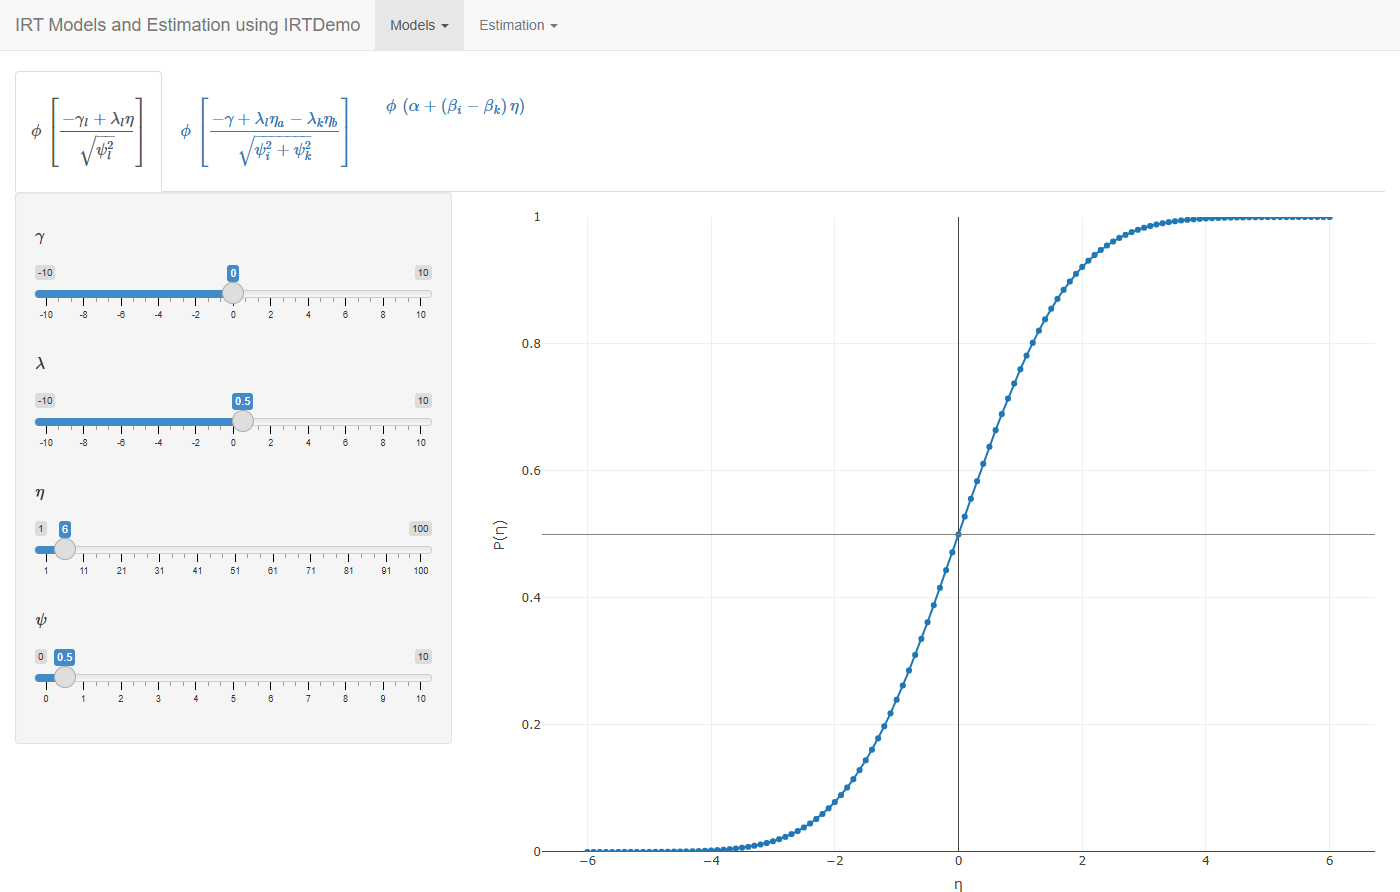
- TIRT: probit response functions of Thurstonian IRT, for forced-choice items and comparative judgments
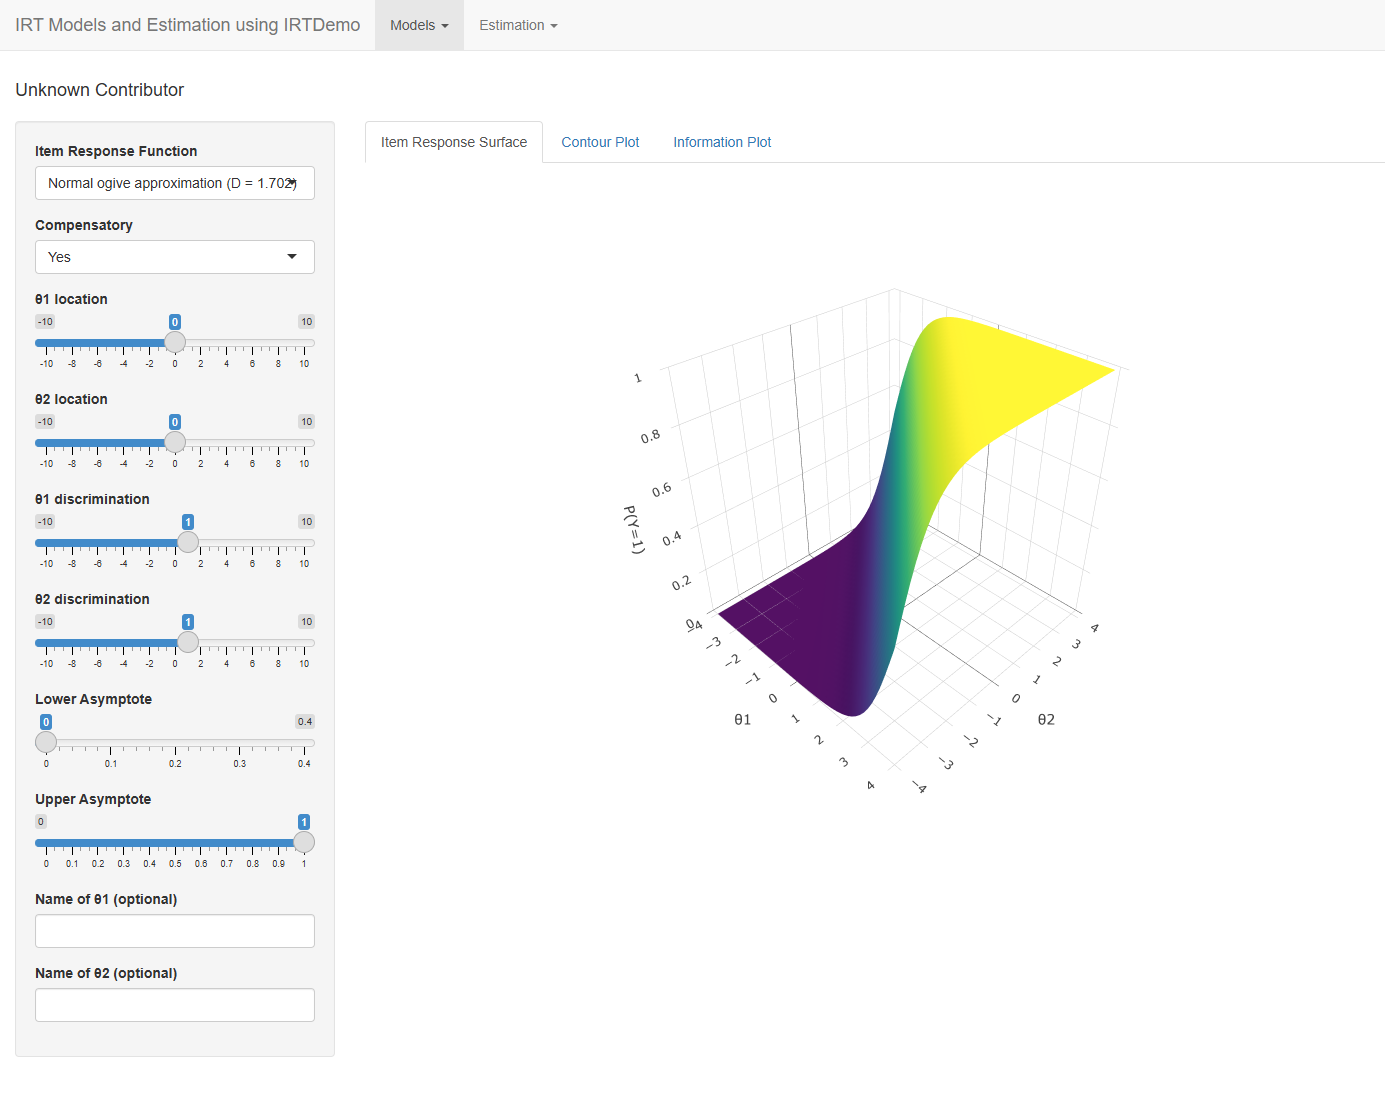
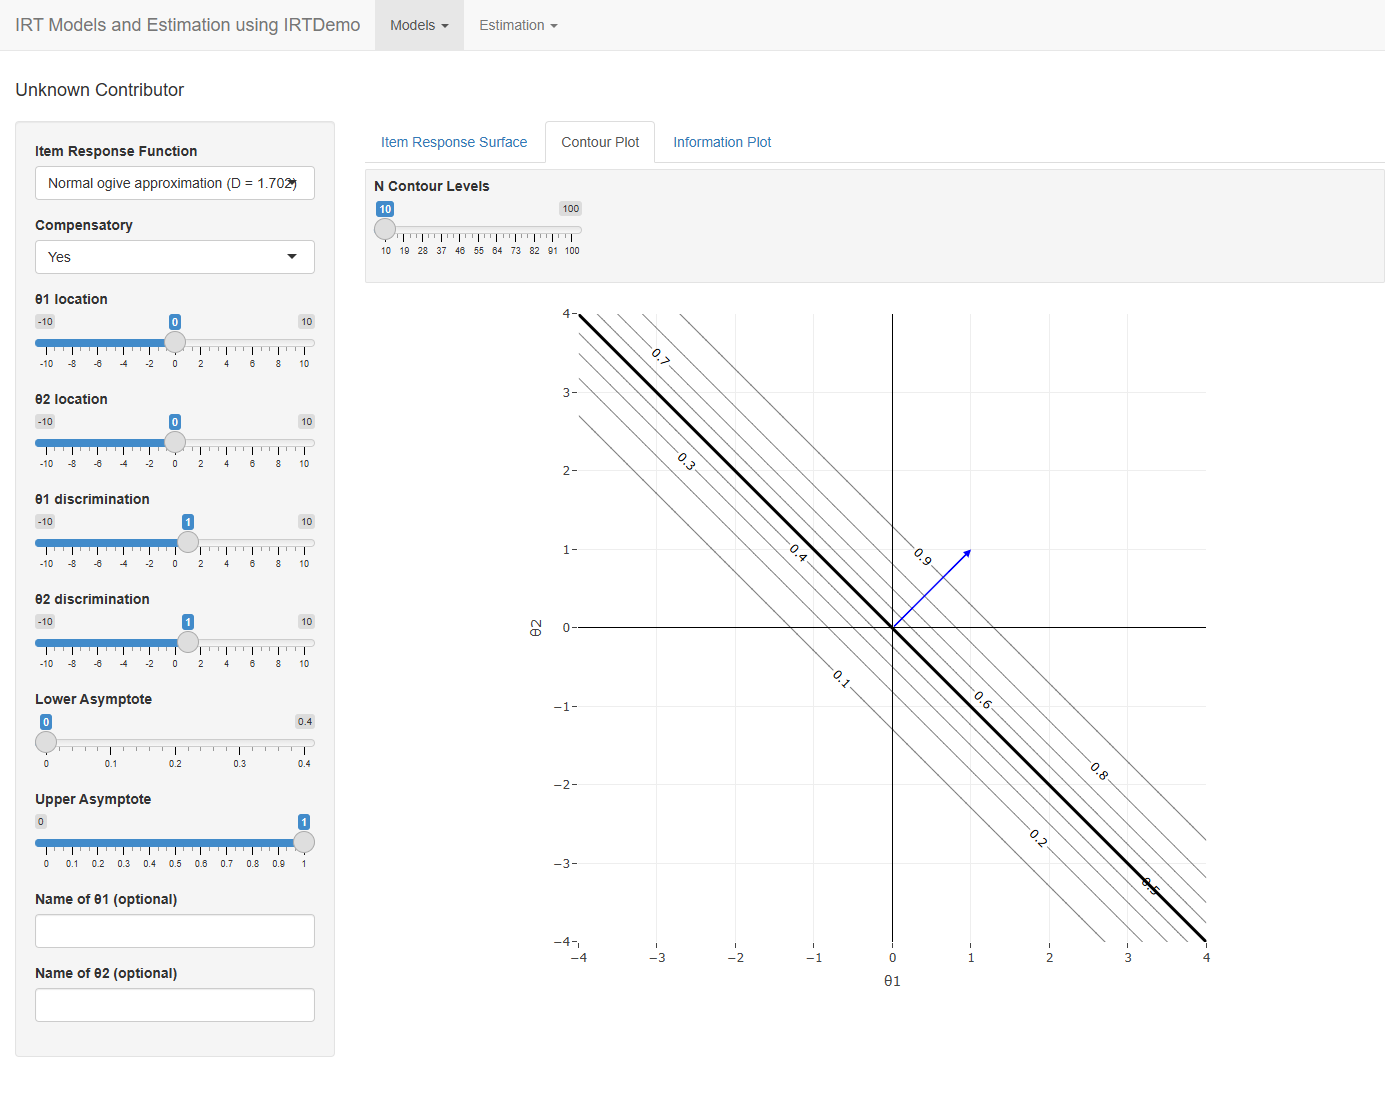
- MIRT Dichotomous: the response surface, contour plot (with the item vector) and information surface of an item that measures two abilities, compensatory or non-compensatory
Estimation menu
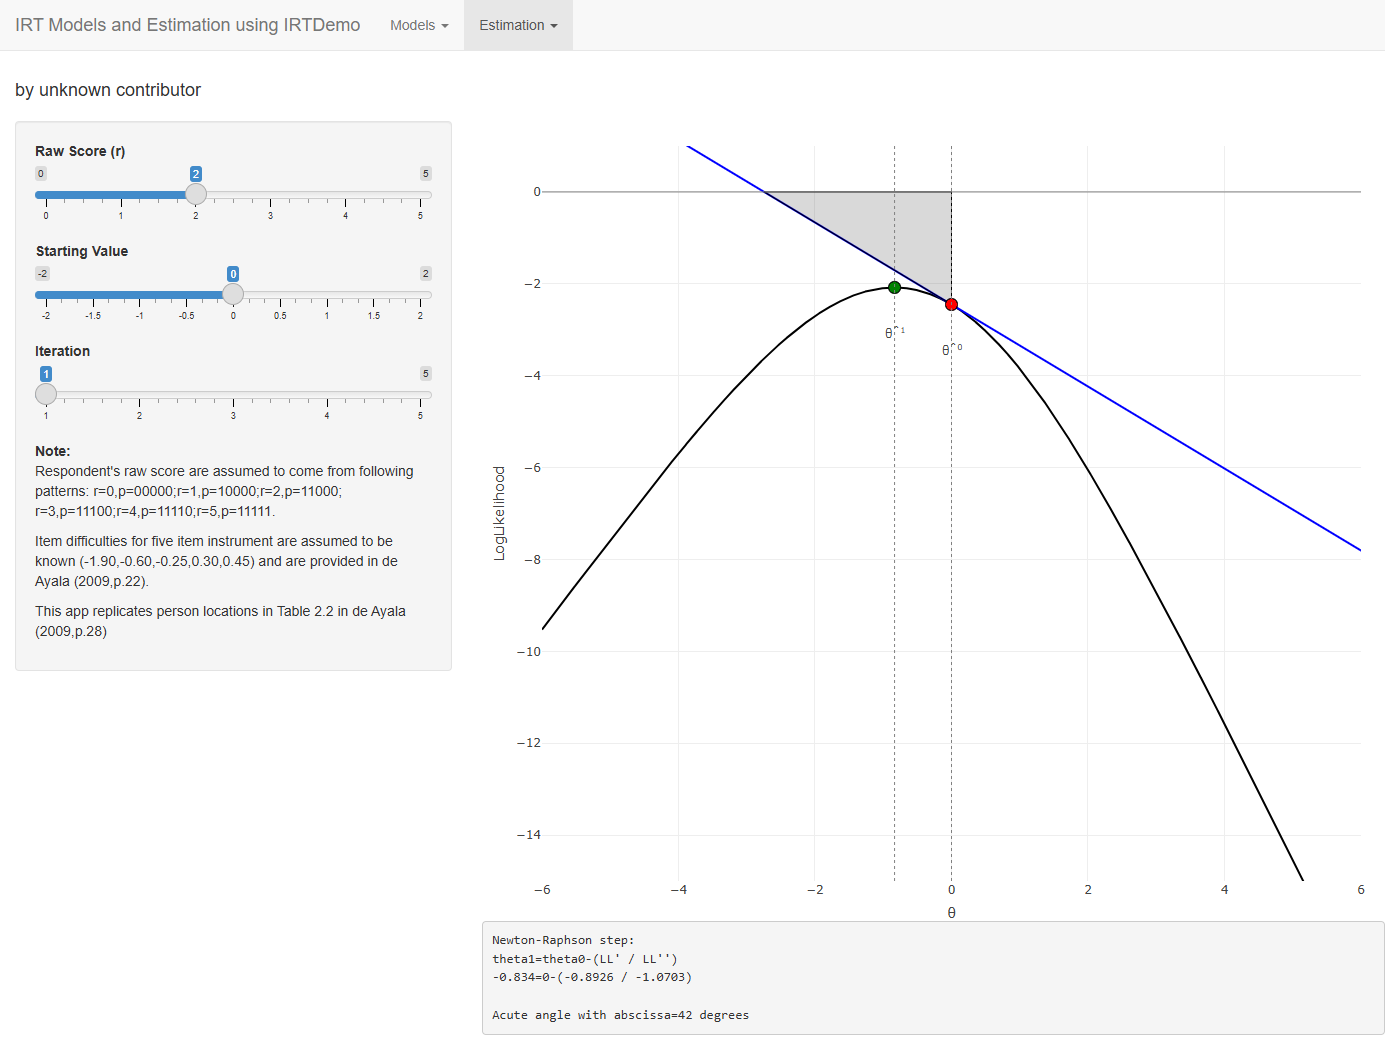
- MLE Rasch: the Newton-Raphson method finding a person’s maximum likelihood ability, step by step
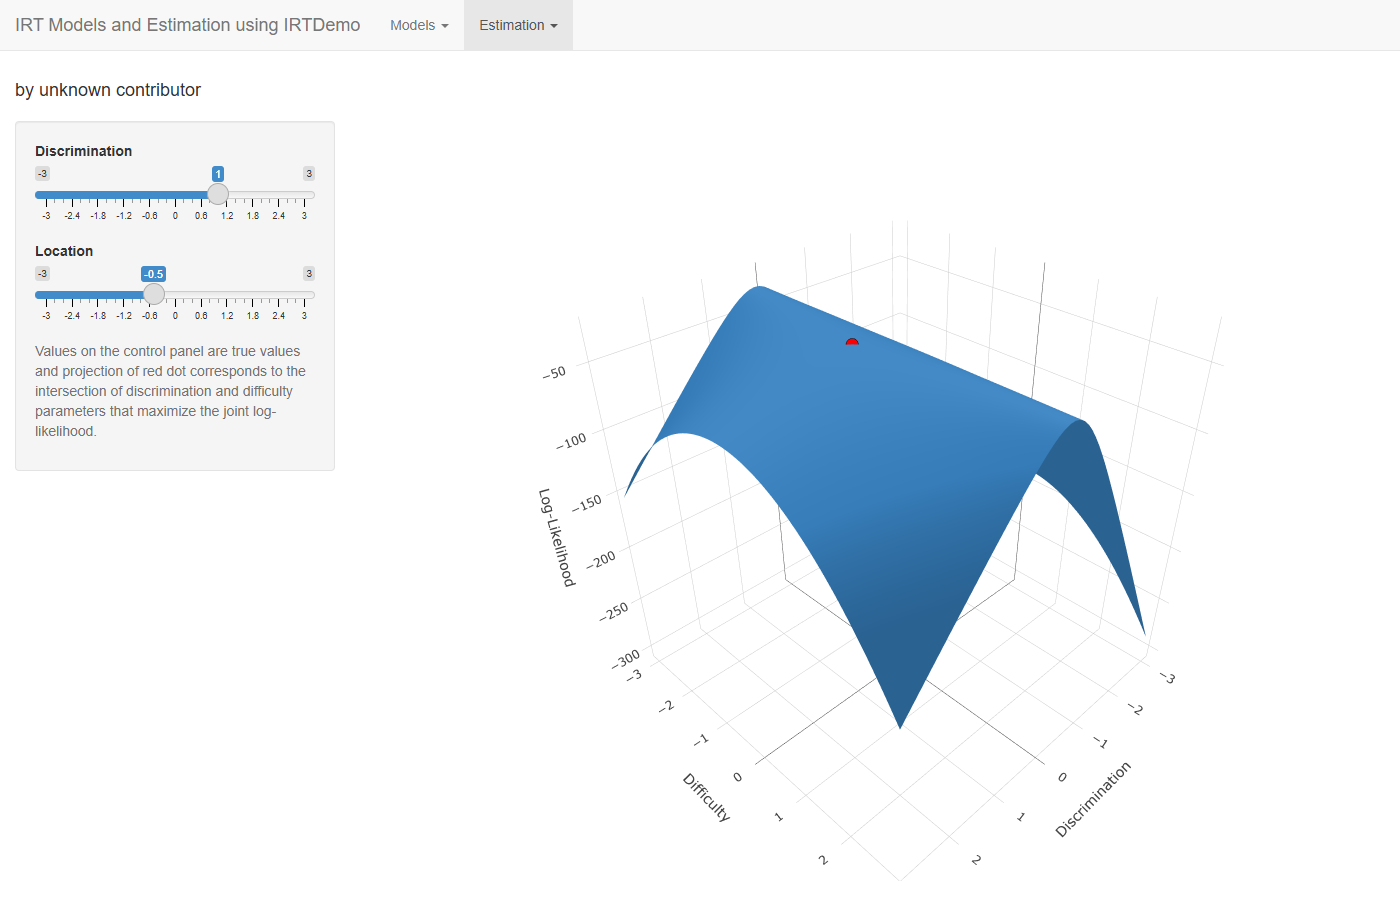
- MLE 2PL: the log-likelihood surface of an item’s discrimination and difficulty, from simulated responses, with its maximum
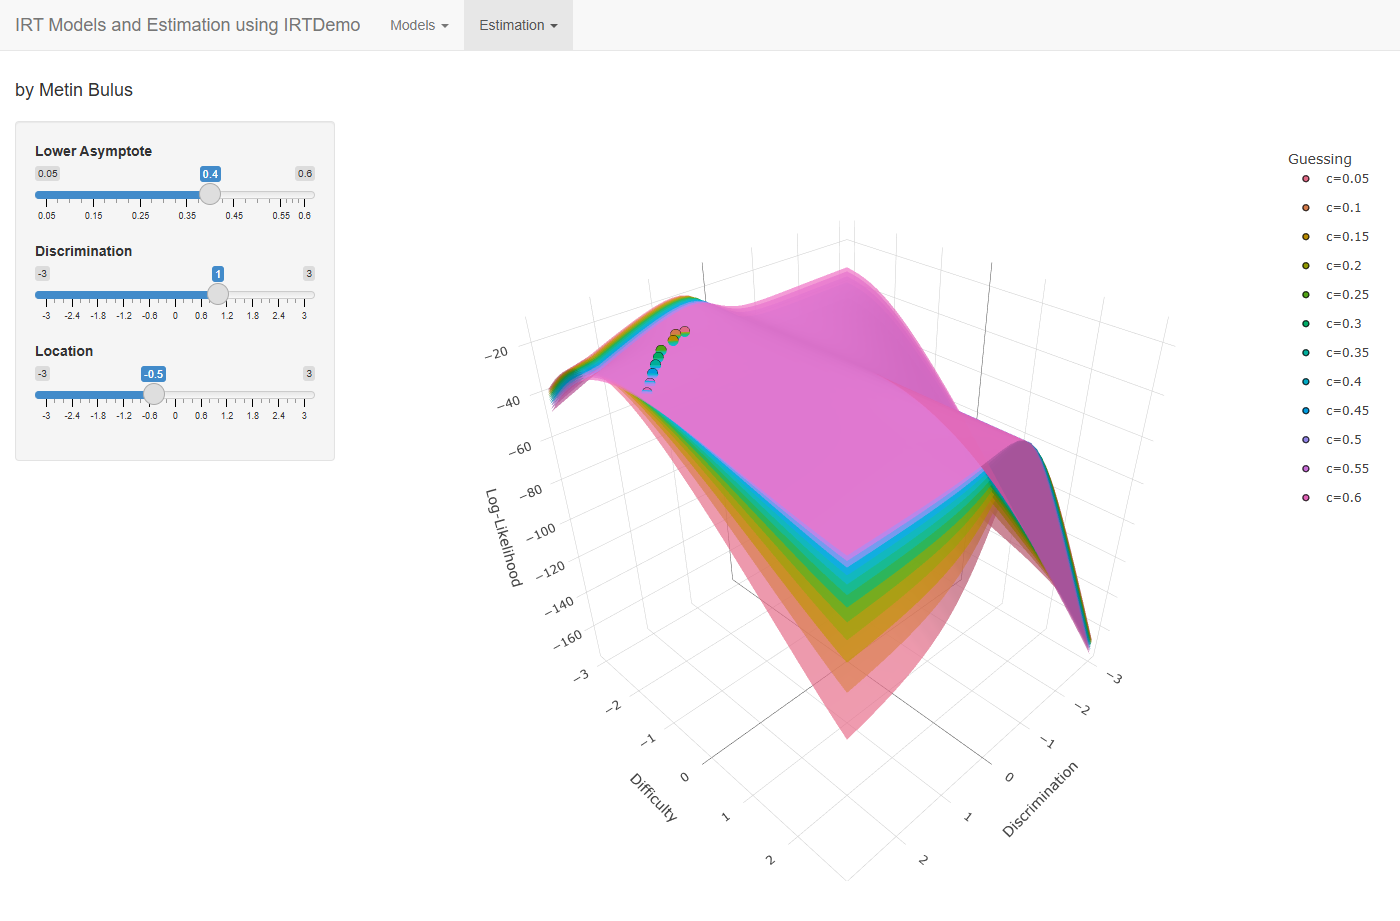
- MLE 3PL: the same surfaces for twelve assumed guessing values, to show how guessing affects the estimation
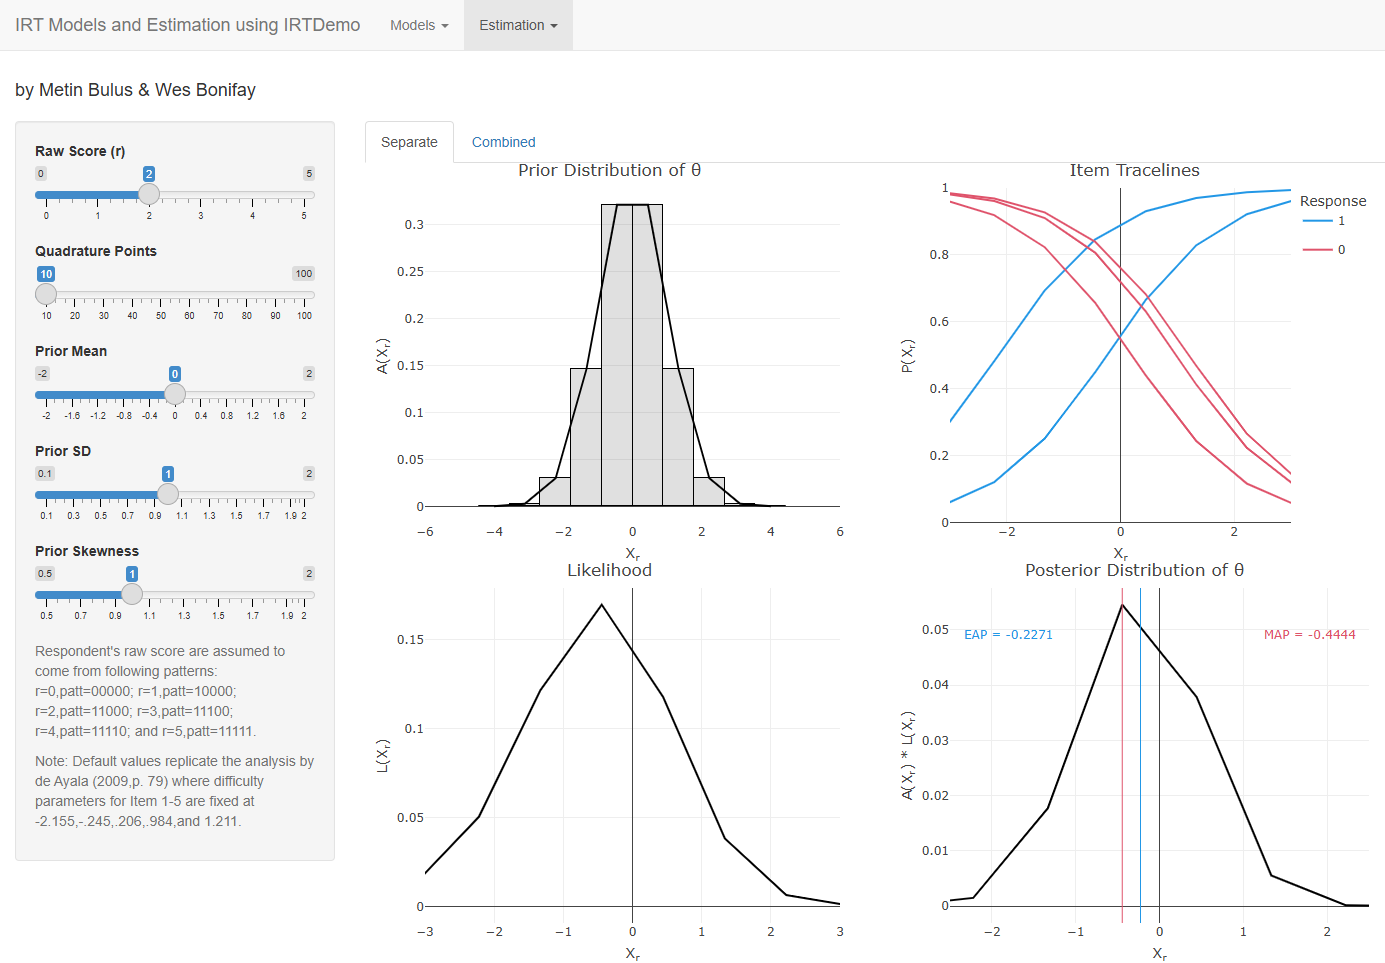
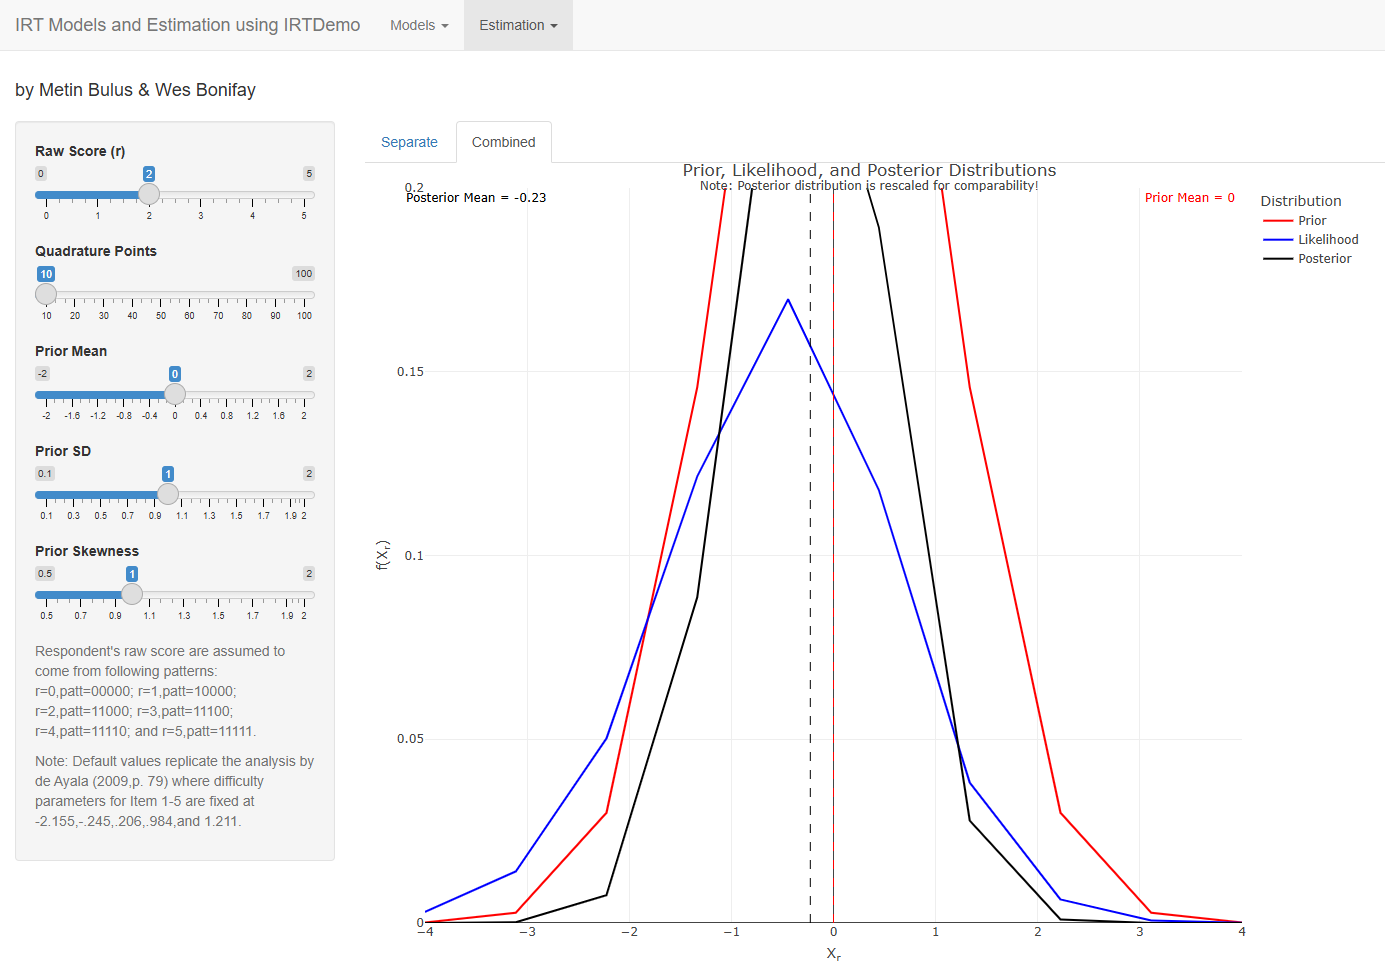
- EAP-MAP Rasch: Bayesian estimation of ability by quadrature, with the prior, item trace lines, likelihood and posterior
Key Capabilities
- Interactive Parameter Adjustment: sliders for every item parameter, with the plots redrawn immediately
- Interactive Plots: hover for the values, zoom and pan, rotate the 3-D surfaces, and click a legend entry to hide or show a curve
- Textbook Examples: the default settings of the Estimation tabs reproduce the results of de Ayala (2009)
- Functions in R: every model, estimation method and plot of the app is also an R function
Installation
Prerequisites
- Install R (version 4.1 or higher): https://cran.r-project.org/
- Install RStudio (optional but recommended): https://posit.co/downloads/
Package Installation
Open RStudio (or an R console) and run:
# Install devtools if you haven't already
install.packages("devtools")
# Install golemirt from GitHub
devtools::install_github("sedzinfo/golemirt")
The dependencies (shiny, golem, plotly, config and fGarch) are installed automatically.
Usage
Launch the app with two lines of code:
The app opens in your default web browser. Any shiny::shinyApp() option can be passed on, for example run_app(options = list(port = 8080)).
Using the Functions in R
The models, estimation methods and plots of the app are also available as functions, for scripts, R Markdown reports and teaching material:
library(golemirt)

# category response curves of a polytomous item
theta <- seq(-6, 6, by = 0.1)
plot_category_curves(theta, prob_gpcm(theta, a = 1.5), "Generalized Partial Credit Model")
plot_category_curves(theta, prob_grm(theta, b = c(-1.5, 0, 1.5)), "Graded Response Model")

# an item that measures mostly the first of two abilities
grid <- seq(-4, 4, length.out = 50)
a <- c(2, 0.5)
plot_mirt_contour(grid, grid, prob_mirt(grid, grid, a = a), level = 0.5, arrow = item_vector(a))

# Newton-Raphson steps towards the maximum likelihood estimate of ability
nr <- newton_raphson_rasch(response_pattern(2), iterations = 5)
nr$steps[, c("start", "end")]
plot_newton_raphson(nr)

# EAP and MAP estimates with 40 quadrature points
estimate <- eap_map(response_pattern(2), quadrature = 40)
c(EAP = estimate$eap, MAP = estimate$map)
plot_eap_combined(estimate)
The help page of run_app() describes every tab, with the formulas of the models and what each control and plot shows.
Development
The package follows the layout of a golem app:
| File | Contents |
|---|---|
R/run_app.R |
run_app(), which starts the app, with the help page that describes every tab |
R/app_ui.R, R/app_server.R
|
The navigation bar with the two menus, and the server, which starts the modules |
R/mod_*.R |
One Shiny module per tab |
R/fct_models.R |
The response functions of the models |
R/fct_estimation.R |
Log-likelihoods, Newton-Raphson steps, and EAP and MAP estimation |
R/fct_plots.R |
The plotly charts |
R/utils_helpers.R |
Small helpers shared by the modules and charts |
R/app_config.R, inst/golem-config.yml
|
The golem configuration |
inst/app/www/ |
The favicon |
tests/testthat/ |
Tests of the functions, the modules and the page |
Run the tests with devtools::test(), and the full package check with devtools::check(). generate_package.R documents, tests and installs the package, and builds the website, the PDF manual and the tarball.
Deploying to shinyapps.io
app.R starts the app on shinyapps.io, and .rscignore keeps the upload to the files the app needs.
- Connect your account once, with the
rsconnect::setAccountInfo()line from Account, Tokens on shinyapps.io. - Run
rsconnect::deployApp(appName = "golemirt")from the package folder, or openapp.Rin RStudio and click Publish.
Background and Attribution
The plots were originally developed by Wes Bonifay and Metin Bulus for the irtDemo package, which is available on CRAN. Dimitrios Zacharatos modified and expanded them in the modelsirt and mleirt packages, which golemirt brings together as one golem app:
- consolidating the IRT models and estimation methods into a single interface
- rebuilding the visualisations with Plotly for interactivity
- adding further IRT models
- improving the user interface
Special thanks to Kostas Maistrelis for contributing the implementation of the Thurstonian IRT curves. Each tab keeps the credit shown in the original apps.
Original Authors: Wes Bonifay and Metin Bulus
Current Maintainer: Dimitrios Zacharatos
Original CRAN Package: irtDemo
References
- Andrich, D. (1978). A rating formulation for ordered response categories. Psychometrika, 43(4), 561-573.
- Baker, F. B. (1992). Item Response Theory: Parameter Estimation Techniques. Marcel Dekker.
- Bulus, M., & Bonifay, W. (2022). irtDemo R Package: Pedagogical Interactive Web Applications for Estimation, Scoring, and Multi Dimensionality in Item Response Theory. Anadolu University Journal of Education Faculty, 6(1), 92-108. https://doi.org/10.34056/aujef.913781
- de Ayala, R. J. (2009). The Theory and Practice of Item Response Theory. Guilford Press.
- Magis, D. (2013). A note on the item information function of the four-parameter logistic model. Applied Psychological Measurement, 37(4), 304-315.
- Masters, G. N. (1982). A Rasch model for partial credit scoring. Psychometrika, 47(2), 149-174.
- Muraki, E. (1990). Fitting a polytomous item response model to Likert-type data. Applied Psychological Measurement, 14(1), 59-71.
- Muraki, E. (1992). A generalized partial credit model: Application of an EM algorithm. Applied Psychological Measurement, 16(2), 159-176.
License
GPL-3. See the LICENSE file for details.
Contributing
Contributions, issues, and feature requests are welcome! Feel free to check the issues page.








