| Label | Dimension | Reverse-scored | Item wording |
|---|---|---|---|
| E1 | Extraversion | FALSE | Am the life of the party. |
| E2R | Extraversion | TRUE | Don’t talk a lot. |
| E3 | Extraversion | FALSE | Feel comfortable around people. |
| E4R | Extraversion | TRUE | Keep in the background. |
| E5 | Extraversion | FALSE | Start conversations. |
| E6R | Extraversion | TRUE | Have little to say. |
| E7 | Extraversion | FALSE | Talk to a lot of different people at parties. |
| E8R | Extraversion | TRUE | Don’t like to draw attention to myself. |
| E9 | Extraversion | FALSE | Don’t mind being the center of attention. |
| E10R | Extraversion | TRUE | Am quiet around strangers. |
| N1 | Neuroticism | FALSE | Get stressed out easily. |
| N2R | Neuroticism | TRUE | Am relaxed most of the time. |
| N3 | Neuroticism | FALSE | Worry about things. |
| N4R | Neuroticism | TRUE | Seldom feel blue. |
| N5 | Neuroticism | FALSE | Am easily disturbed. |
| N6 | Neuroticism | FALSE | Get upset easily. |
| N7 | Neuroticism | FALSE | Change my mood a lot. |
| N8 | Neuroticism | FALSE | Have frequent mood swings. |
| N9 | Neuroticism | FALSE | Get irritated easily. |
| N10 | Neuroticism | FALSE | Often feel blue. |
| A1R | Agreeableness | TRUE | Feel little concern for others. |
| A2 | Agreeableness | FALSE | Am interested in people. |
| A3R | Agreeableness | TRUE | Insult people. |
| A4 | Agreeableness | FALSE | Sympathize with others’ feelings. |
| A5R | Agreeableness | TRUE | Am not interested in other people’s problems. |
| A6 | Agreeableness | FALSE | Have a soft heart. |
| A7R | Agreeableness | TRUE | Am not really interested in others. |
| A8 | Agreeableness | FALSE | Take time out for others. |
| A9 | Agreeableness | FALSE | Feel others’ emotions. |
| A10 | Agreeableness | FALSE | Make people feel at ease. |
| C1 | Conscientiousness | FALSE | Am always prepared. |
| C2R | Conscientiousness | TRUE | Leave my belongings around. |
| C3 | Conscientiousness | FALSE | Pay attention to details. |
| C4R | Conscientiousness | TRUE | Make a mess of things. |
| C5 | Conscientiousness | FALSE | Get chores done right away. |
| C6R | Conscientiousness | TRUE | Often forget to put things back in their proper place. |
| C7 | Conscientiousness | FALSE | Like order. |
| C8R | Conscientiousness | TRUE | Shirk my duties. |
| C9 | Conscientiousness | FALSE | Follow a schedule. |
| C10 | Conscientiousness | FALSE | Am exacting in my work. |
| O1 | Openness | FALSE | Have a rich vocabulary. |
| O2R | Openness | TRUE | Have difficulty understanding abstract ideas. |
| O3 | Openness | FALSE | Have a vivid imagination. |
| O4R | Openness | TRUE | Am not interested in abstract ideas. |
| O5 | Openness | FALSE | Have excellent ideas. |
| O6R | Openness | TRUE | Do not have a good imagination. |
| O7 | Openness | FALSE | Am quick to understand things. |
| O8 | Openness | FALSE | Use difficult words. |
| O9 | Openness | FALSE | Spend time reflecting on things. |
| O10 | Openness | FALSE | Am full of ideas. |
IPIP-50 / OCEAN Validation
Description
The IPIP-50 (International Personality Item Pool; Goldberg, 1992, 1999) is a 50-item public-domain measure of the Big Five personality dimensions. Respondents rated each item on a 1–5 scale (Very Inaccurate to Very Accurate); 0 encodes missing data. The dataset contains responses from a large online sample.
Items are grouped into five dimensions: Extraversion, Neuroticism, Agreeableness, Conscientiousness, and Openness to Experience. Items marked R are reverse-keyed and are recoded (5 − x) before analysis.
Goldberg, L. R. (1992). The development of markers for the Big-Five factor structure. Psychological Assessment, 4(1), 26–42.
Goldberg, L. R. (1999). A broad-bandwidth, public domain, personality inventory measuring the lower-level facets of several Five-Factor models. In I. Mervielde, I. Deary, F. De Fruyt, & F. Ostendorf (Eds.), Personality Psychology in Europe (Vol. 7, pp. 7–28). Tilburg University Press.
Item List
Inter-Item Correlation Matrix
Code
cor_mat  <- cor(df[, factor_order], use="pairwise.complete.obs")
cor_long <- melt(cor_mat)
cor_long$Var1 <- factor(cor_long$Var1, levels=factor_order)
cor_long$Var2 <- factor(cor_long$Var2, levels=factor_order)

ggplot(cor_long, aes(x=Var1, y=Var2, fill=value)) +
  geom_tile(color="white", linewidth=0.2) +
  scale_fill_gradient2(low="#2166ac", mid="white", high="#d6604d",
                       midpoint=0, limits=c(-1,1), name="r") +
  theme_bw(base_size=9) +
  theme(axis.text.x=element_text(angle=90, hjust=1, size=7),
        axis.text.y=element_text(size=7),
        axis.title=element_blank(),
        panel.grid=element_blank()) +
  ggtitle("IPIP-50 inter-item correlation matrix\nItems ordered by dimension; R = reverse-scored (already recoded)")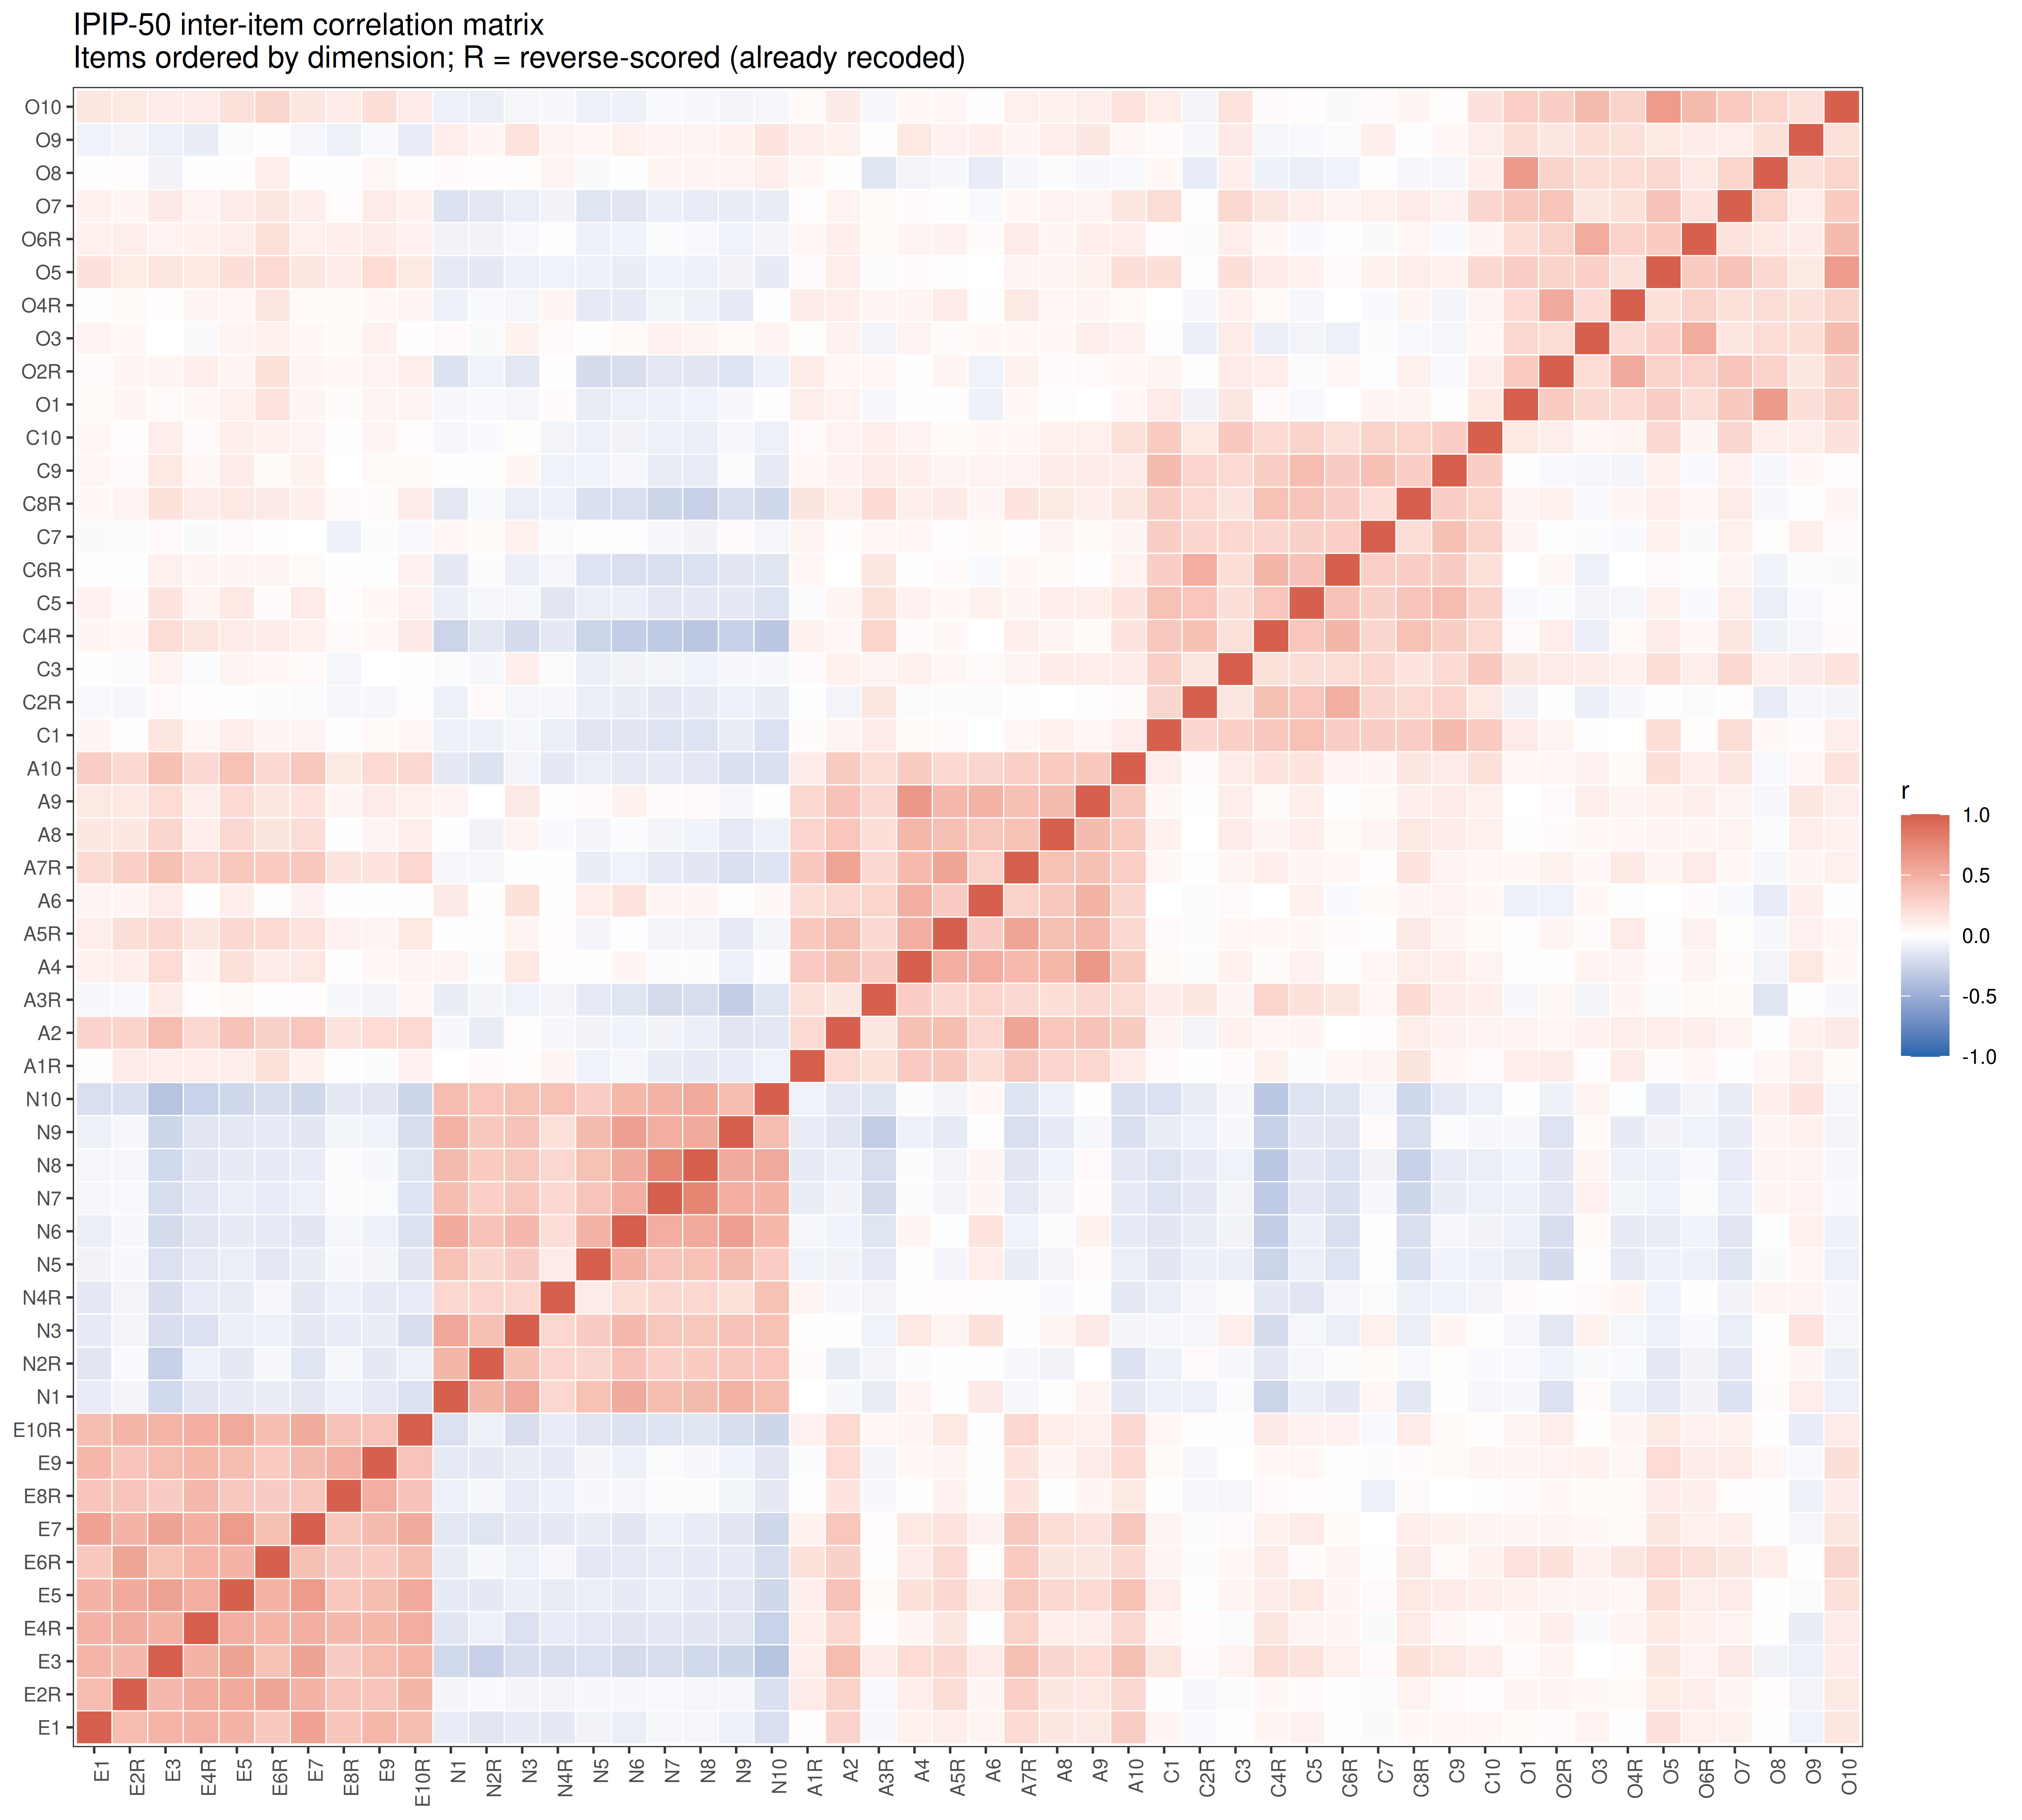
Subscale Correlations
Code
subscale_scores <- as.data.frame(sapply(names(factors), function(f) {
  rowMeans(df[, factors[[f]]], na.rm=TRUE)
}))

cat("Subscale descriptives\n")
Subscale descriptivesCode
print(psych::describe(subscale_scores)) vars n mean sd median trimmed mad min max range skew kurtosis se
Extraversion 1 19719 2.51 0.92 2.5 2.52 1.04 0.5 4.5 4 -0.04 -0.71 0.01
Neuroticism 2 19719 2.90 0.86 2.9 2.91 0.89 0.8 4.8 4 -0.08 -0.60 0.01
Agreeableness 3 19719 3.44 0.71 3.5 3.50 0.74 0.6 4.6 4 -0.76 0.53 0.01
Conscientiousness 4 19719 2.95 0.73 3.0 2.95 0.74 0.6 4.6 4 -0.09 -0.38 0.01
Openness 5 19719 3.61 0.63 3.7 3.64 0.59 0.7 4.7 4 -0.47 -0.03 0.00Code
cat("\nSubscale intercorrelations\n")
Subscale intercorrelationsCode
sub_cor <- round(cor(subscale_scores, use="pairwise.complete.obs"), 2)
print(sub_cor)
Extraversion Neuroticism Agreeableness Conscientiousness Openness
Extraversion 1.00 -0.26 0.33 0.11 0.17
Neuroticism -0.26 1.00 -0.11 -0.26 -0.10
Agreeableness 0.33 -0.11 1.00 0.18 0.12
Conscientiousness 0.11 -0.26 0.18 1.00 0.09
Openness 0.17 -0.10 0.12 0.09 1.00Code
sub_long <- melt(sub_cor)
ggplot(sub_long, aes(x=Var1, y=Var2, fill=value)) +
  geom_tile(color="white", linewidth=0.5) +
  geom_text(aes(label=value), size=3.5) +
  scale_fill_gradient2(low="#2166ac", mid="white", high="#d6604d",
                       midpoint=0, limits=c(-1,1), name="r") +
  theme_bw(base_size=10) +
  theme(axis.title=element_blank(), panel.grid=element_blank()) +
  ggtitle("IPIP-50 subscale intercorrelations")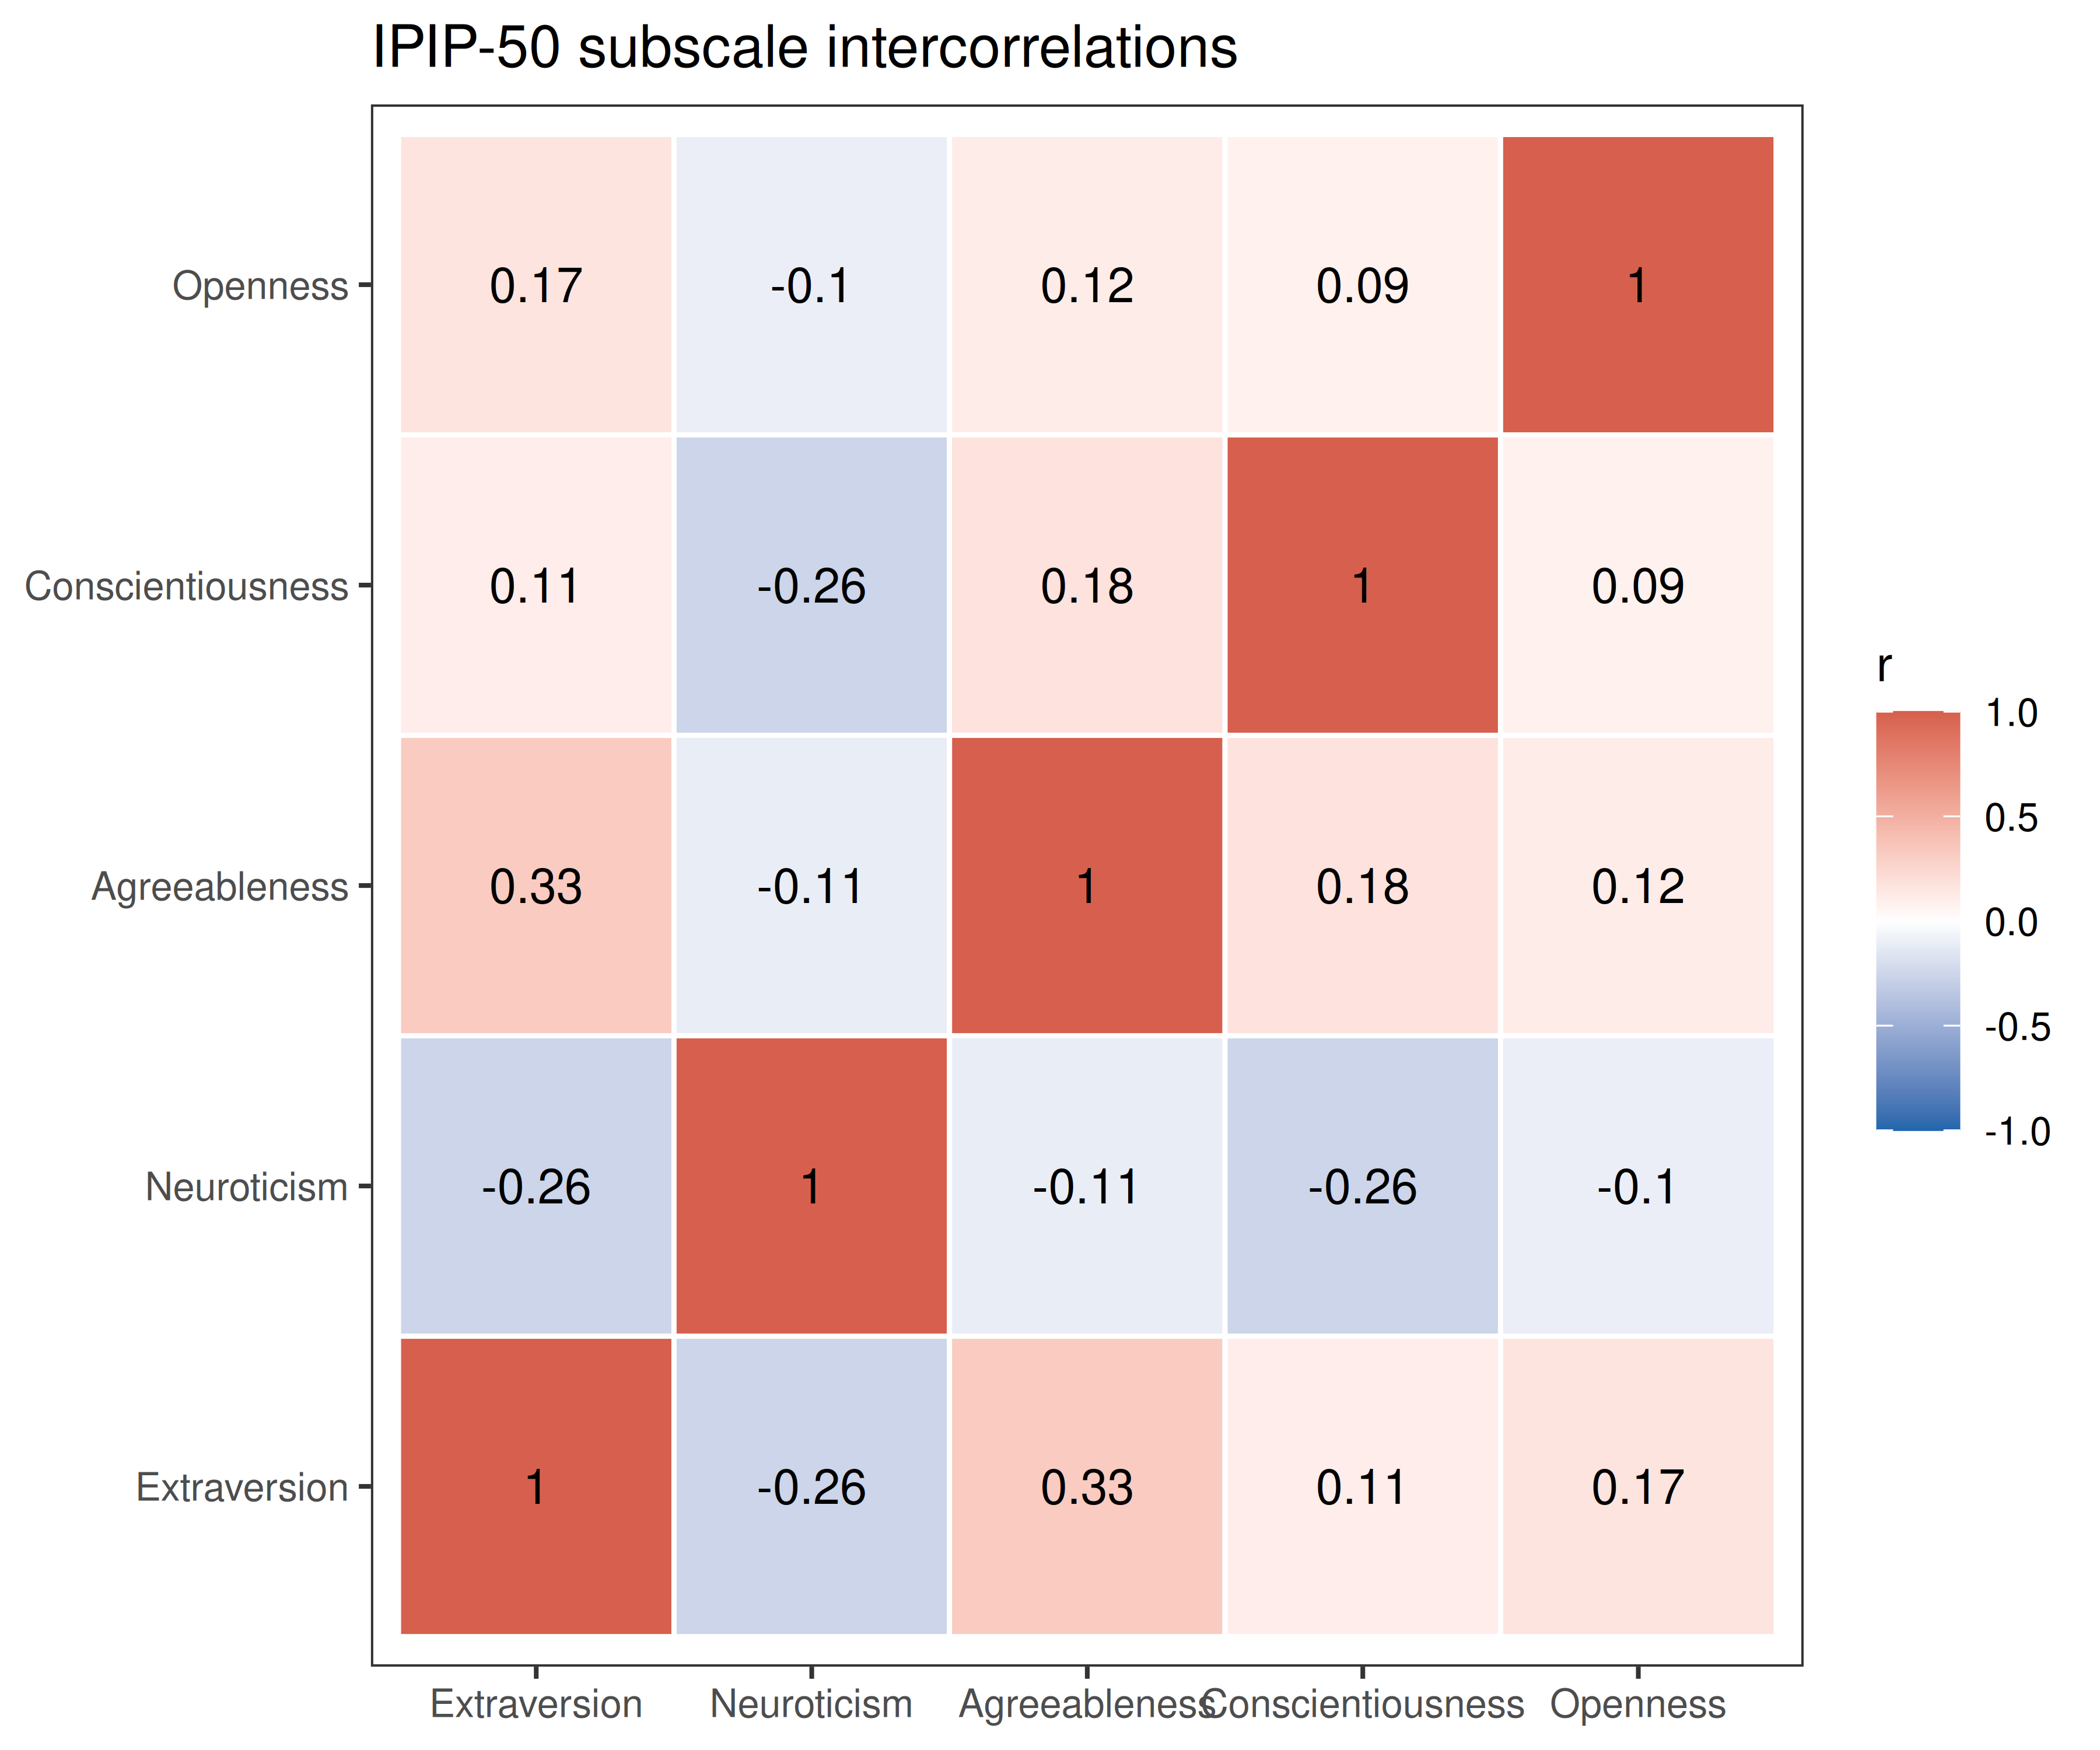
Exploratory Factor Analysis (5 Factors)
Code
set.seed(42)
efa <- fa(df, nfactors=5, rotate="oblimin", fm="ml", scores="regression")

print(efa$loadings, cutoff=0.30, sort=TRUE)
Loadings:
     ML3    ML4    ML1    ML2    ML5
E1    0.690
E2R   0.697
E3    0.640
E4R   0.717
E5    0.732
E6R   0.546
E7    0.749
E8R   0.582
E9    0.623
E10R  0.662
N1           0.671
N3           0.592
N5           0.537
N6           0.746
N7           0.734
N8           0.760
N9           0.732
N10          0.576
A4                  0.808
A5R                 0.651
A6                  0.615
A7R                 0.582
A8                  0.571
A9                  0.713
C1                         0.599
C2R                        0.543
C4R                        0.530
C5                         0.633
C6R                        0.586
C7                         0.555
C9                         0.641
O1                                0.583
O2R                               0.536
O3                                0.538
O5                                0.608
O6R                               0.501
O8                                0.552
O10                               0.680
N2R          0.496
N4R
A1R                 0.432
A2                  0.496
A3R                 0.404
A10                 0.335
C3                         0.395
C8R                        0.453
C10                        0.466
O4R                               0.461
O7                                0.493
O9                                0.347

                 ML3   ML4   ML1   ML2   ML5
SS loadings    4.911 4.411 3.600 3.172 3.164
Proportion Var 0.098 0.088 0.072 0.063 0.063
Cumulative Var 0.098 0.186 0.258 0.322 0.385
Code
loadings_mat           <- as.data.frame(unclass(efa$loadings))
colnames(loadings_mat) <- paste0("F", 1:5)
loadings_mat$item      <- rownames(loadings_mat)
loadings_mat$expected  <- item_labels[loadings_mat$item]

load_long      <- melt(loadings_mat, id.vars=c("item","expected"),
                       variable.name="factor", value.name="loading")
load_long$item <- factor(load_long$item, levels=factor_order)

ggplot(load_long, aes(x=factor, y=item, fill=loading)) +
  geom_tile(color="white", linewidth=0.3) +
  geom_text(aes(label=ifelse(abs(loading)>=0.30, round(loading,2), "")), size=2.5) +
  scale_fill_gradient2(low="#2166ac", mid="white", high="#d6604d",
                       midpoint=0, limits=c(-1,1), name="loading") +
  facet_grid(expected ~ ., scales="free_y", space="free_y") +
  theme_bw(base_size=9) +
  theme(strip.text.y=element_text(angle=0, size=8),
        axis.text.y=element_text(size=7),
        axis.title=element_blank(),
        panel.grid=element_blank()) +
  ggtitle("EFA factor loadings (oblimin rotation, 5 factors)\nValues >= |0.30| shown; R = reverse-scored item")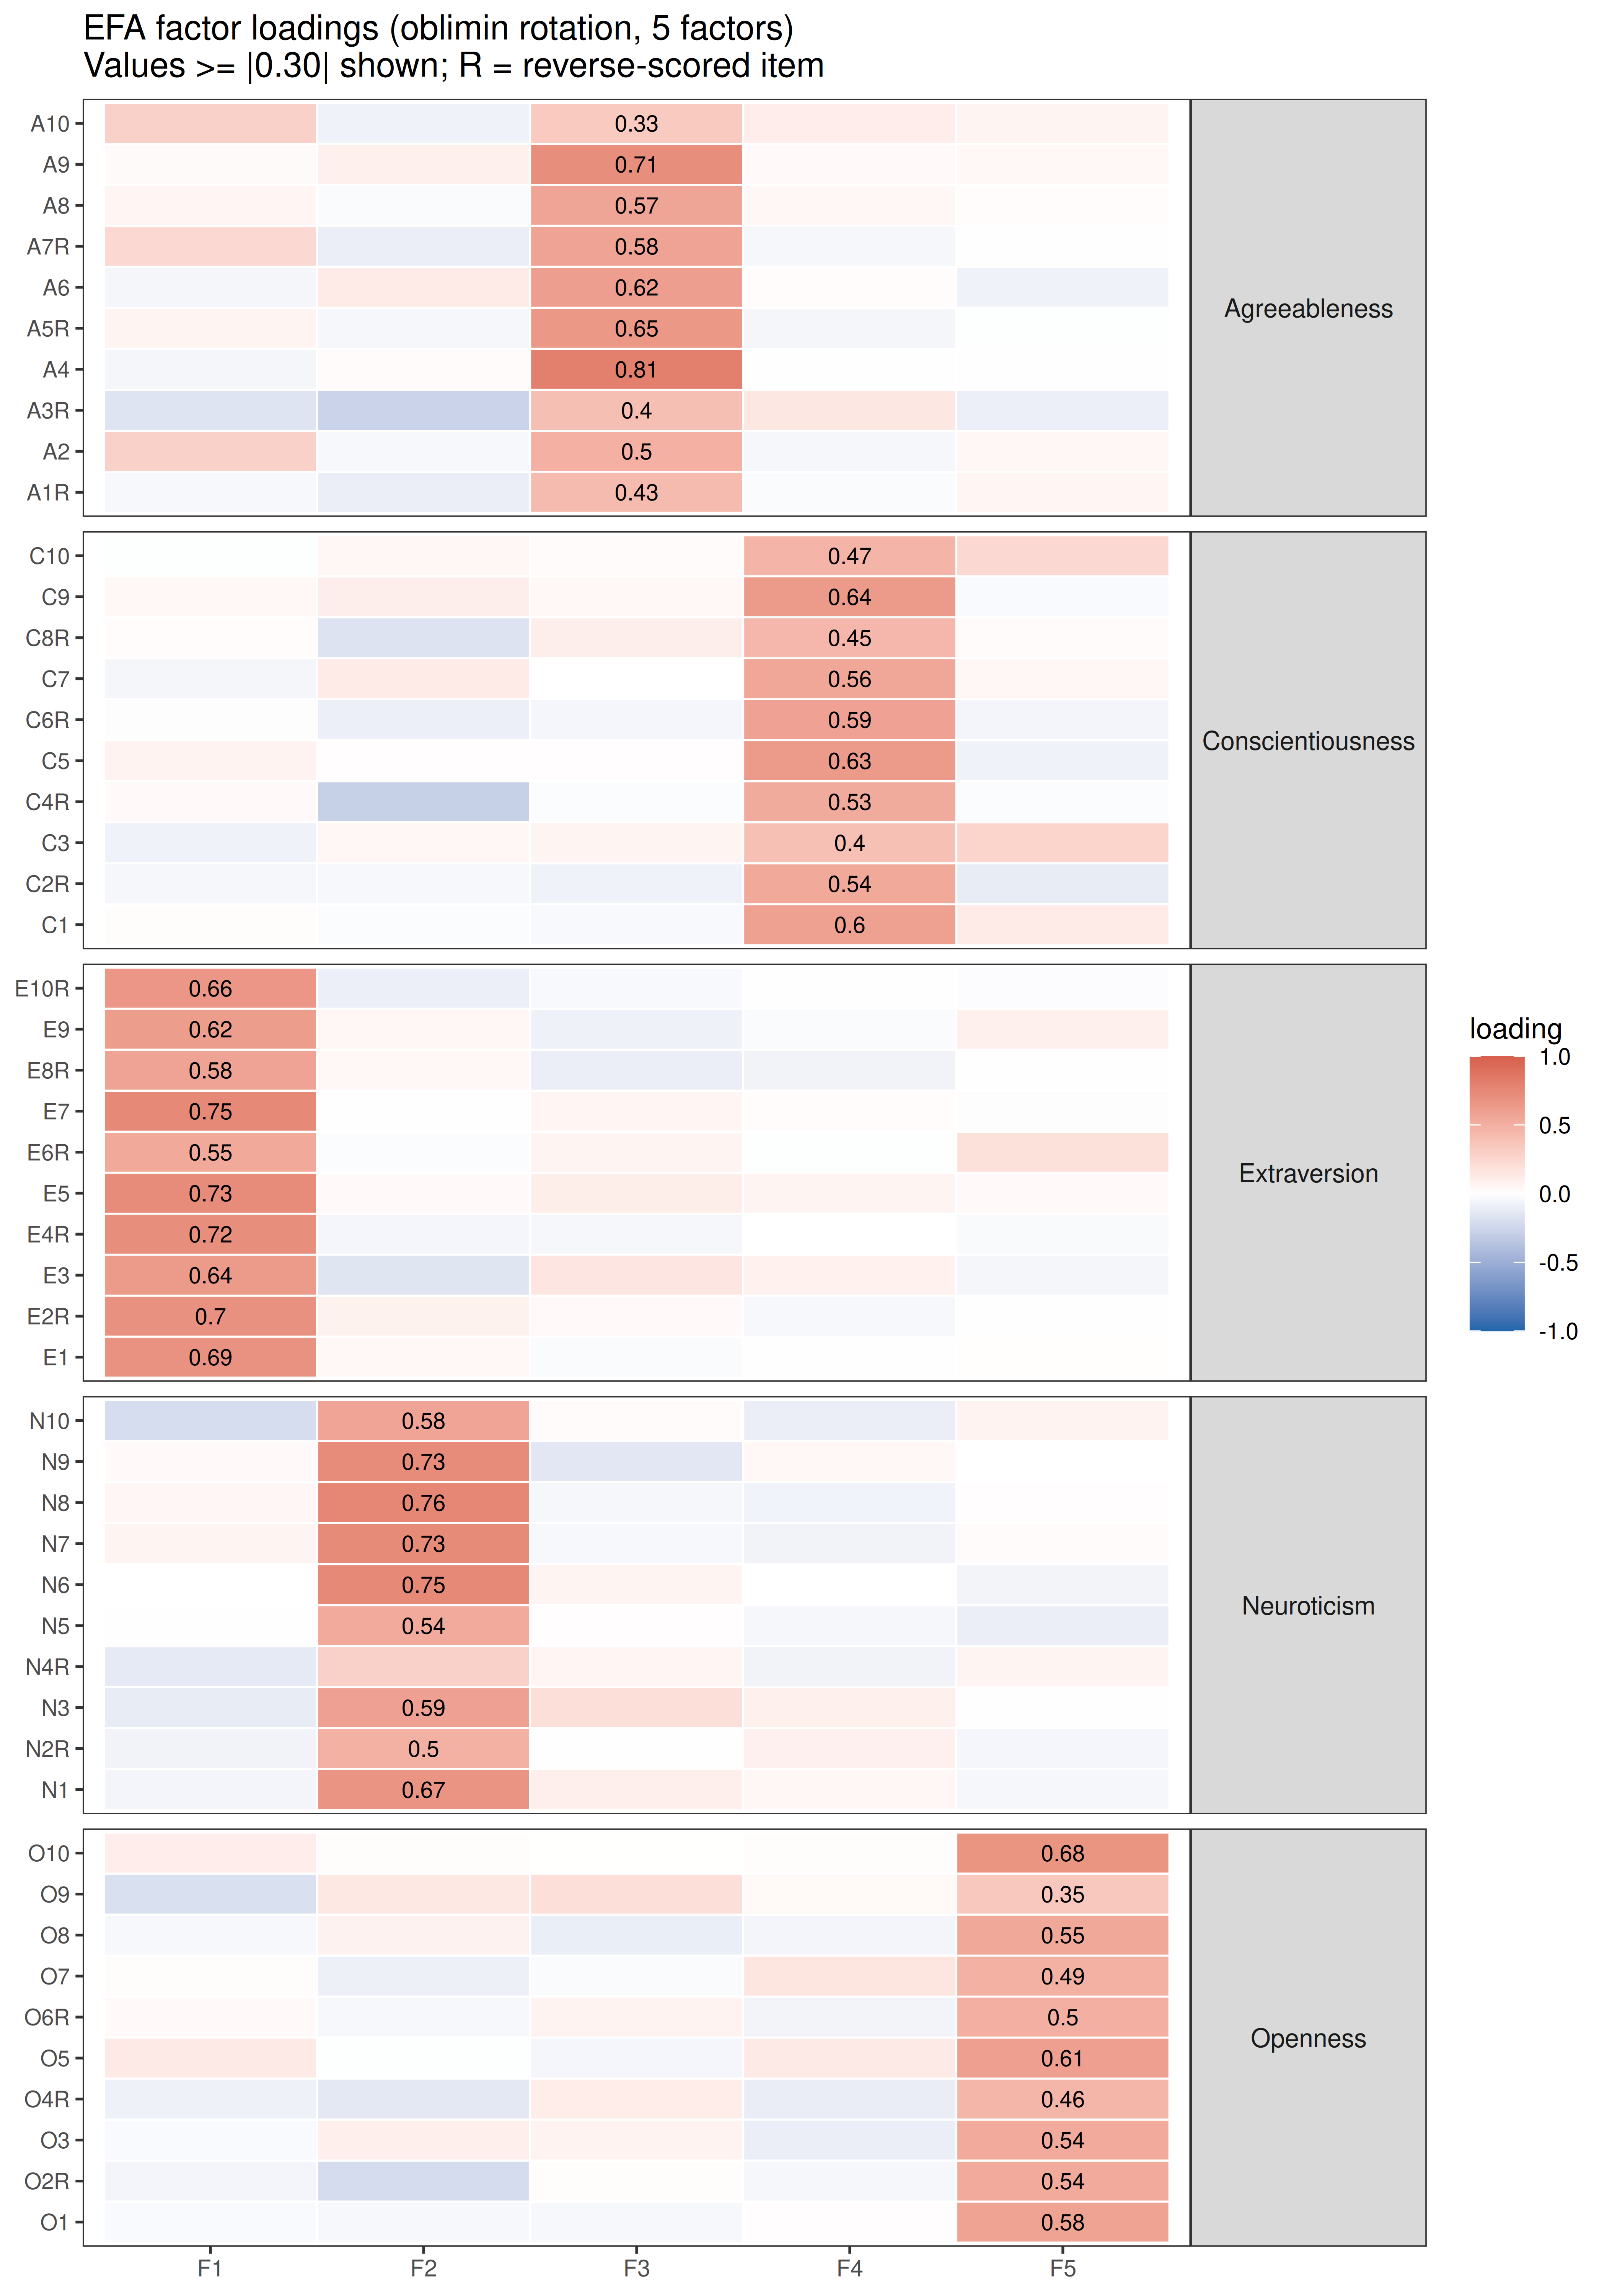
Parallel Analysis
Code
fa.parallel(df, fm="ml", fa="fa",
            main="Parallel analysis scree plot (IPIP-50)")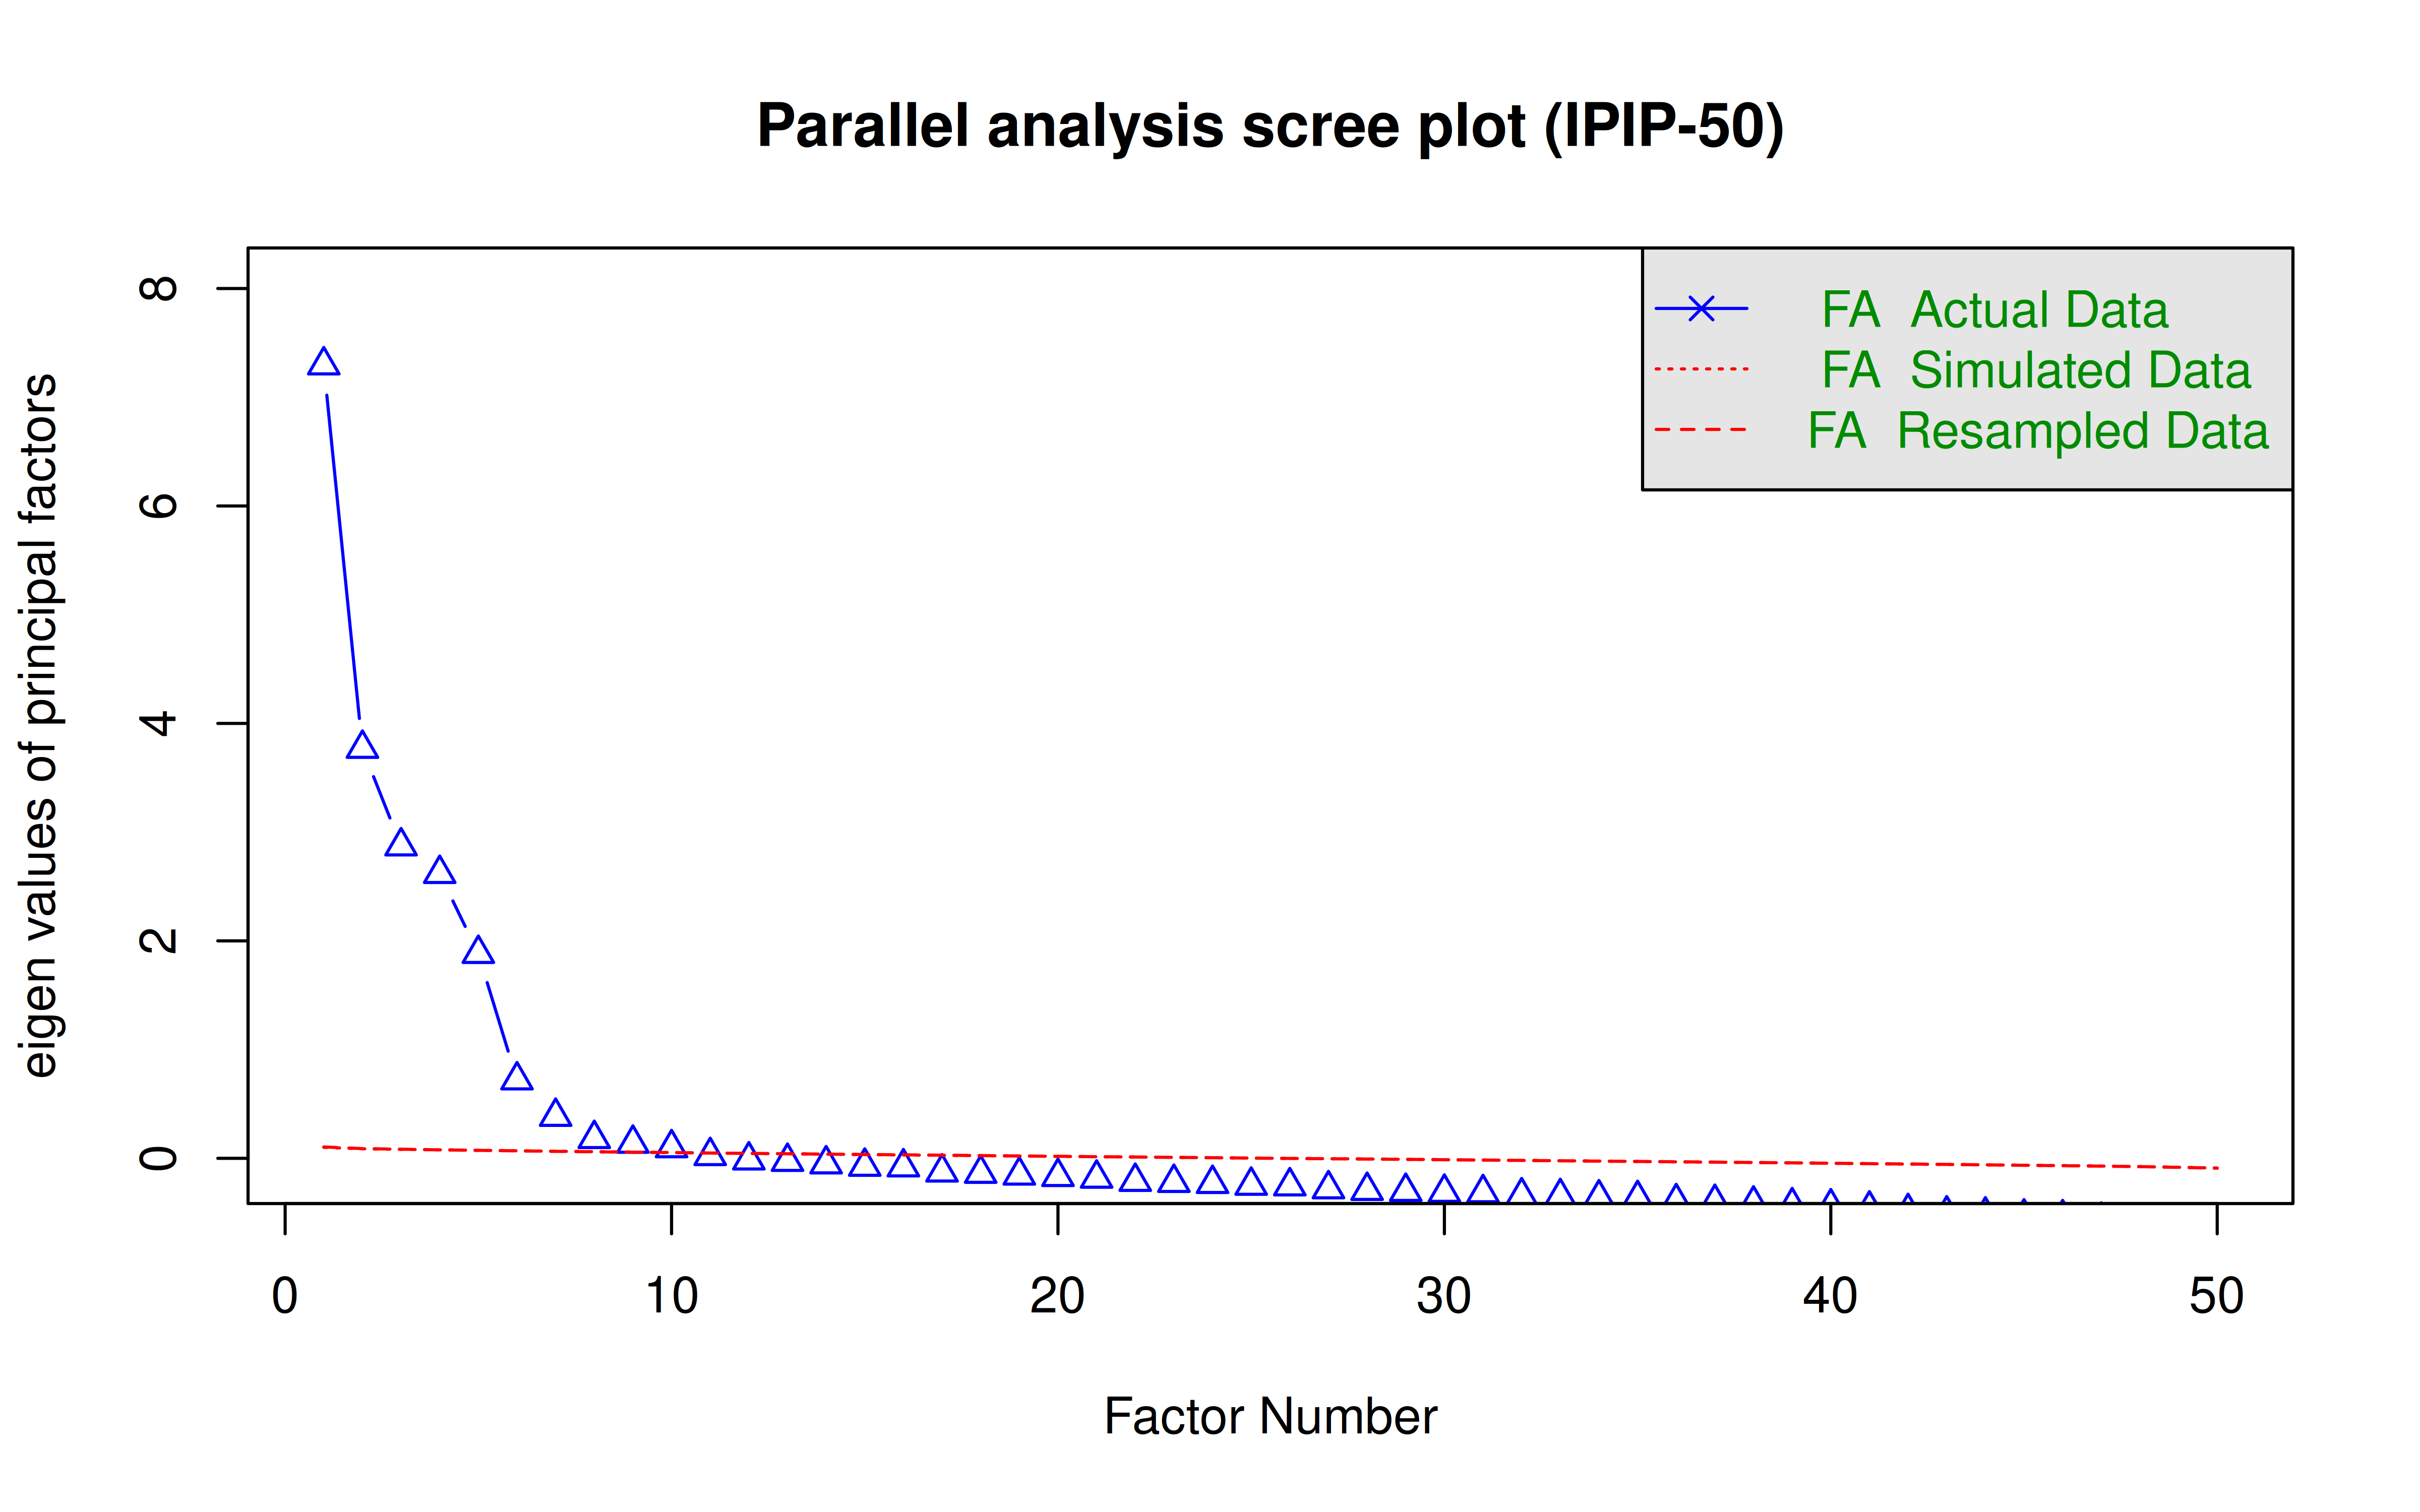
Parallel analysis suggests that the number of factors = 10 and the number of components = NA