Plot the standard normal curve with score scales at any figure size
Source:R/standard_normal_scales.R
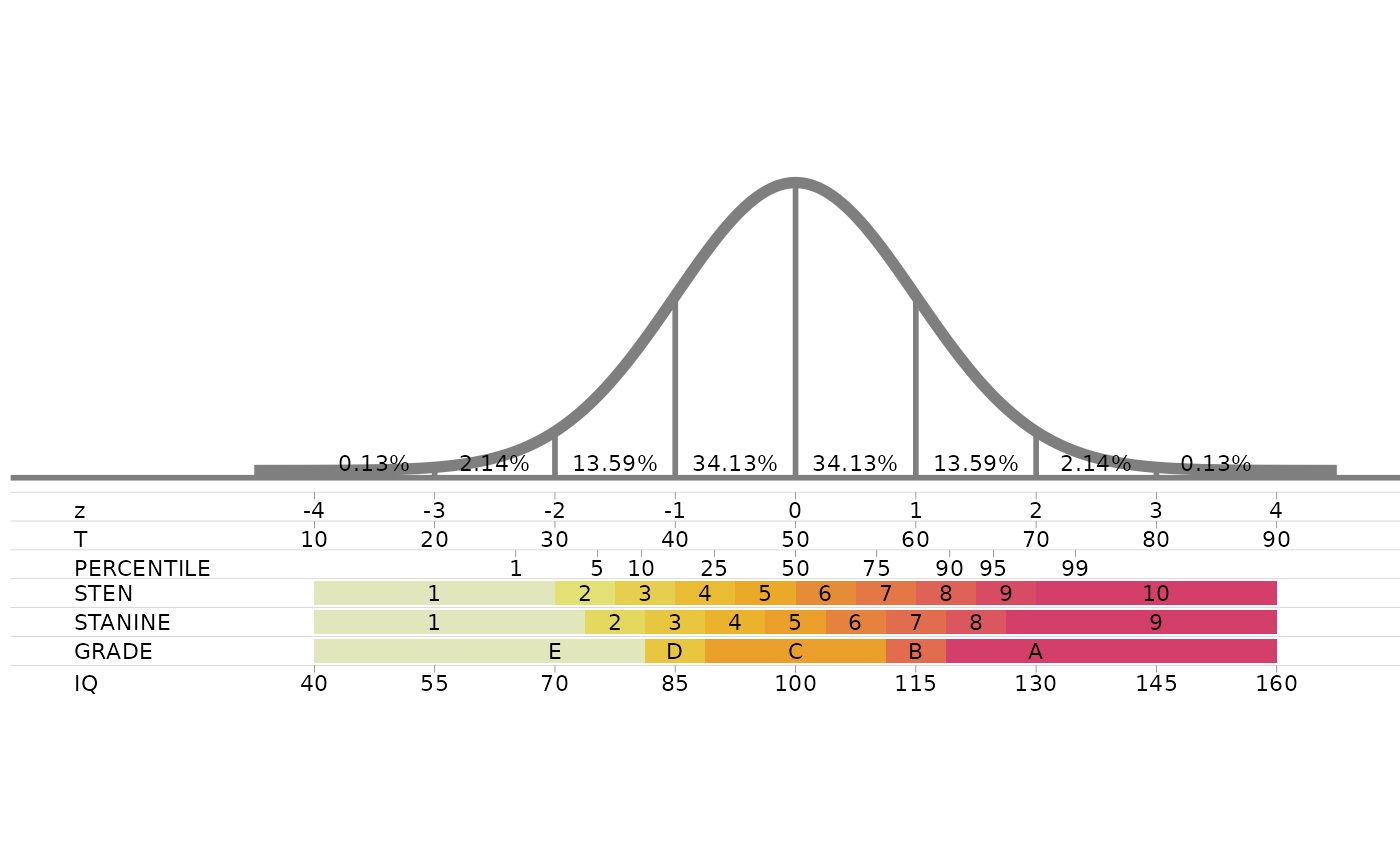
standard_normal_scales.RdDraws the chart of standard_normal_plot: the standard normal
curve, marked at every standard deviation with the percentage of cases in each interval,
with the z, T, percentile, sten, stanine, grade and IQ scales lined up under it, so that a
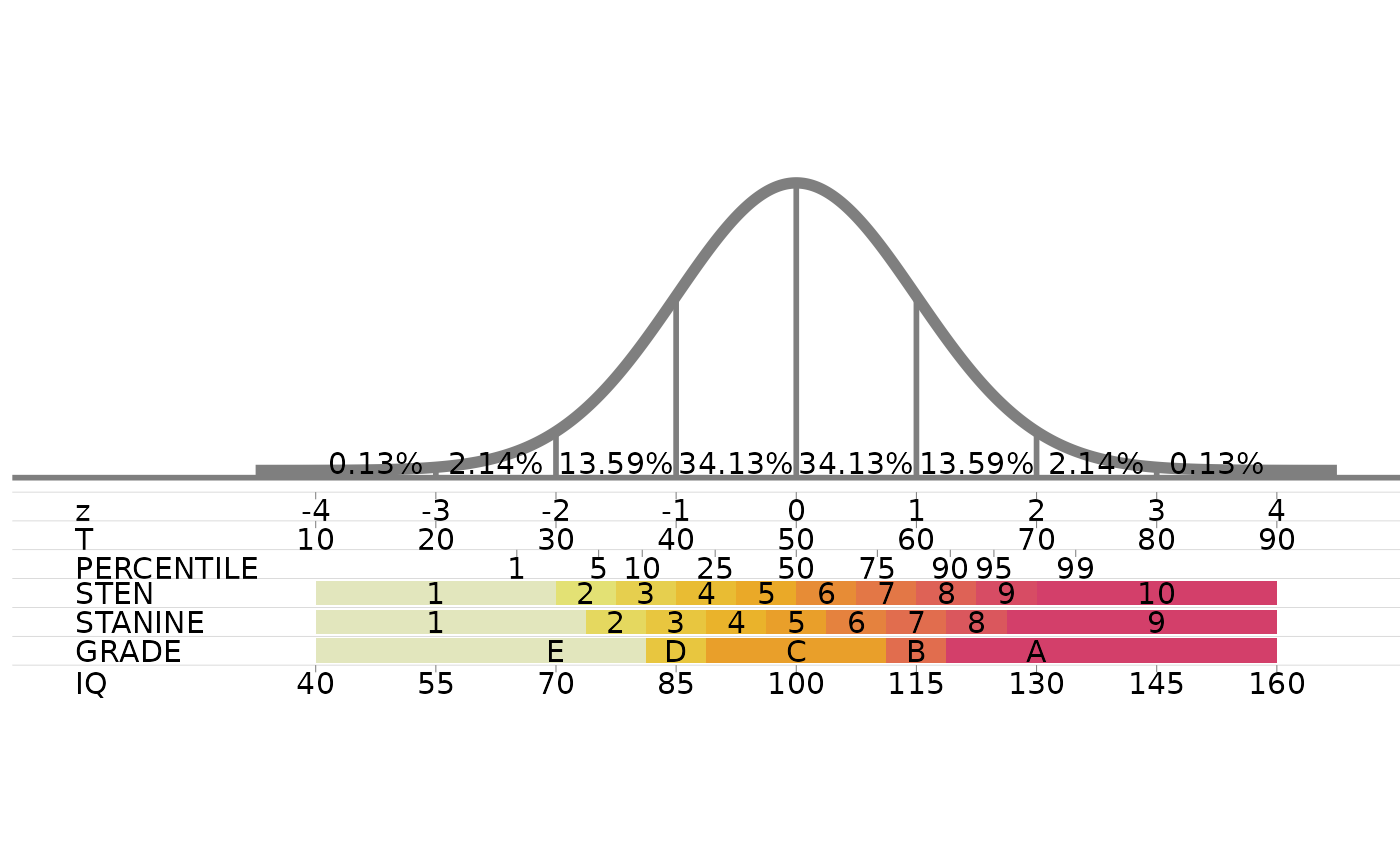
score on one scale can be read off on the others. Here the coloured bands are sized in plot
units, so the rows never overlap whatever the size of the figure, each element is drawn
once, and no ggplot2 warnings are raised.
Value
A ggplot object. Print it to draw the chart, or save it with
ggplot2::ggsave(). The chart keeps a fixed aspect ratio and is about 2.5 times as
wide as it is tall, so a figure with those proportions has no empty margins.
Details
All scales are placed on the z axis:
z: standard score, mean 0 and standard deviation 1.
T: \(50 + 10z\).
Percentile: the z values of the 1st, 5th, 10th, 25th, 50th, 75th, 90th, 95th and 99th percentiles.
Sten: ten bands half a standard deviation wide, sten 1 below \(z = -2\) and sten 10 above \(z = 2\) (mean 5.5, standard deviation 2).
Stanine: nine bands half a standard deviation wide, stanine 5 from \(z = -0.25\) to \(z = 0.25\) (mean 5, standard deviation 2).
Grade: groups of stanines, E (1-2), D (3), C (4-6), B (7) and A (8-9).
IQ: \(100 + 15z\).