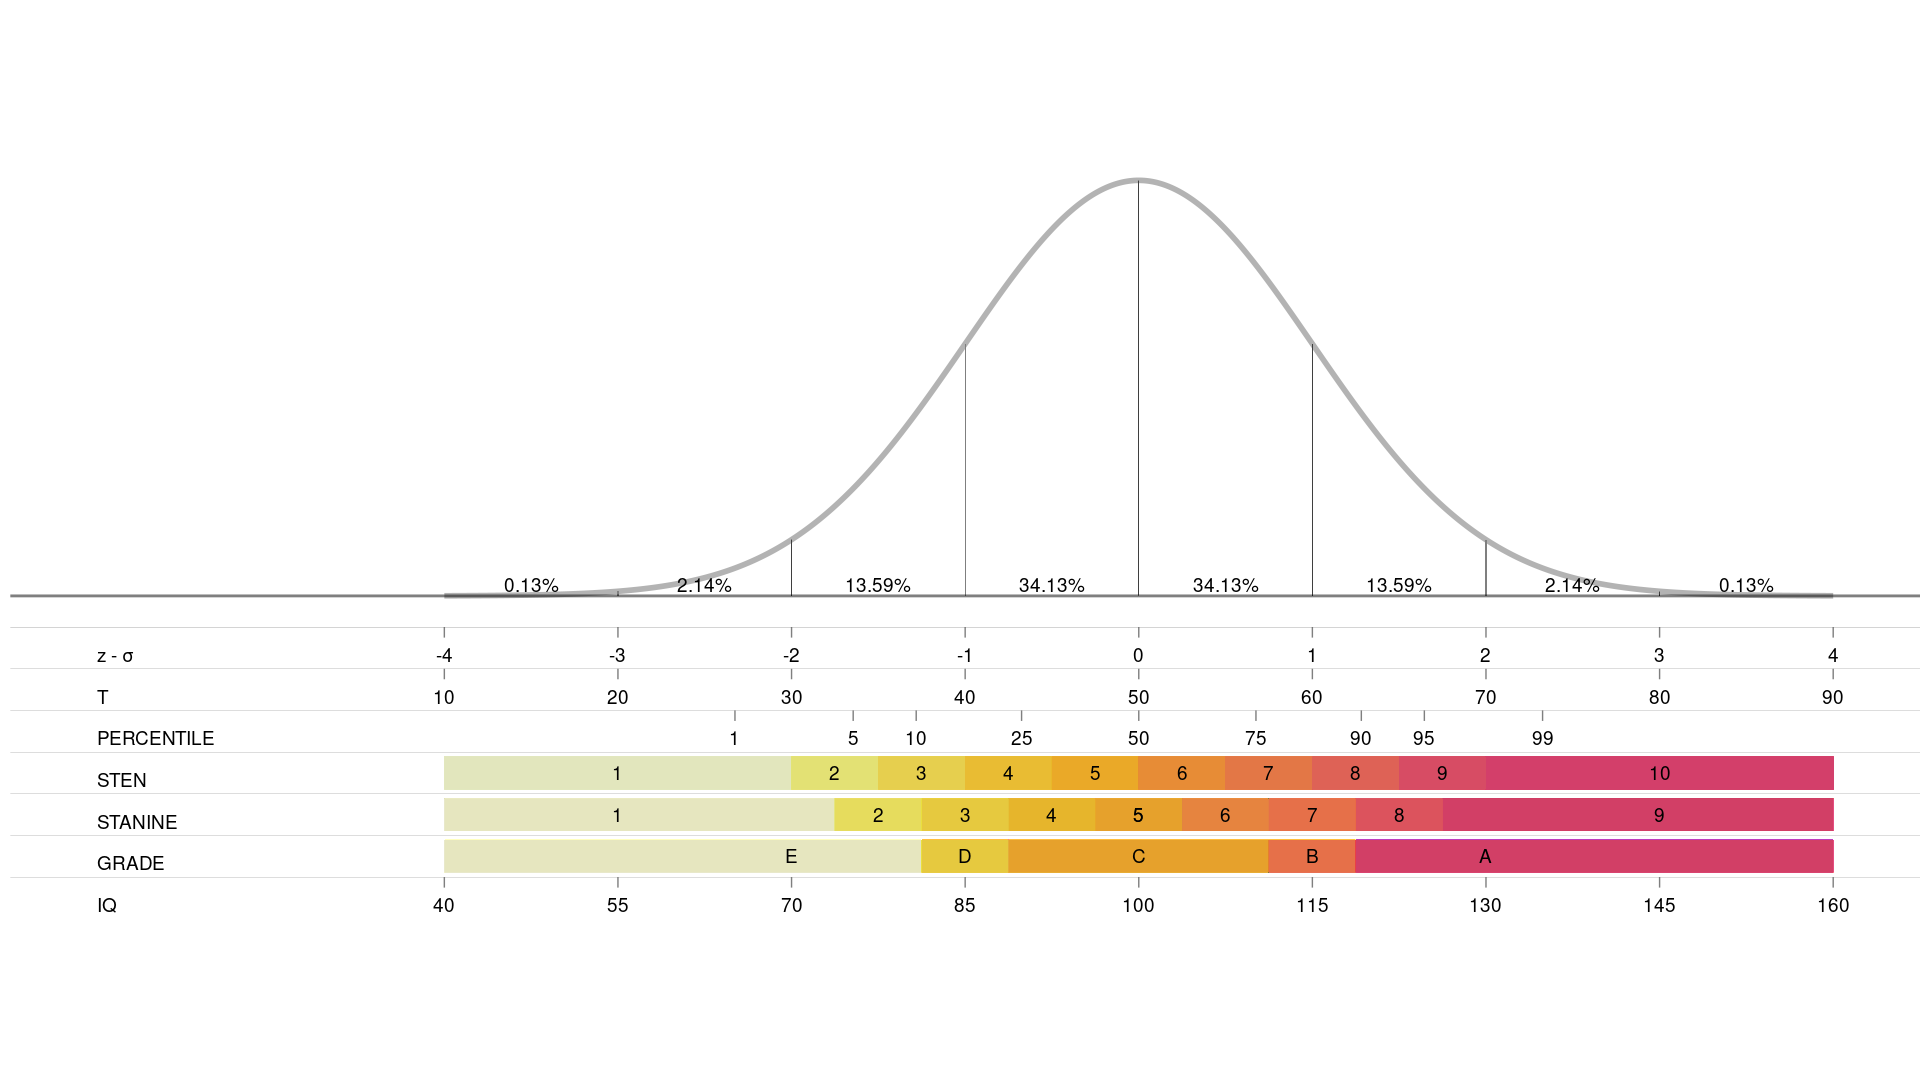
A function that creates a standard normal plot in R with Z T sten stanine and percentile x axis
Installation Instructions
install R
installation instructions can be found here: https://cran.r-project.org/
## install RStudio IDE (optional but a good idea)
installation instructions can be found here: https://posit.co/downloads/
open RStudio and type in the console:
install.packages("devtools")
library(devtools)
install_github("sedzinfo/snp")
Usage
library(snp)
standard_normal_plot()