Runs a confirmatory factor analysis (CFA) repeatedly across a range of sample sizes and returns fit indices for each. Useful for power analysis and sample size planning in SEM.
Two workflows are supported:
Coefficient-based: supply
model_simwith fixed loadings - data are generated from those population parameters at each sample size.Correlation-based: supply
df- data are bootstrapped from the observed correlation structure ofdfat each sample size.
Iterations run in parallel via future.apply. Results are written to
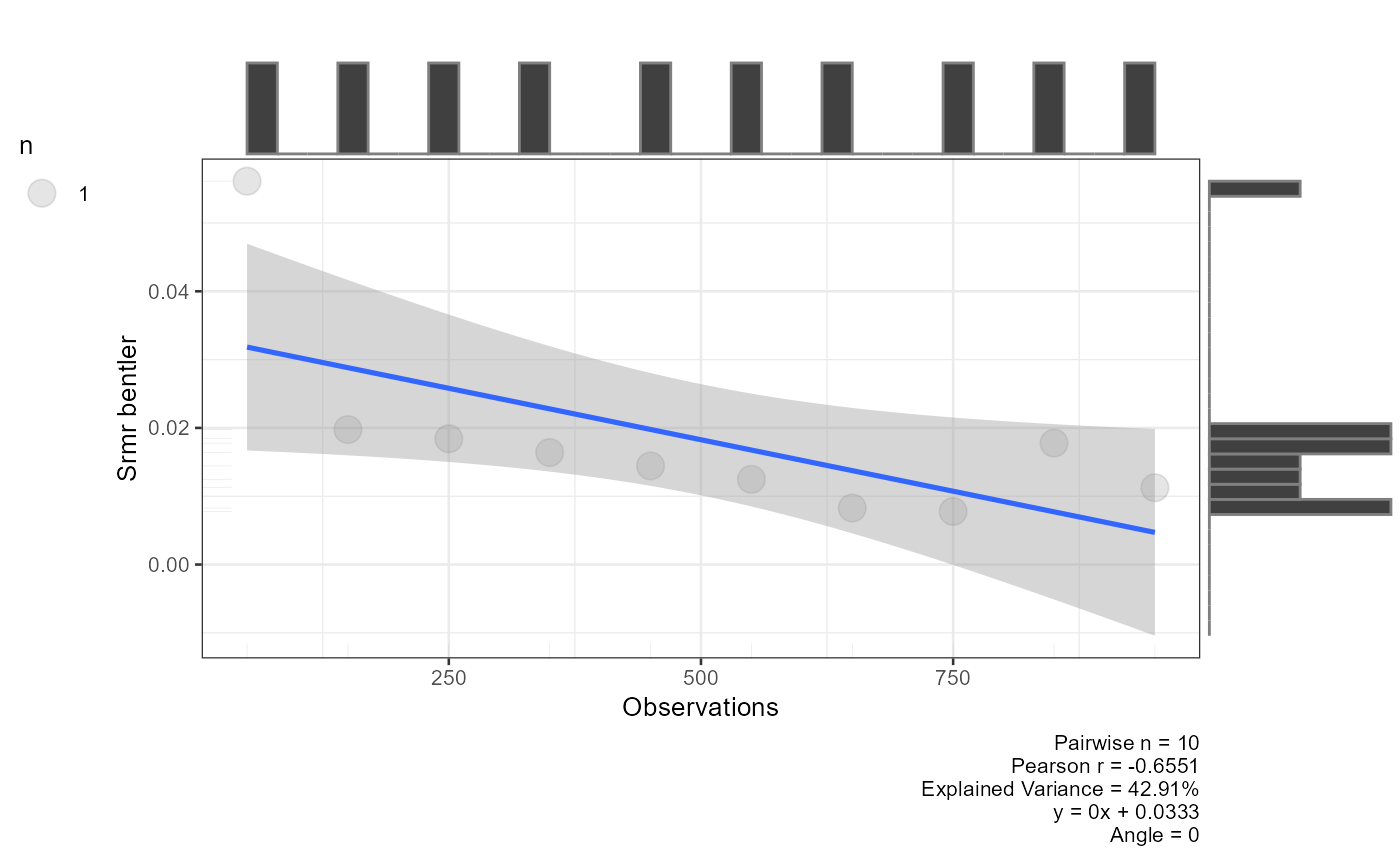
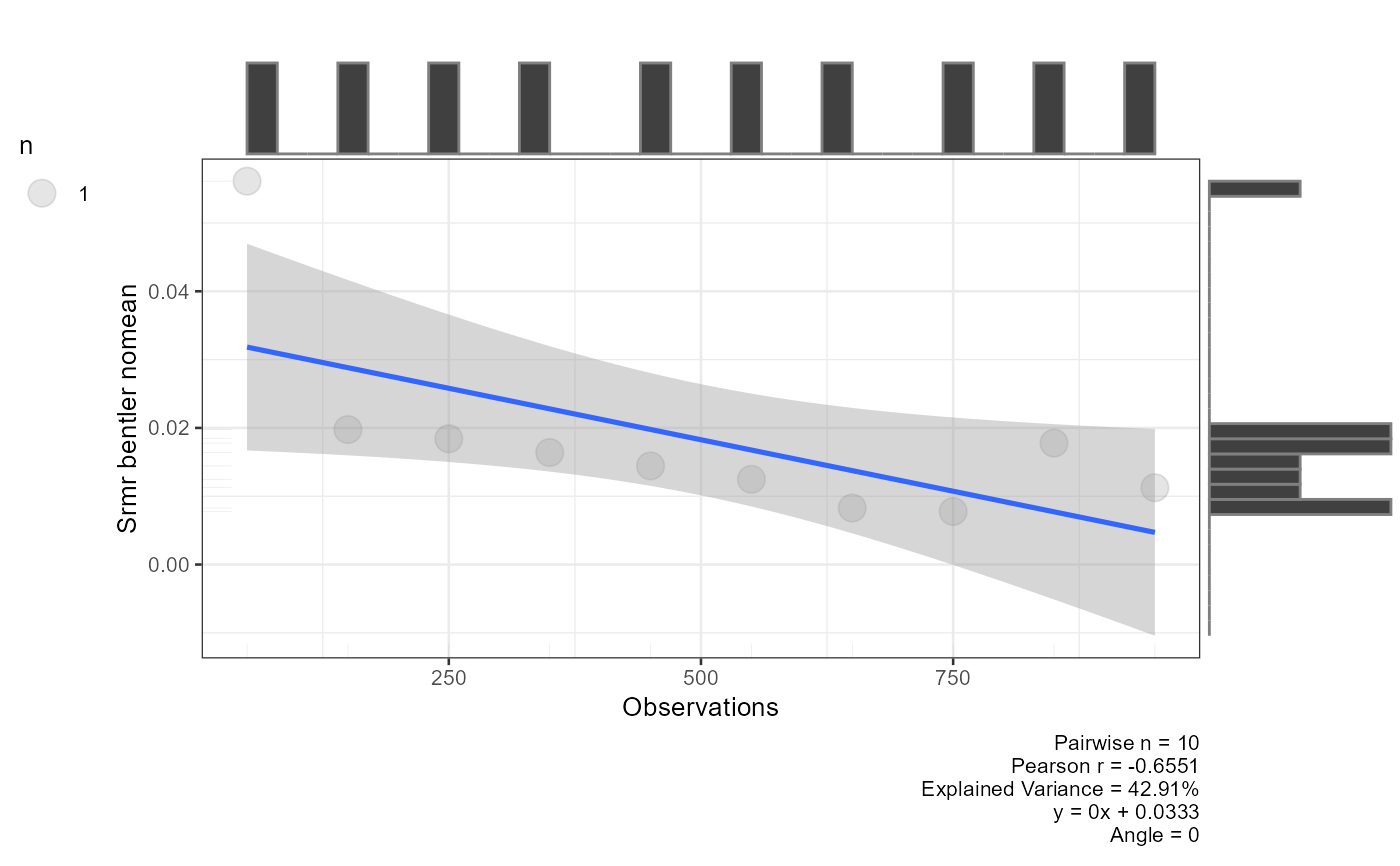
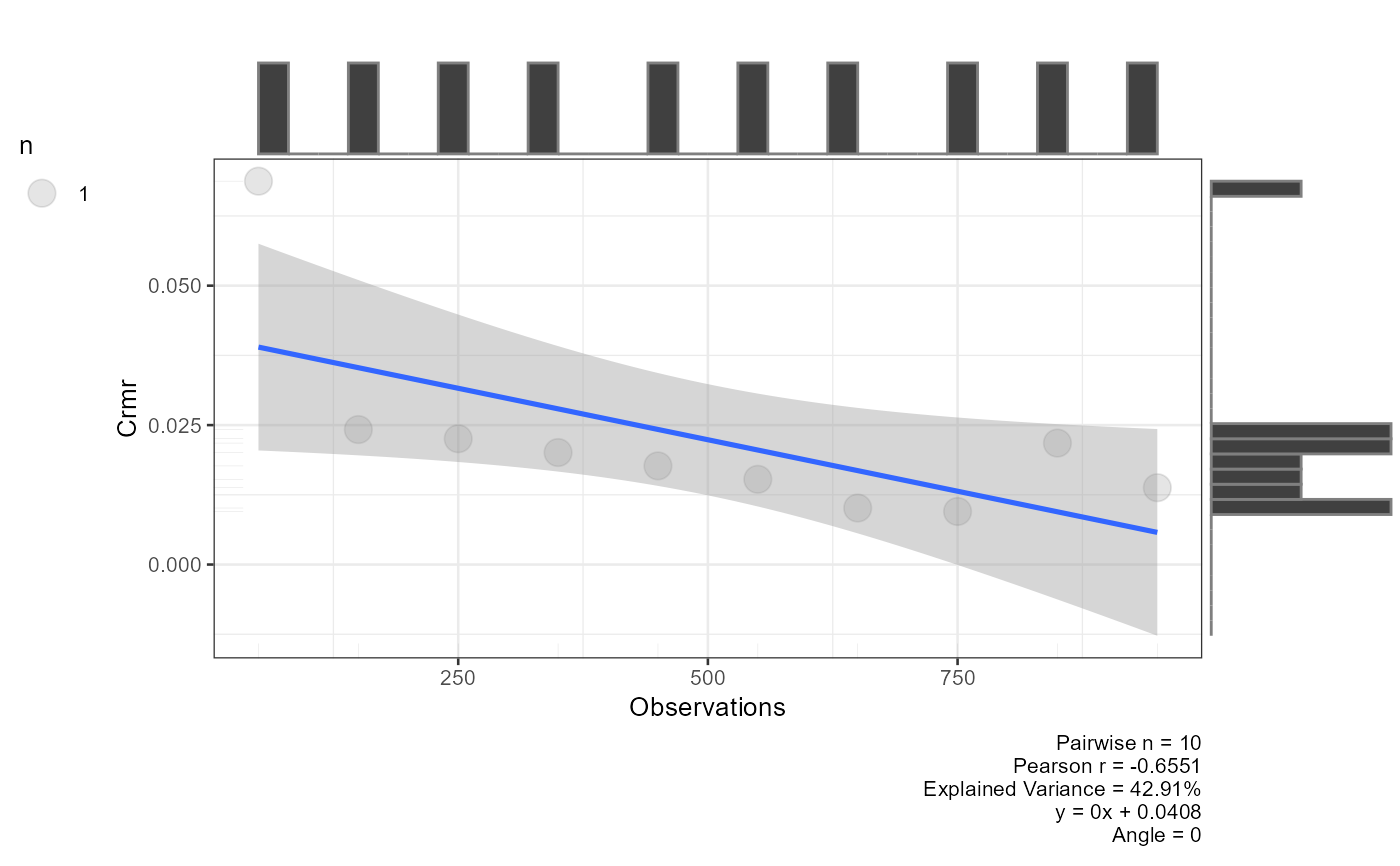
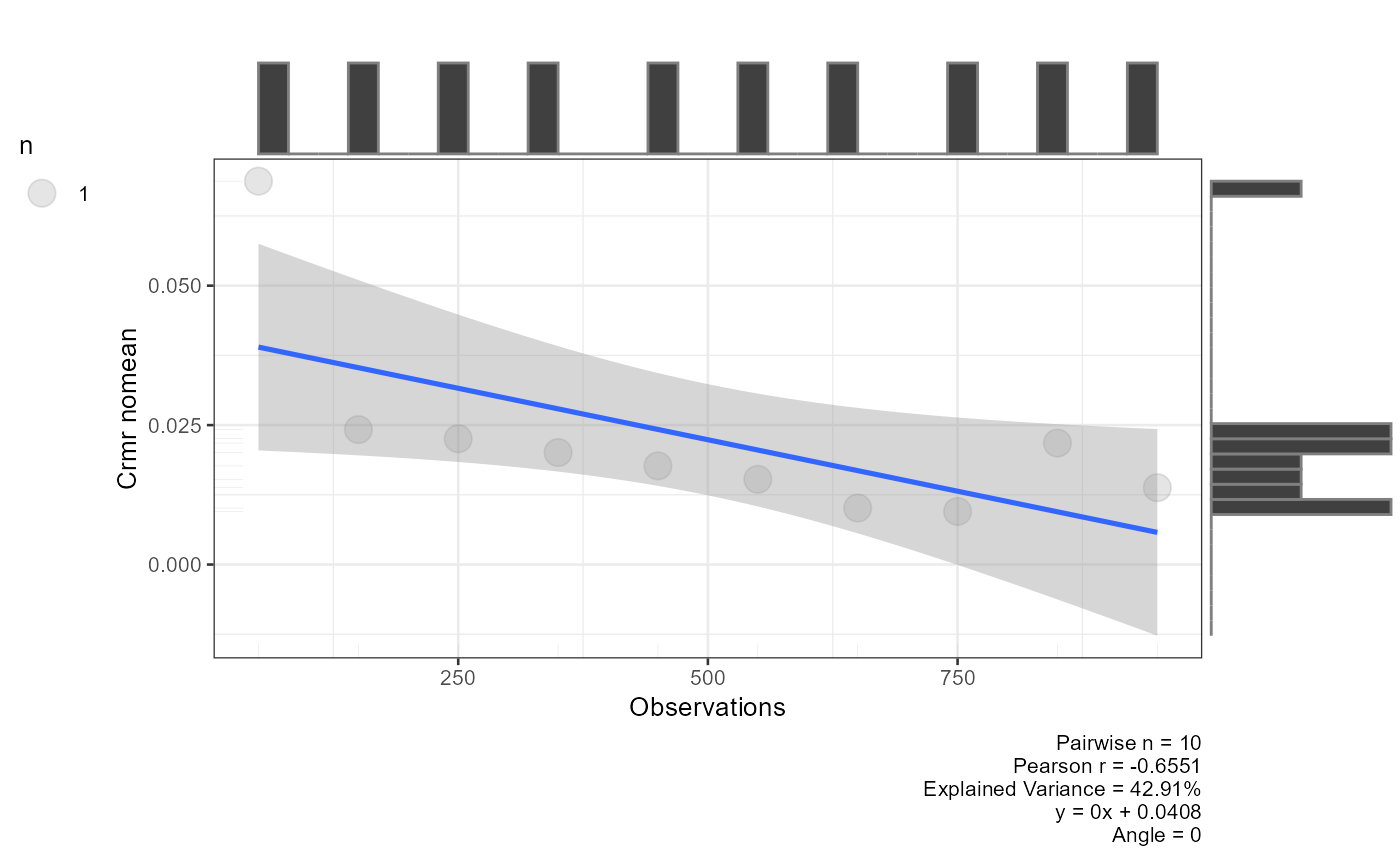
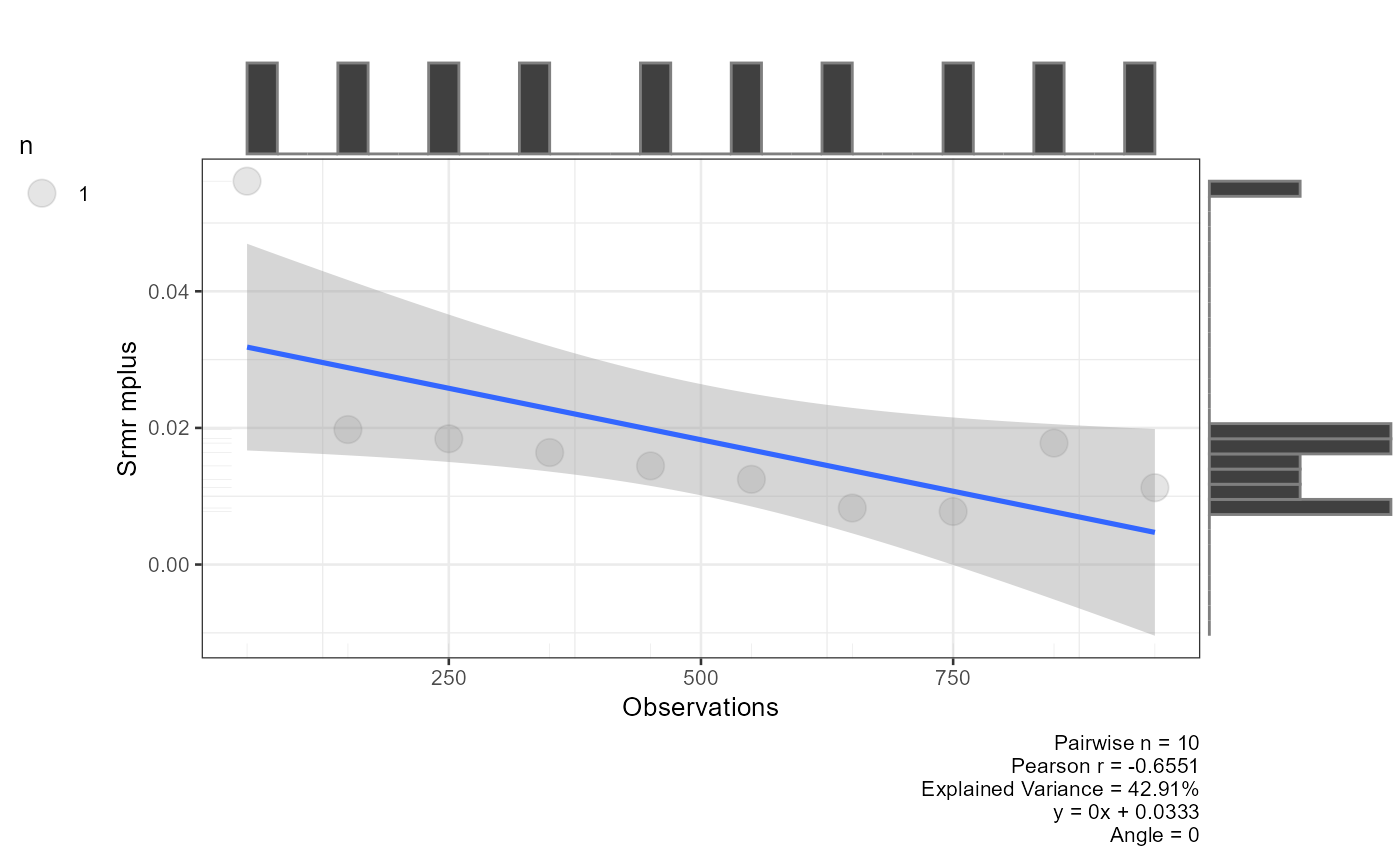
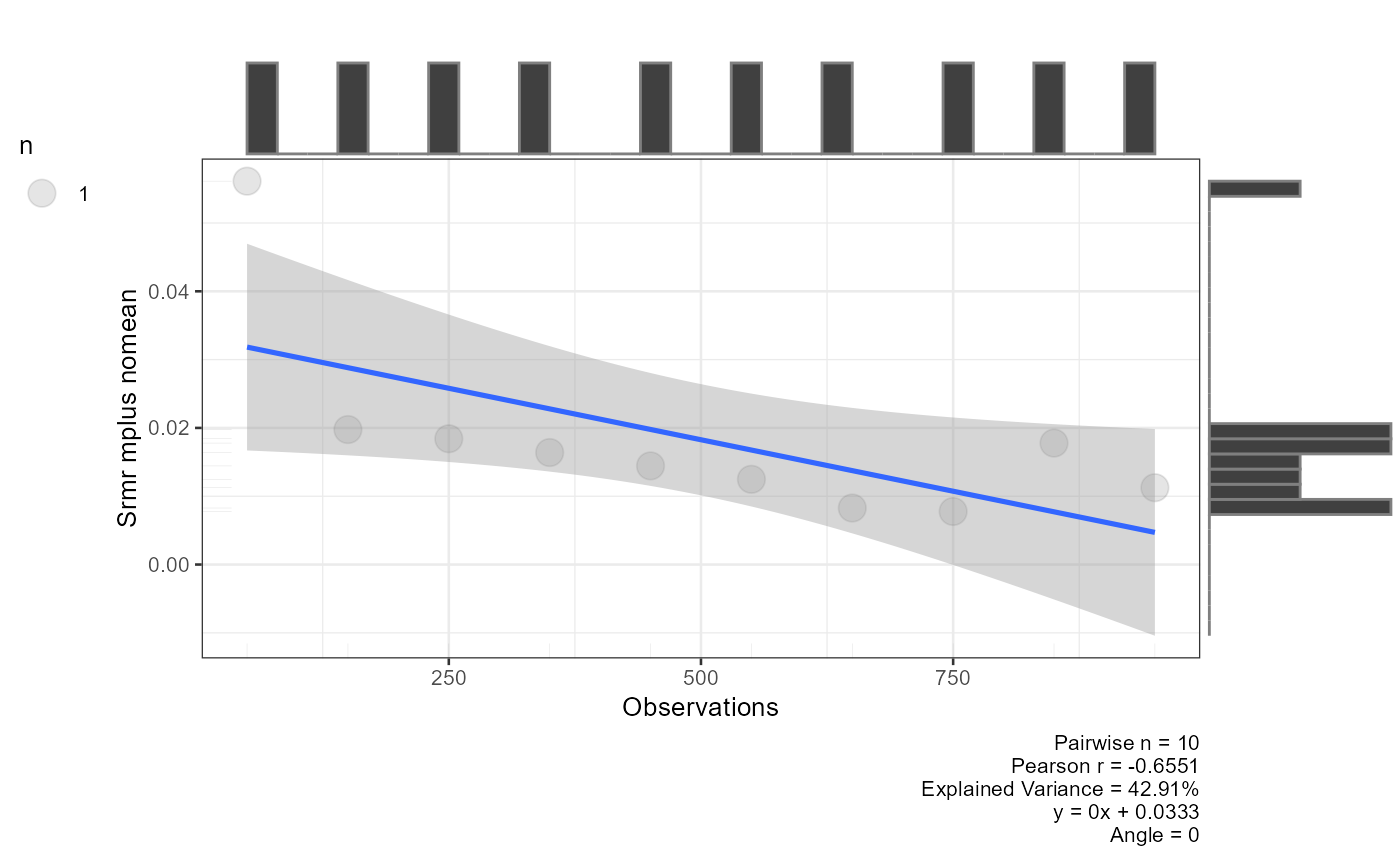
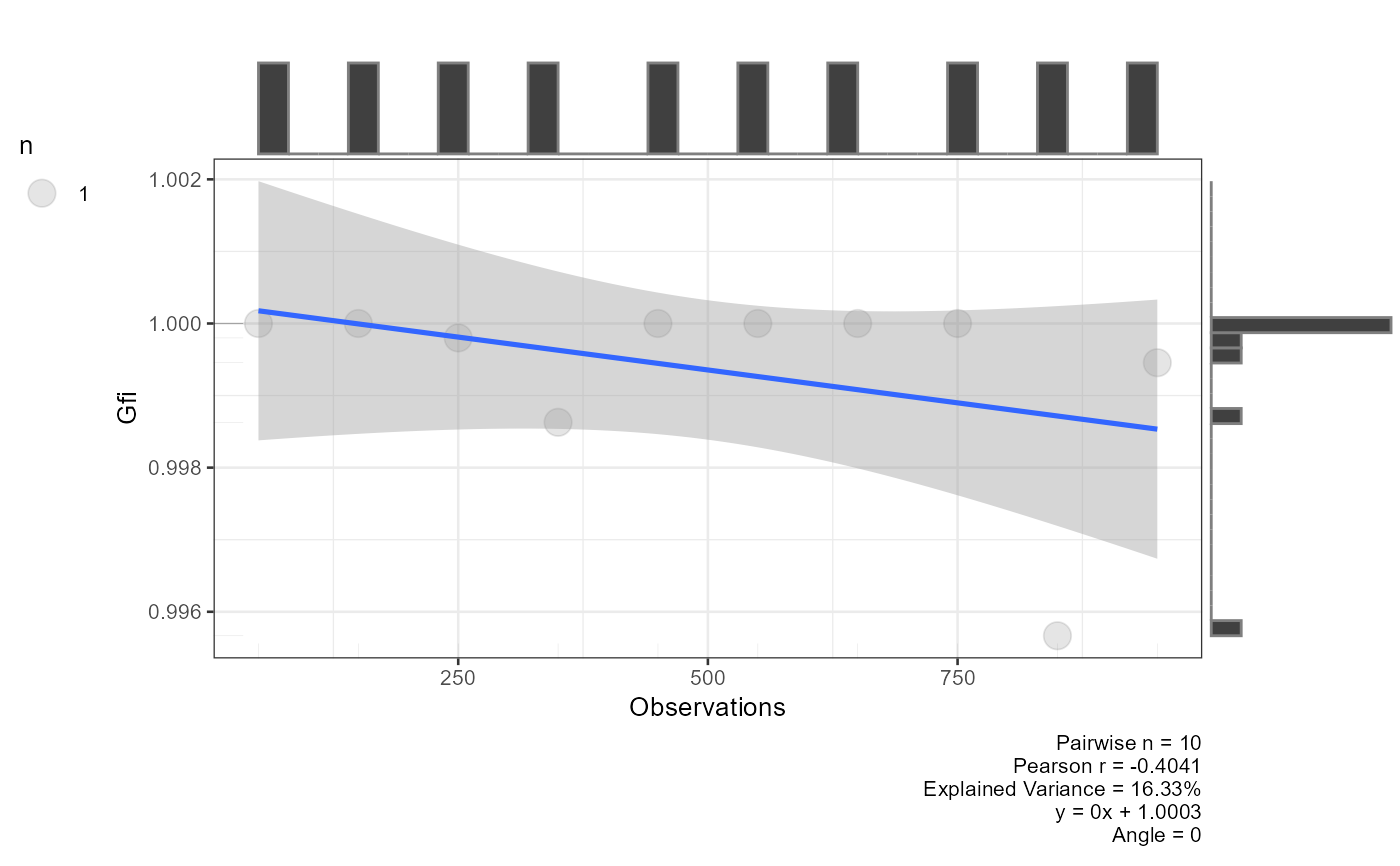
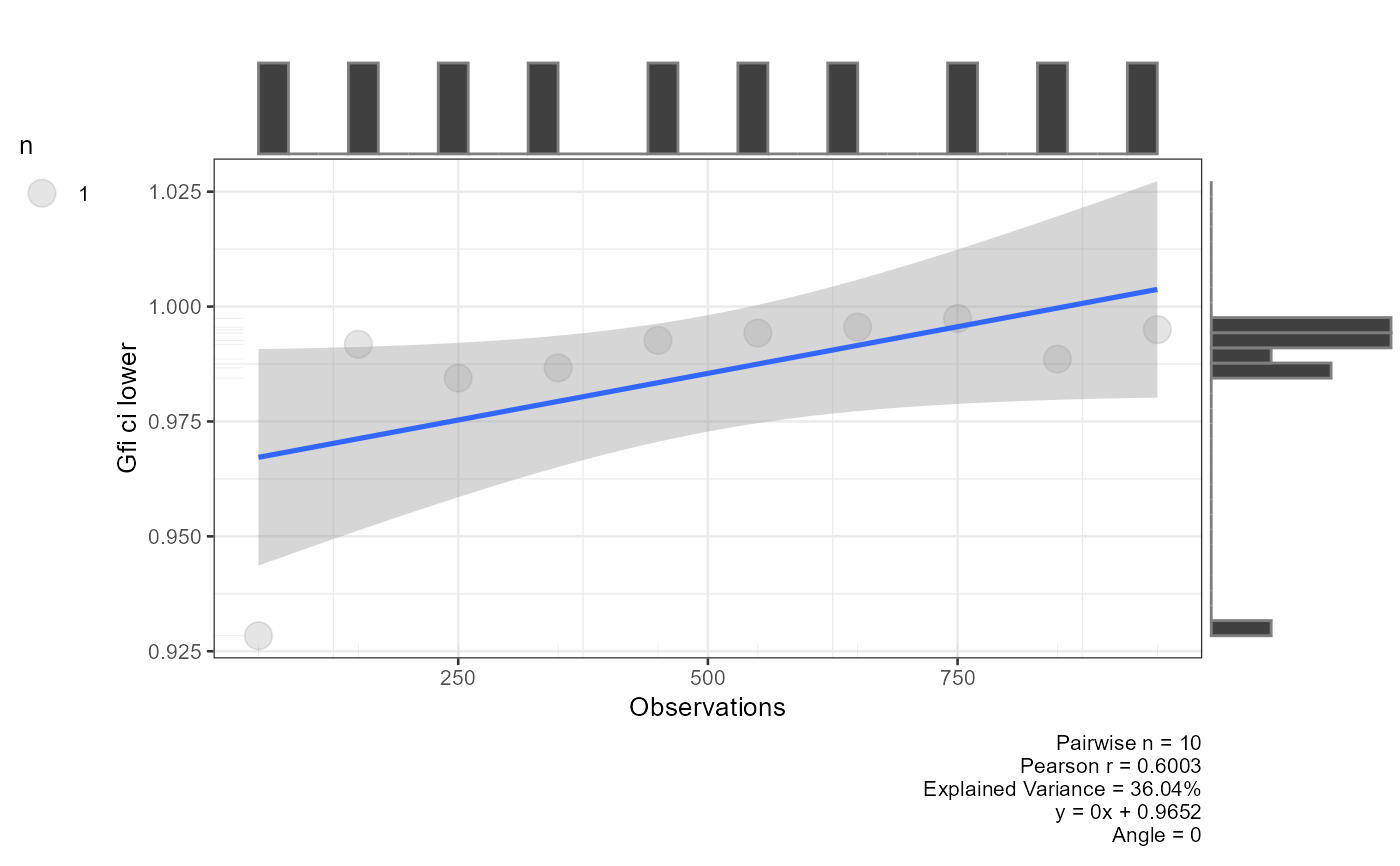
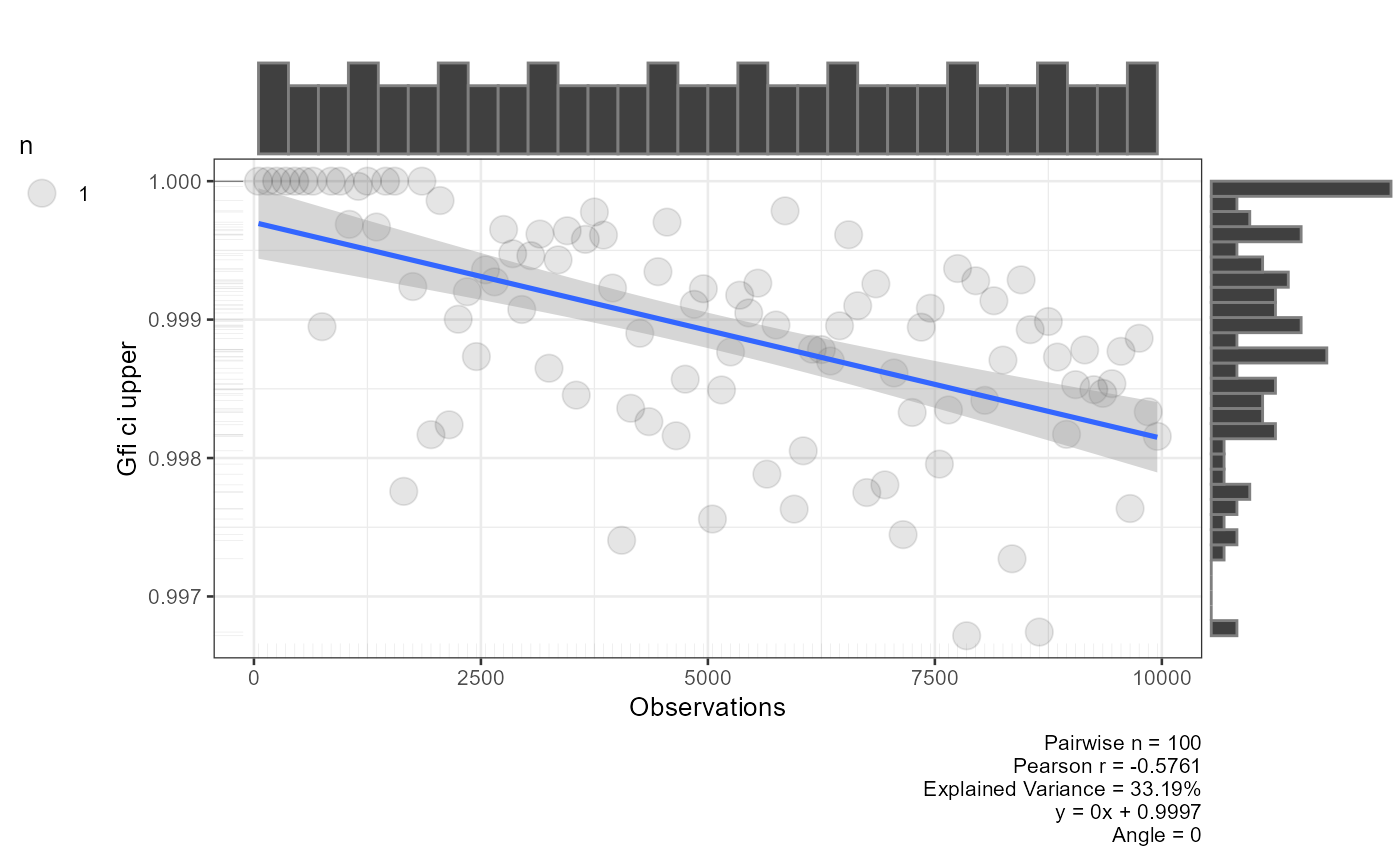
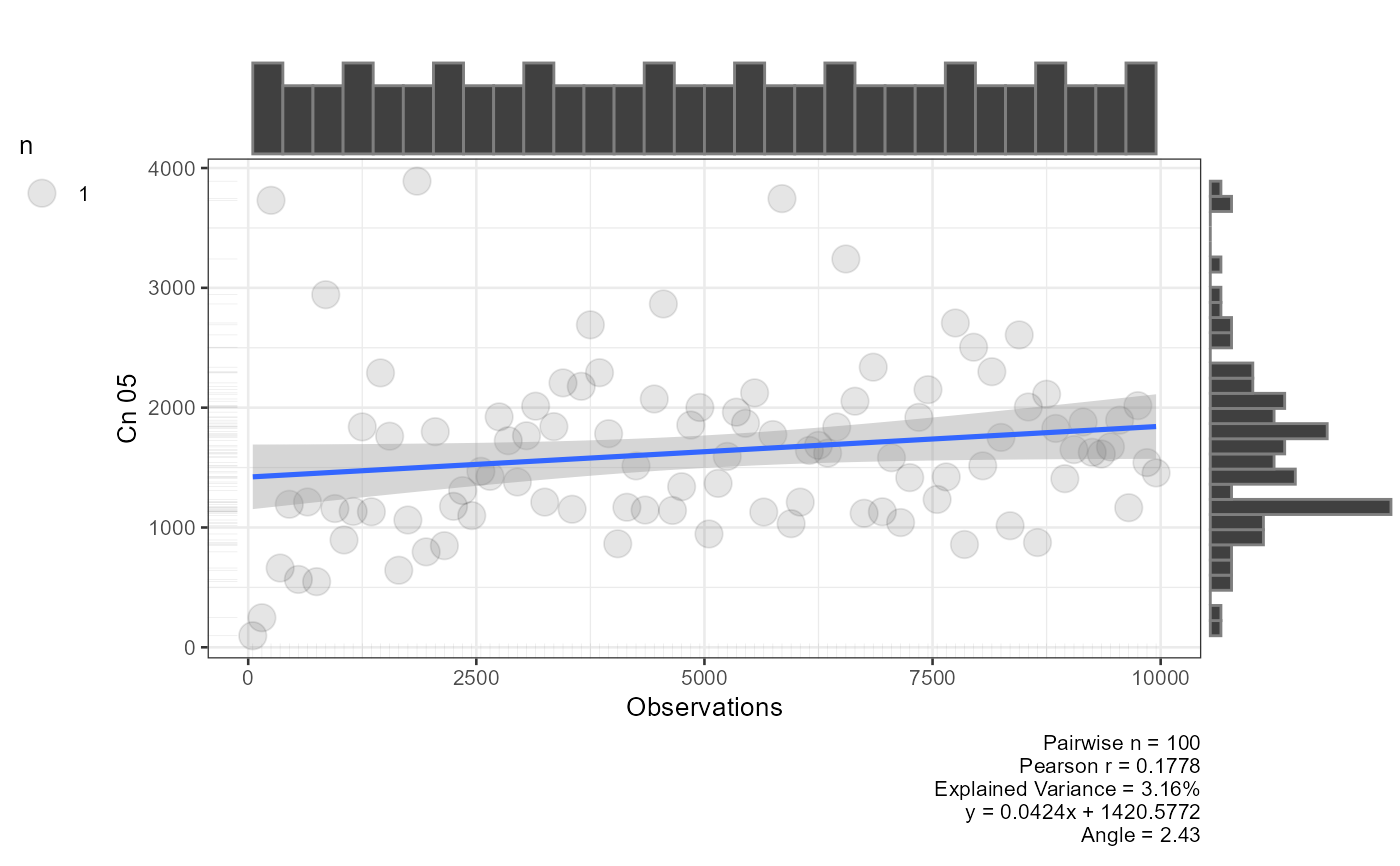
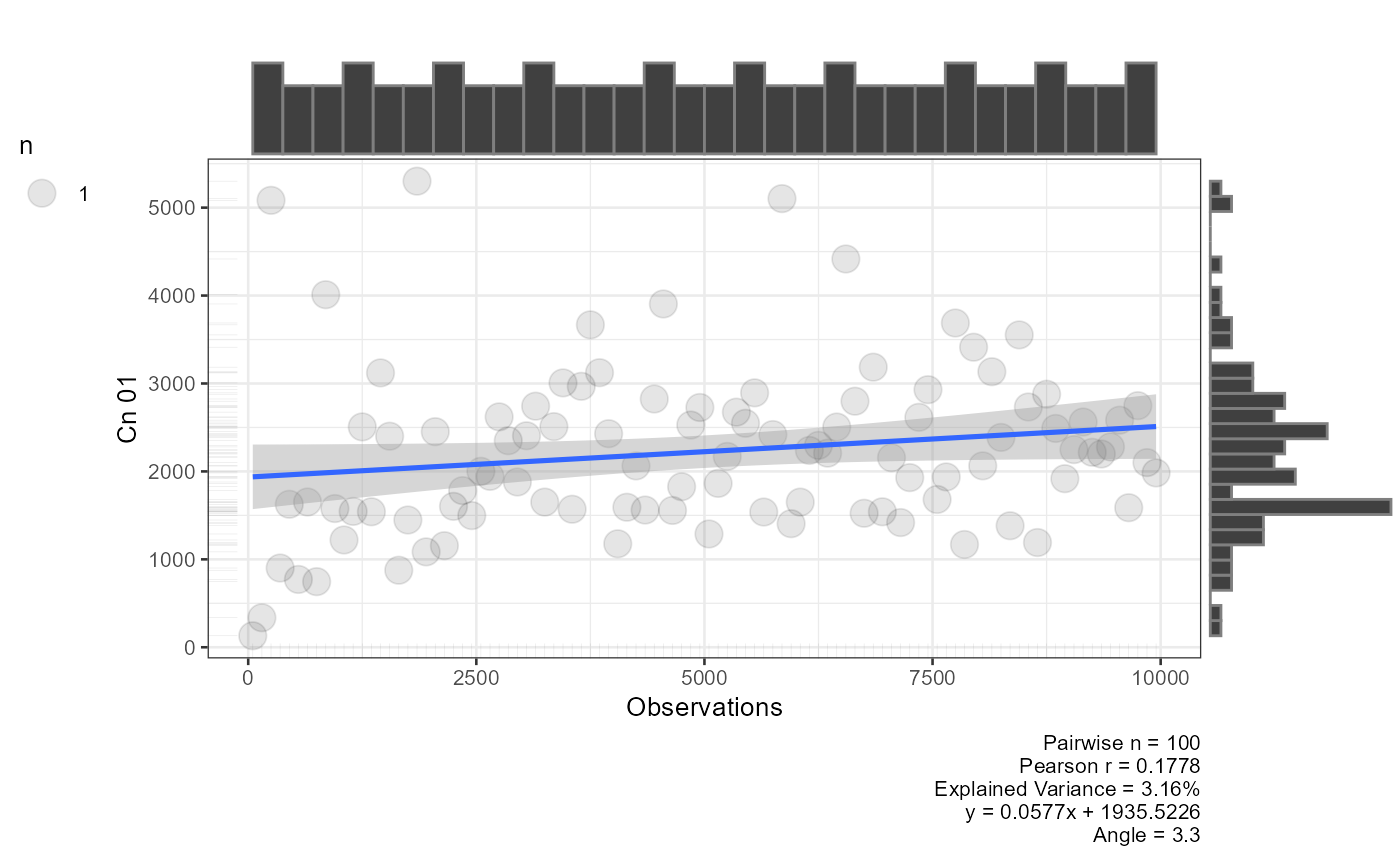
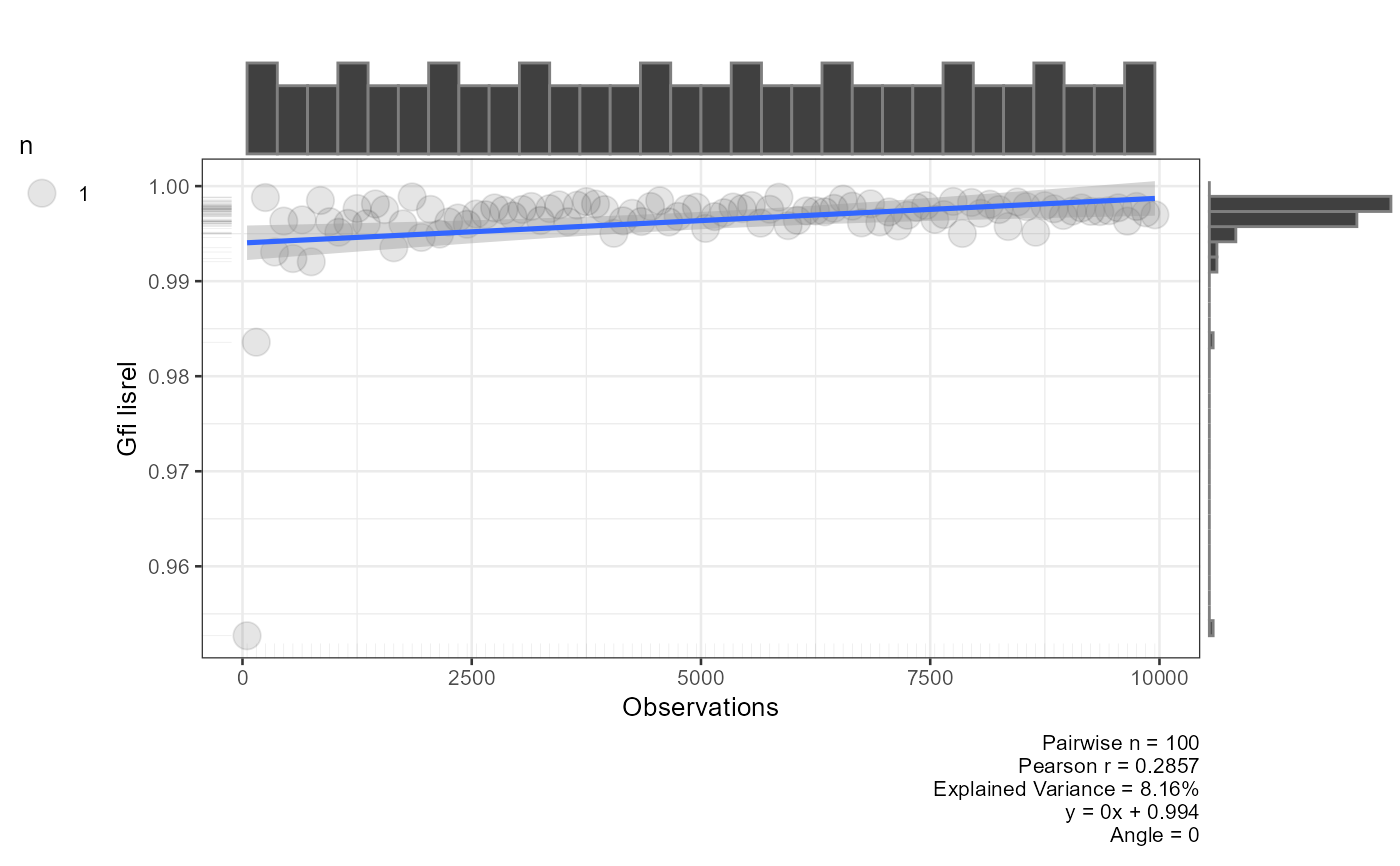
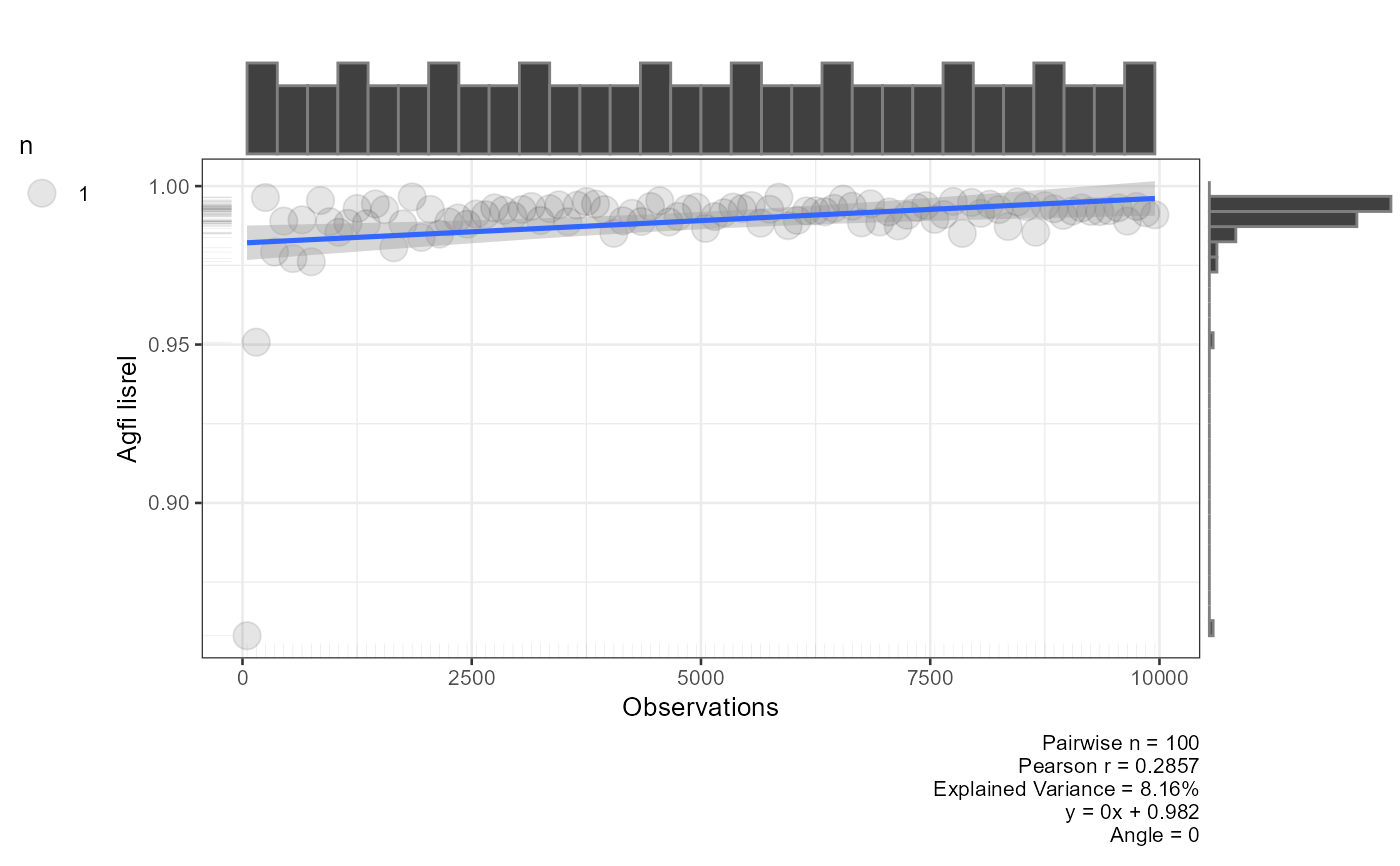
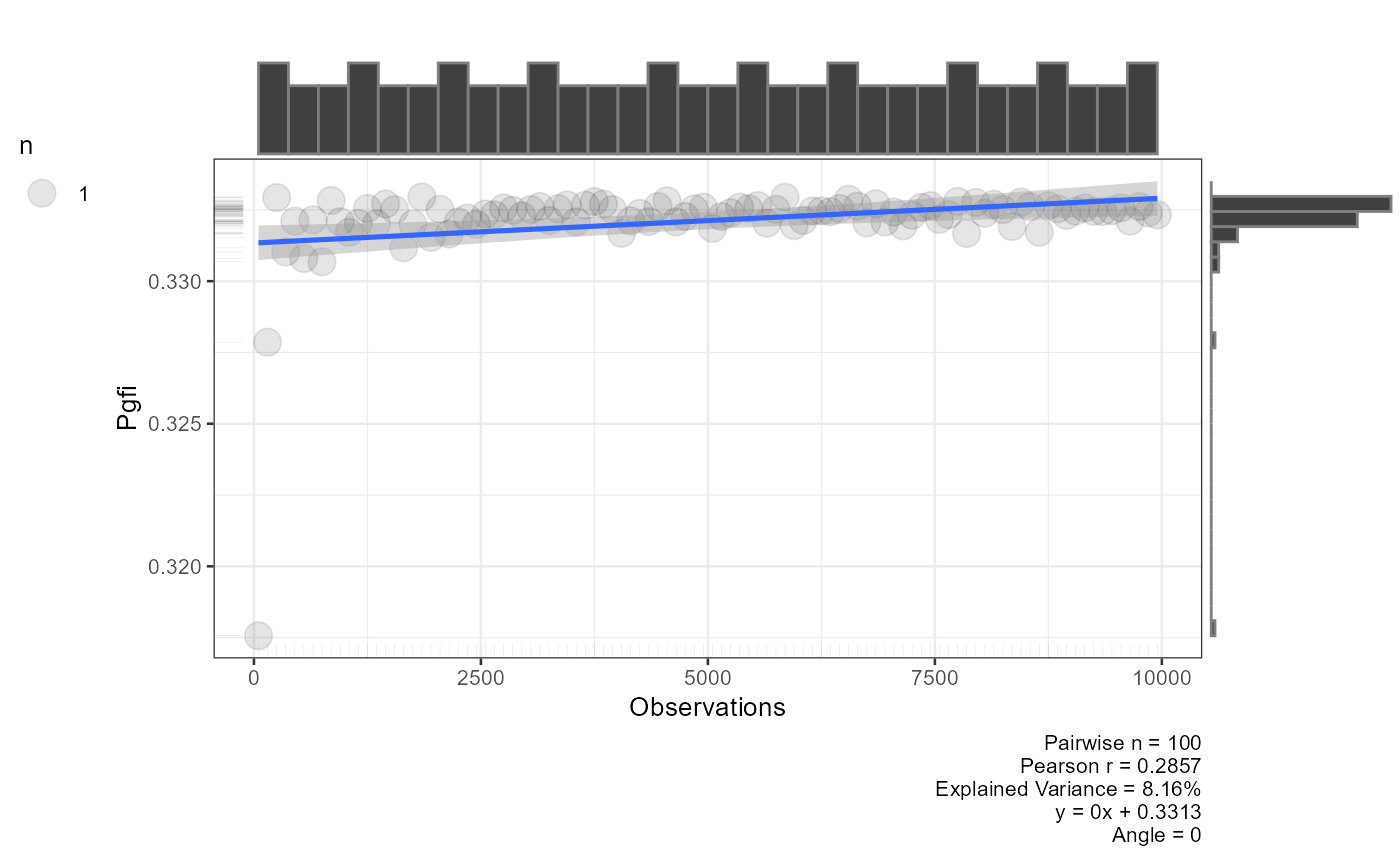
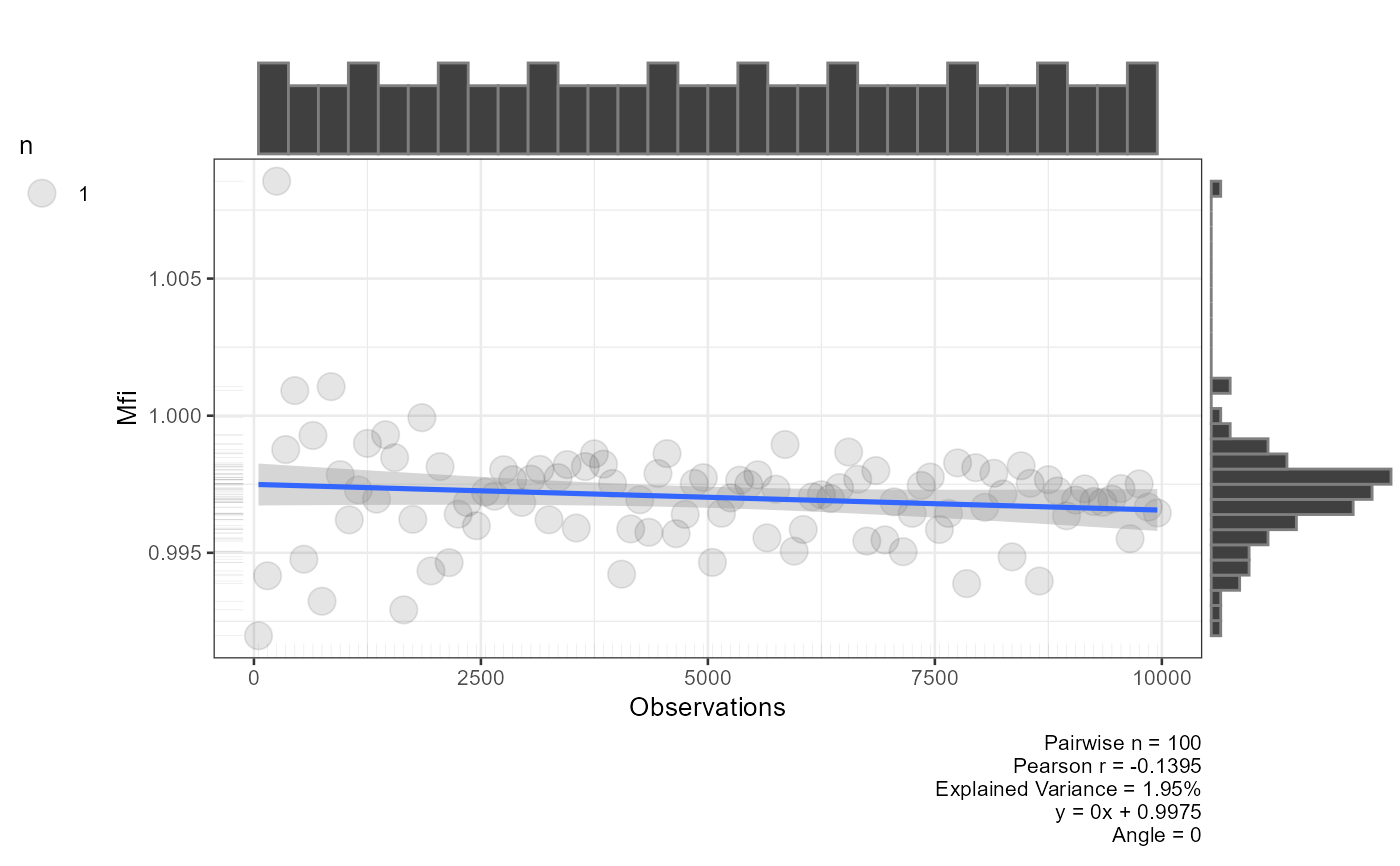
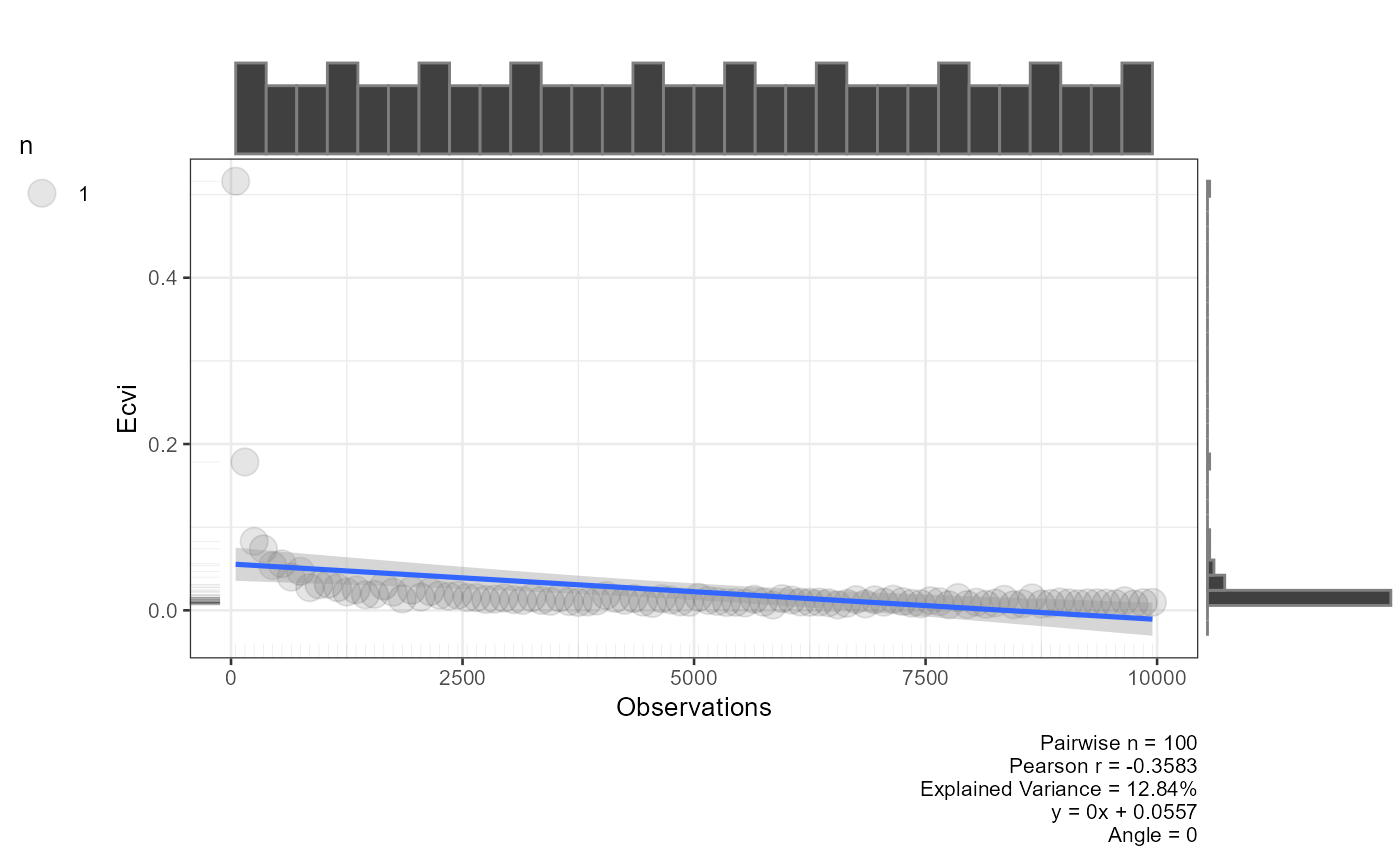
a PDF (scatter plots of fit indices vs. sample size) and an Excel file.
Usage
simulate_cfa_fit(
  model_sim = NULL,
  model = NULL,
  df = NULL,
  minnobs = 50,
  maxnobs = 1000,
  stepping = 10,
  file = NULL,
  w = 10,
  h = 10
)
Arguments
- model_sim
A
lavaanmodel string with fixed coefficients (e.g."F =~ 1*x1 + 0.8*x2"). Used to generate population data. Mutually exclusive withdf; supply one or the other.- model
A
lavaanmodel string with free coefficients specifying the CFA structure to be estimated at each sample size (e.g."F =~ x1 + x2").- df
A data frame of observed data. When supplied, each iteration simulates data by sampling from the observed correlation structure. Mutually exclusive with
model_sim.- minnobs
Integer. Smallest sample size to evaluate. Default
50.- maxnobs
Integer. Largest sample size to evaluate. Default
1000.- stepping
Integer. Increment between sample sizes. Default
10.- file
Character. Base name (without extension) for the output PDF and Excel files. If
NULLno files are written.- w
Numeric. Width of the output PDF in inches. Default
10.- h
Numeric. Height of the output PDF in inches. Default
10.
Value
A list of two elements:
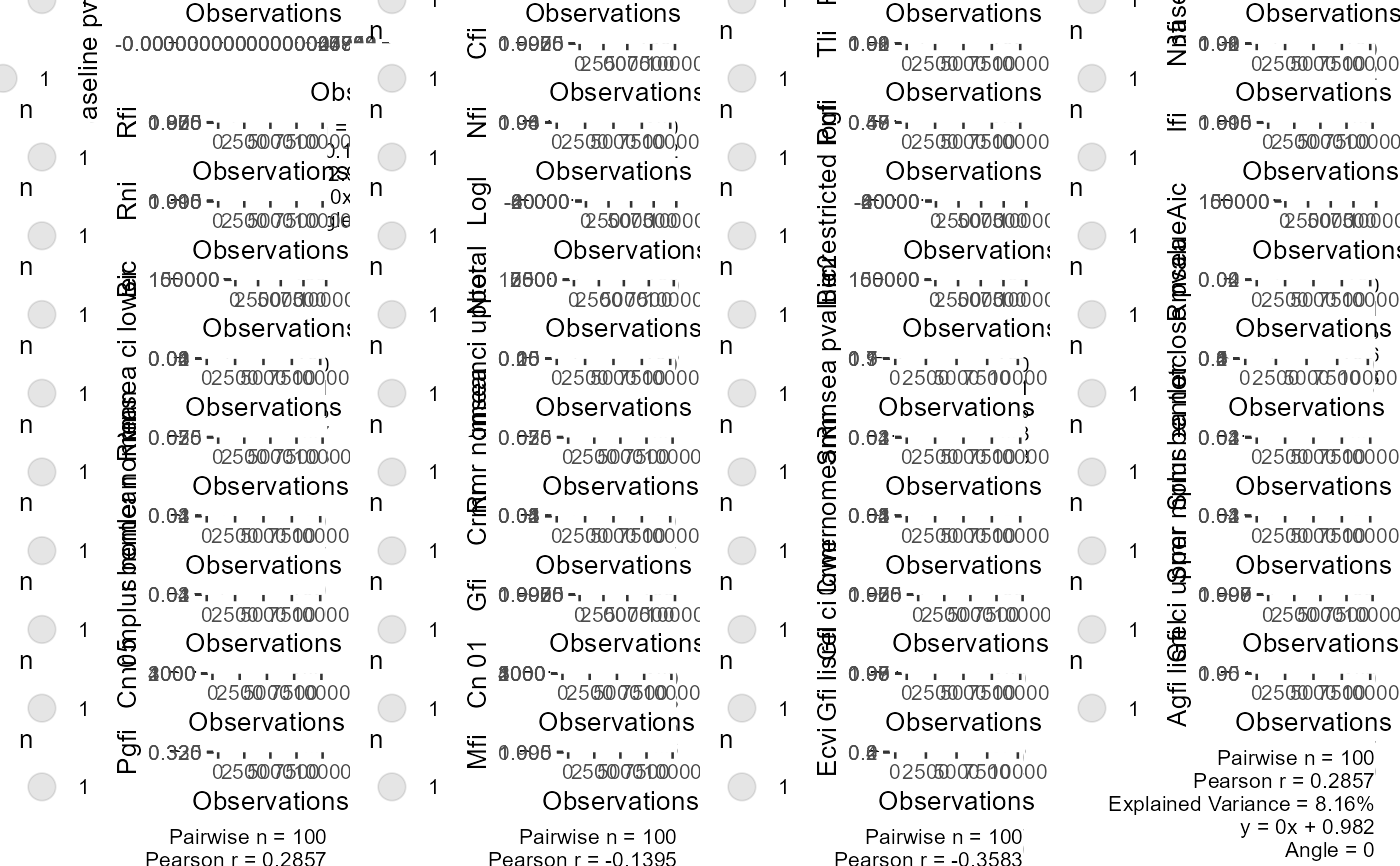
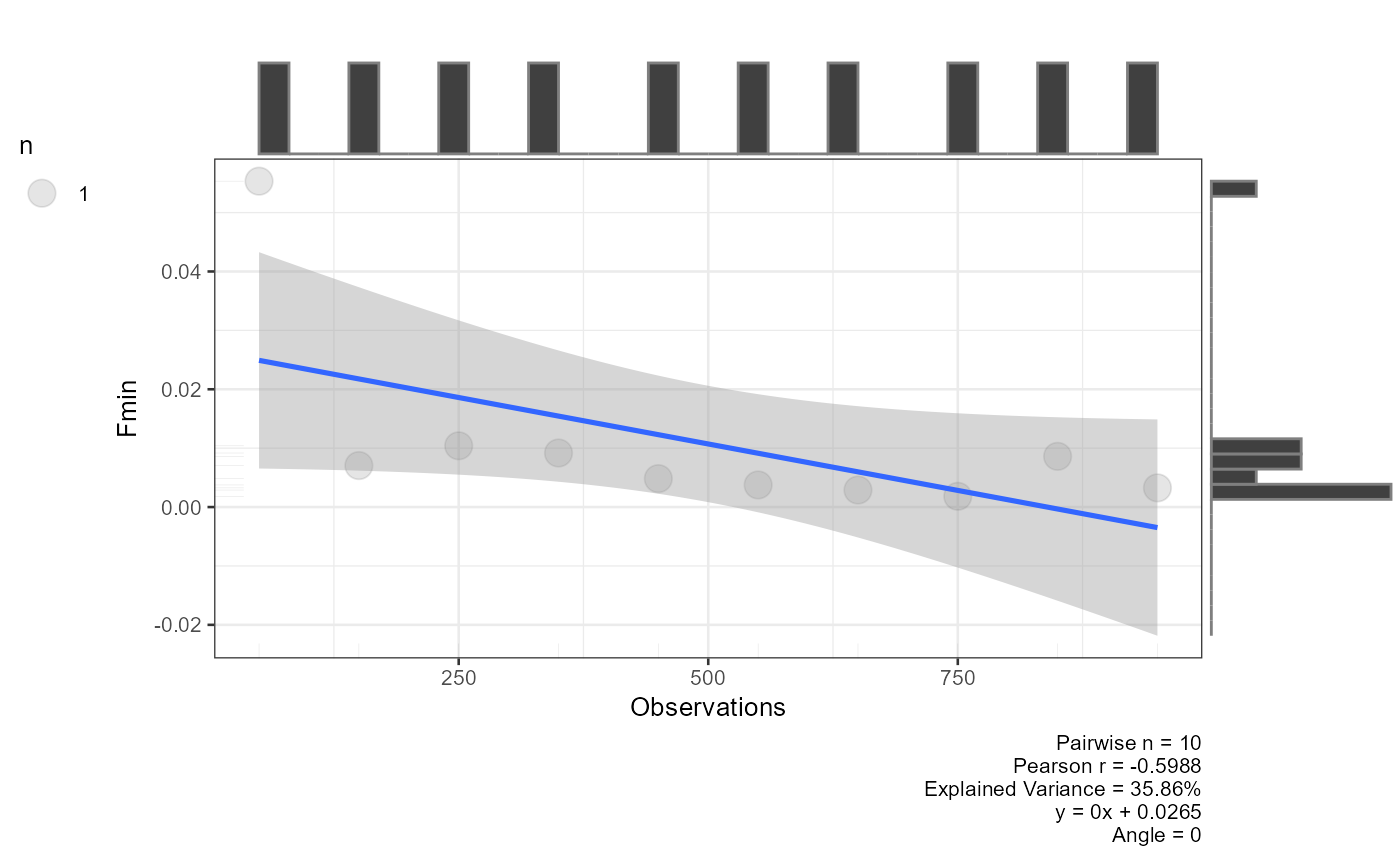
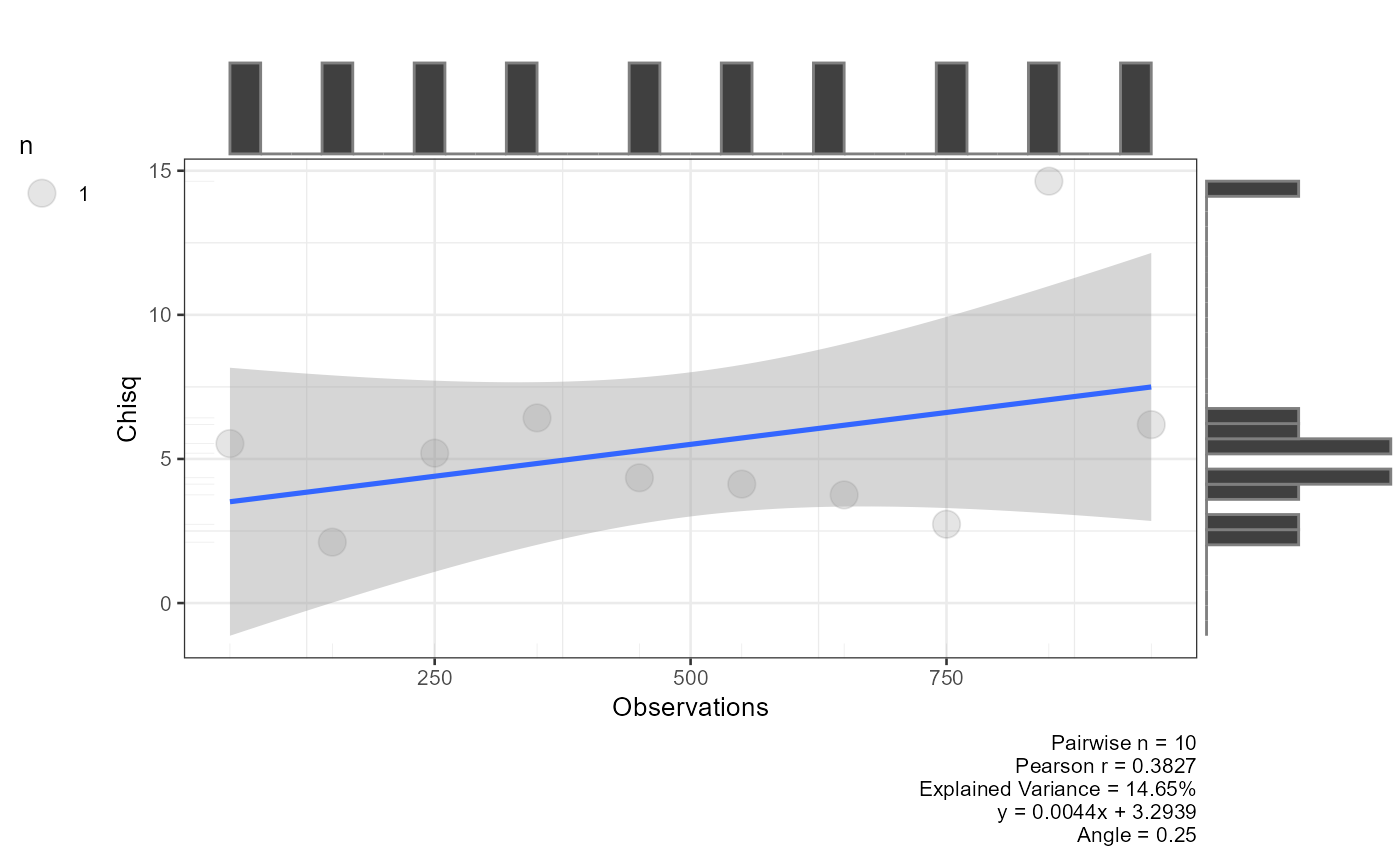
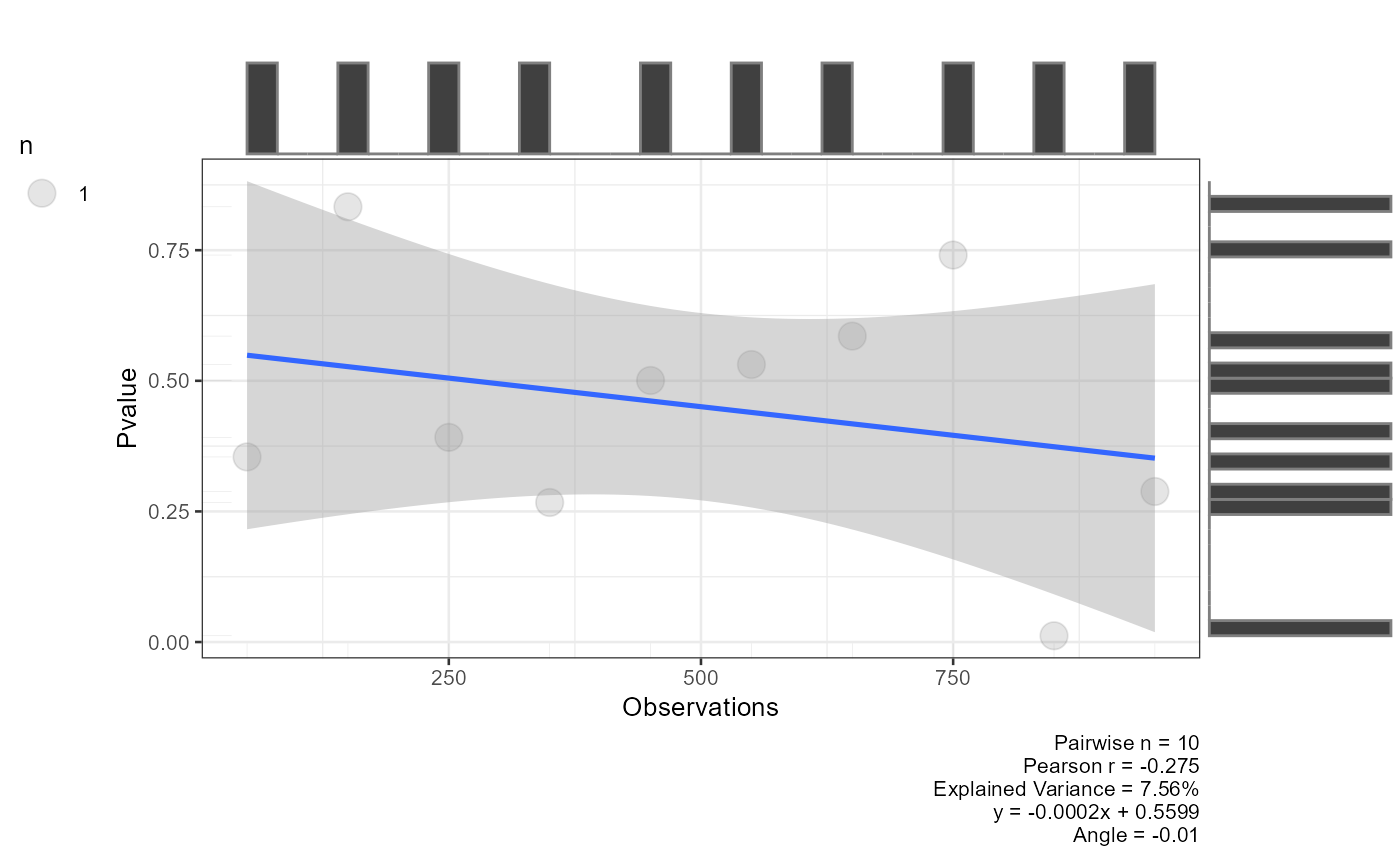
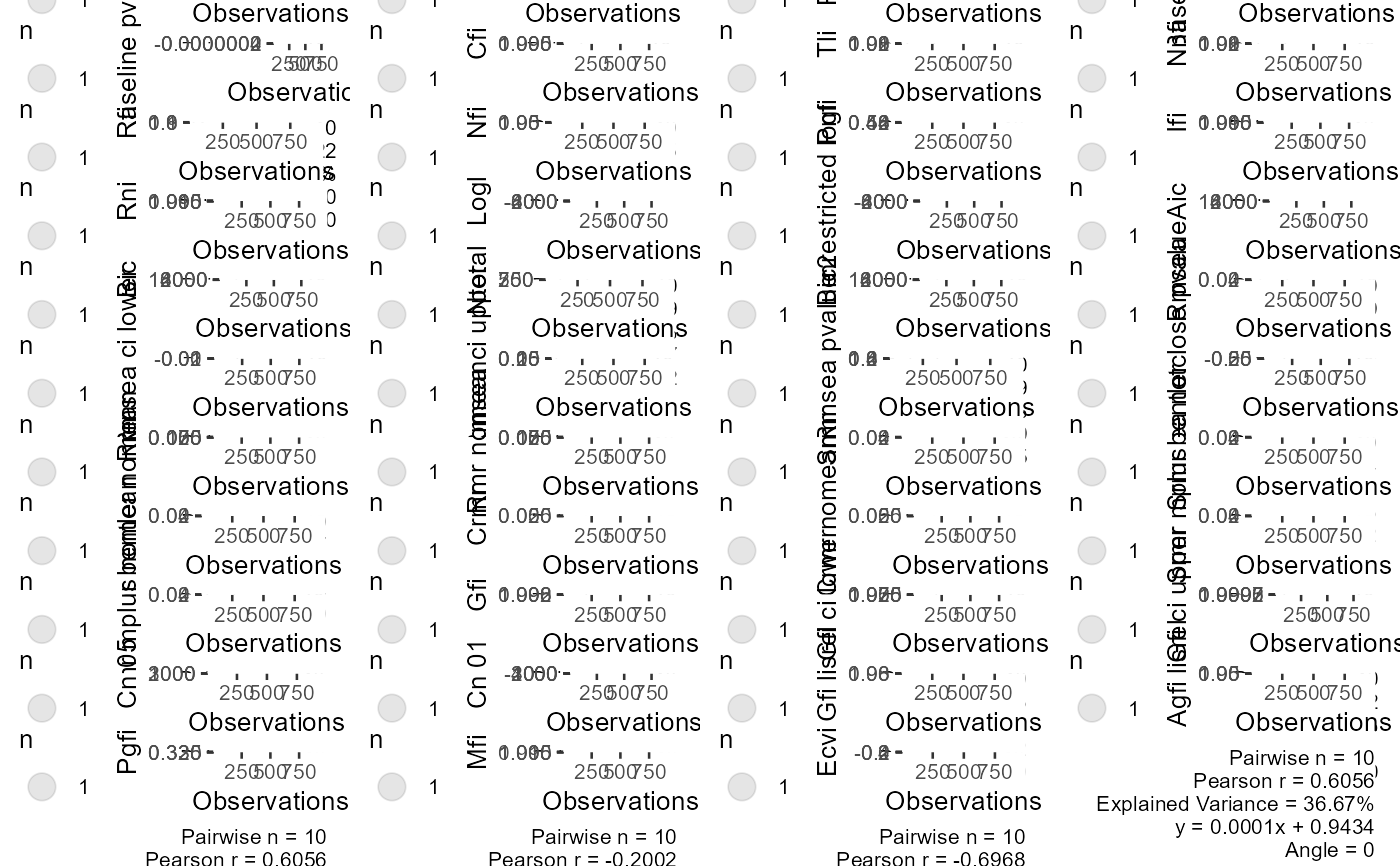
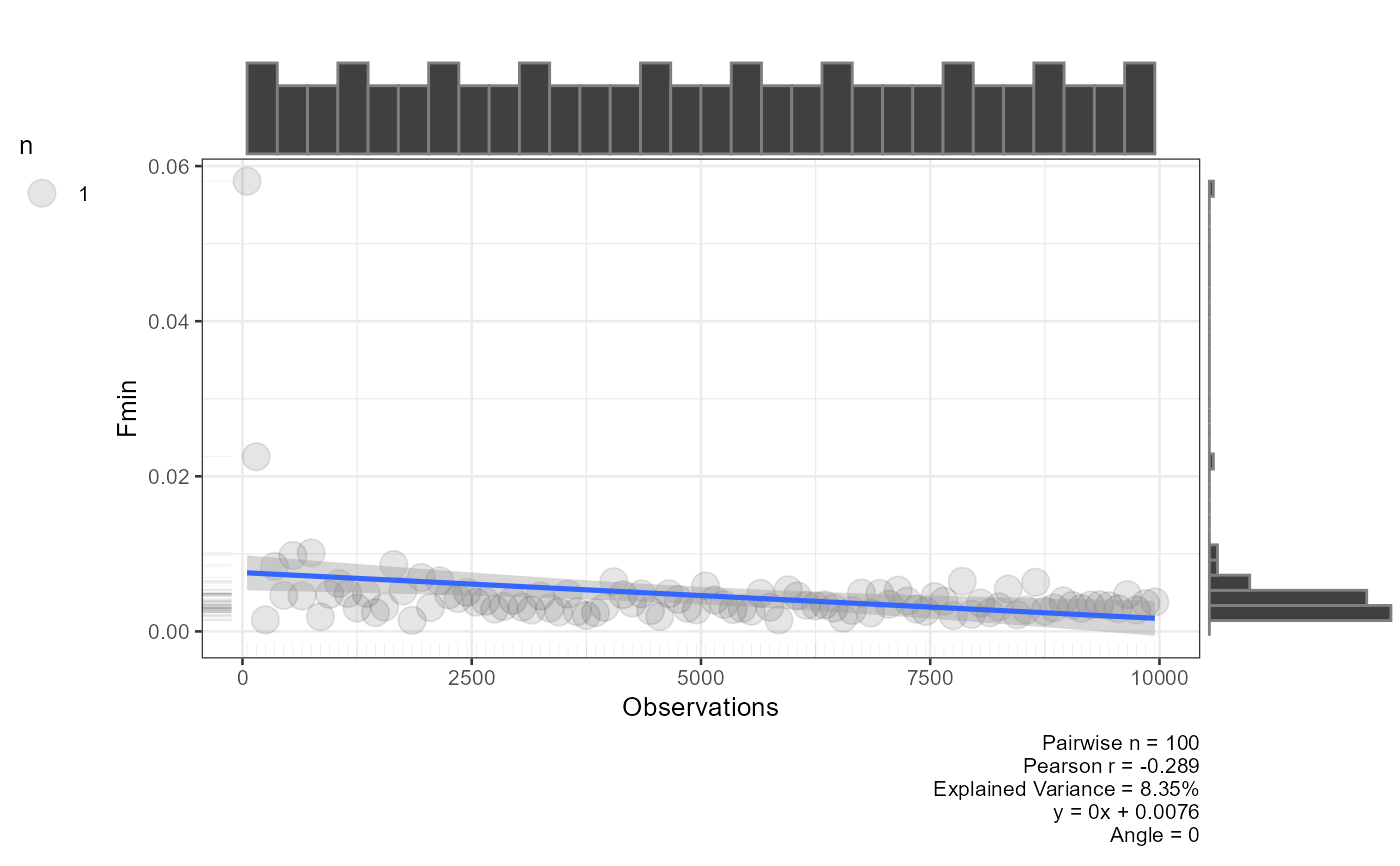
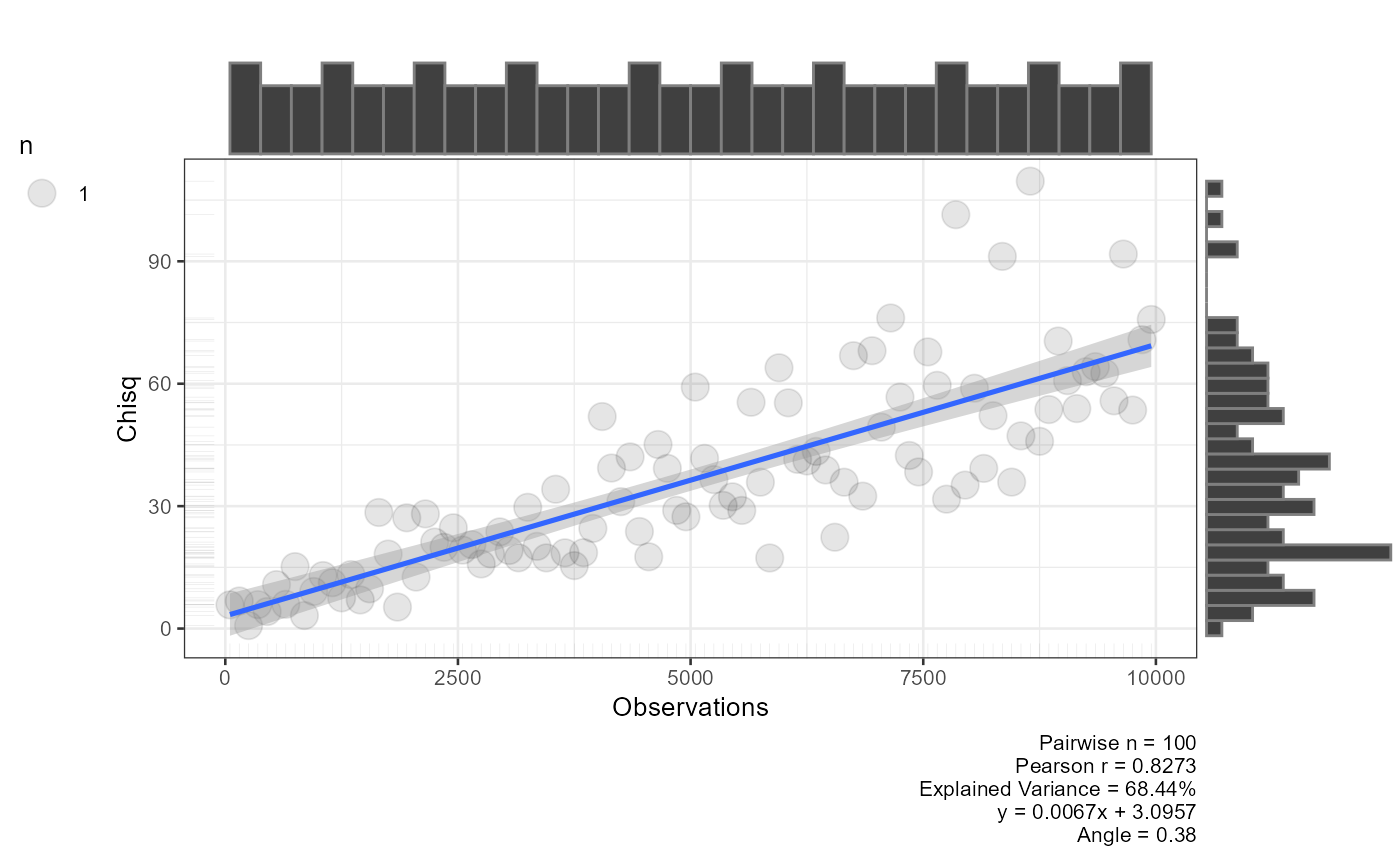
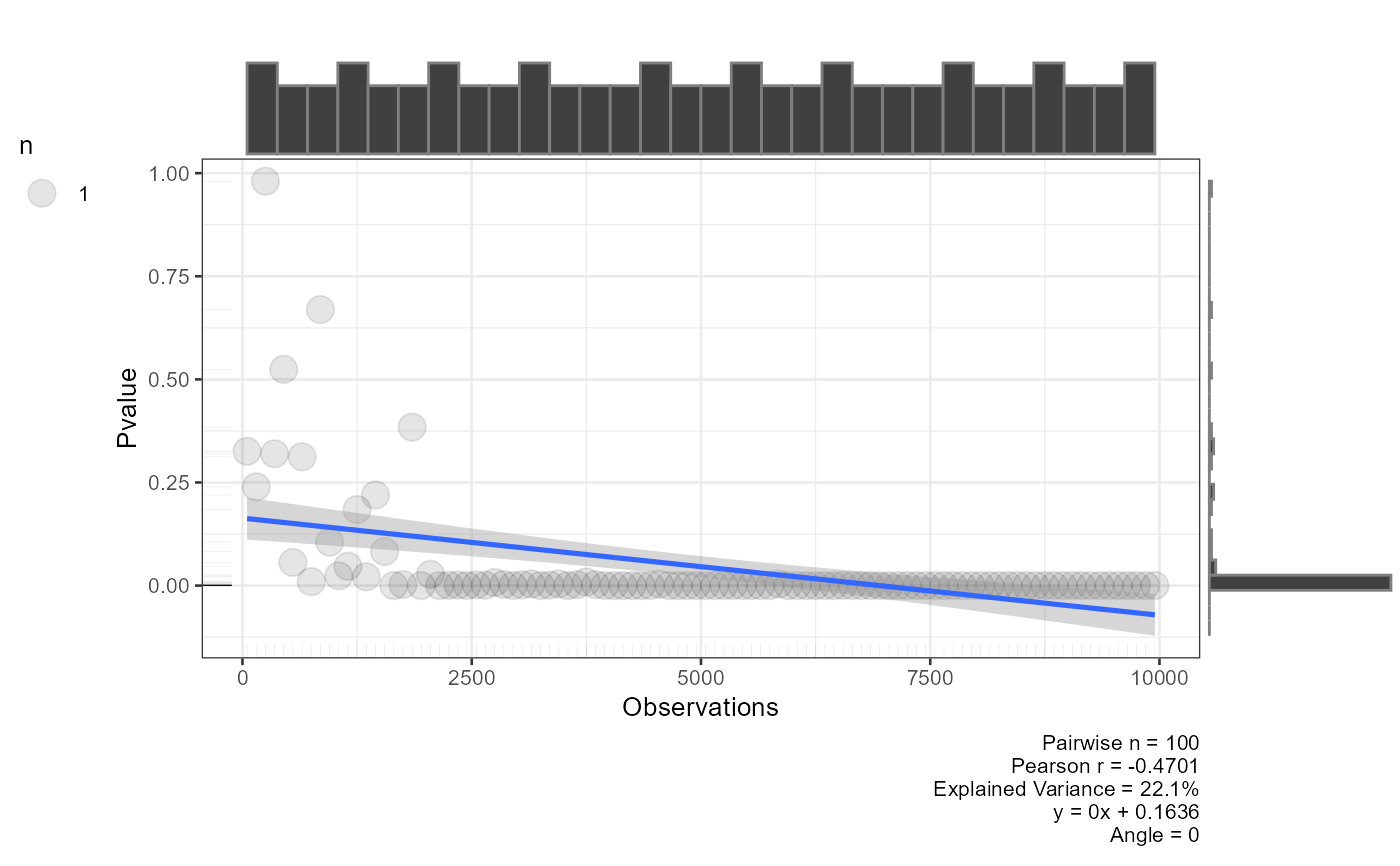
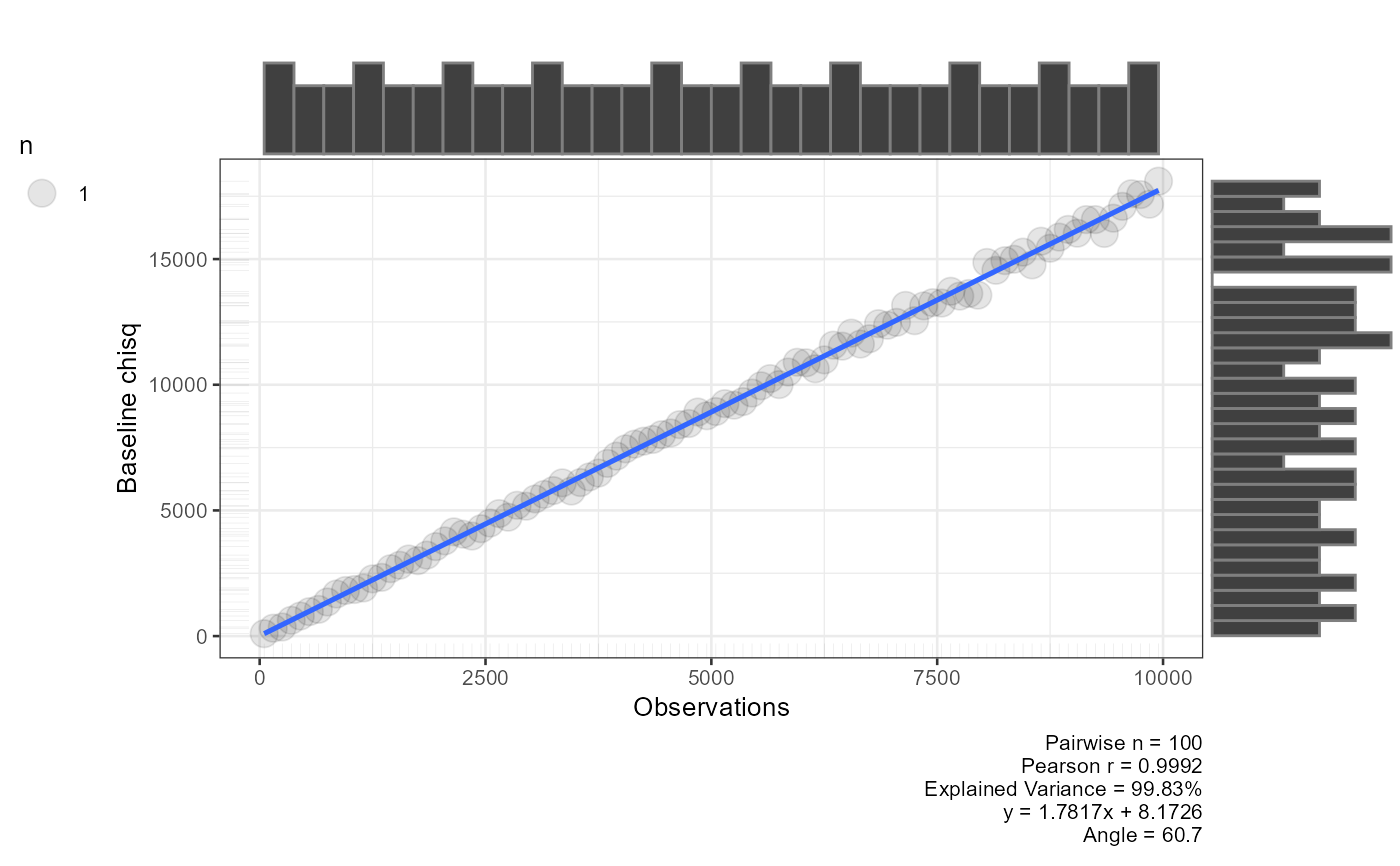
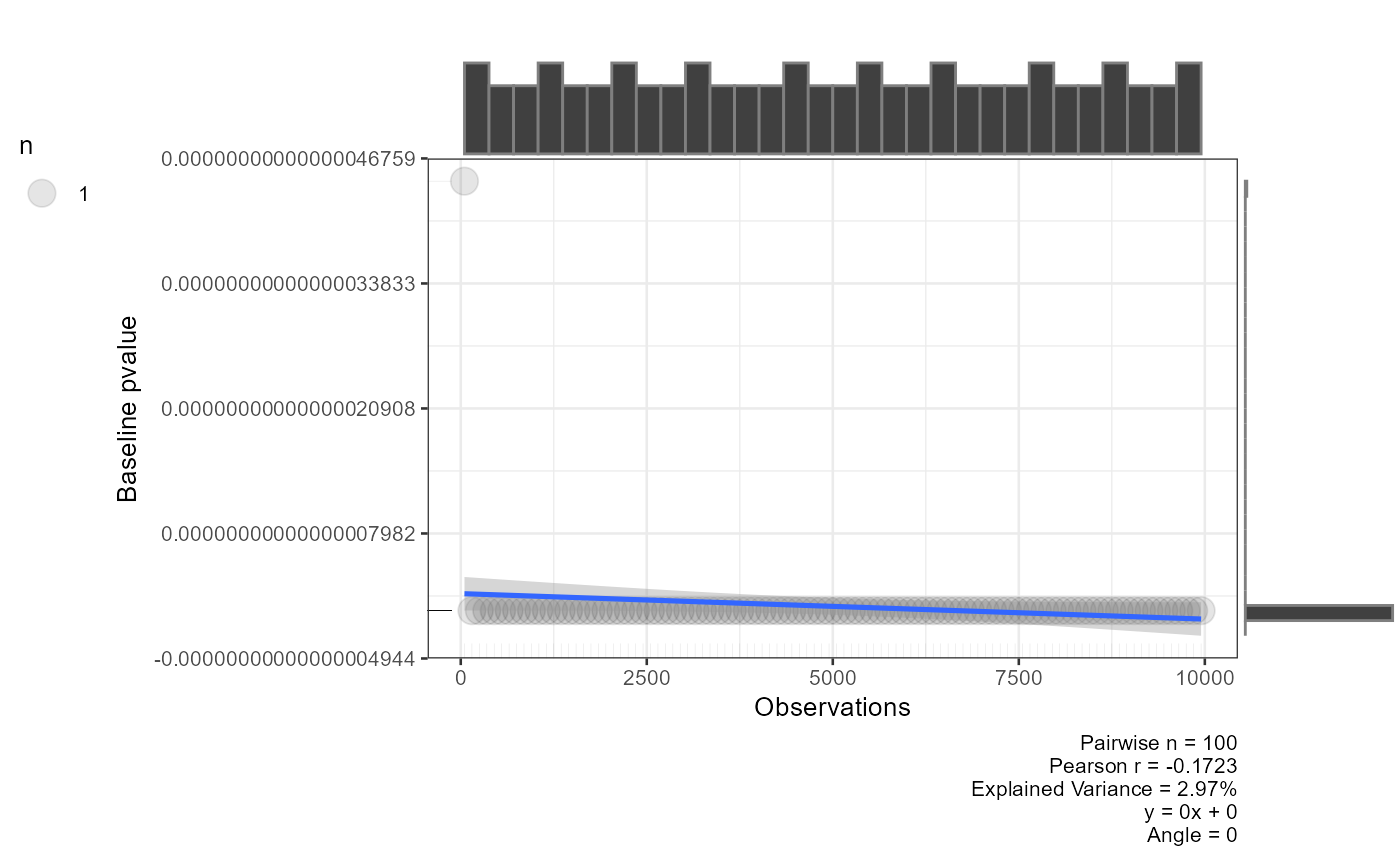
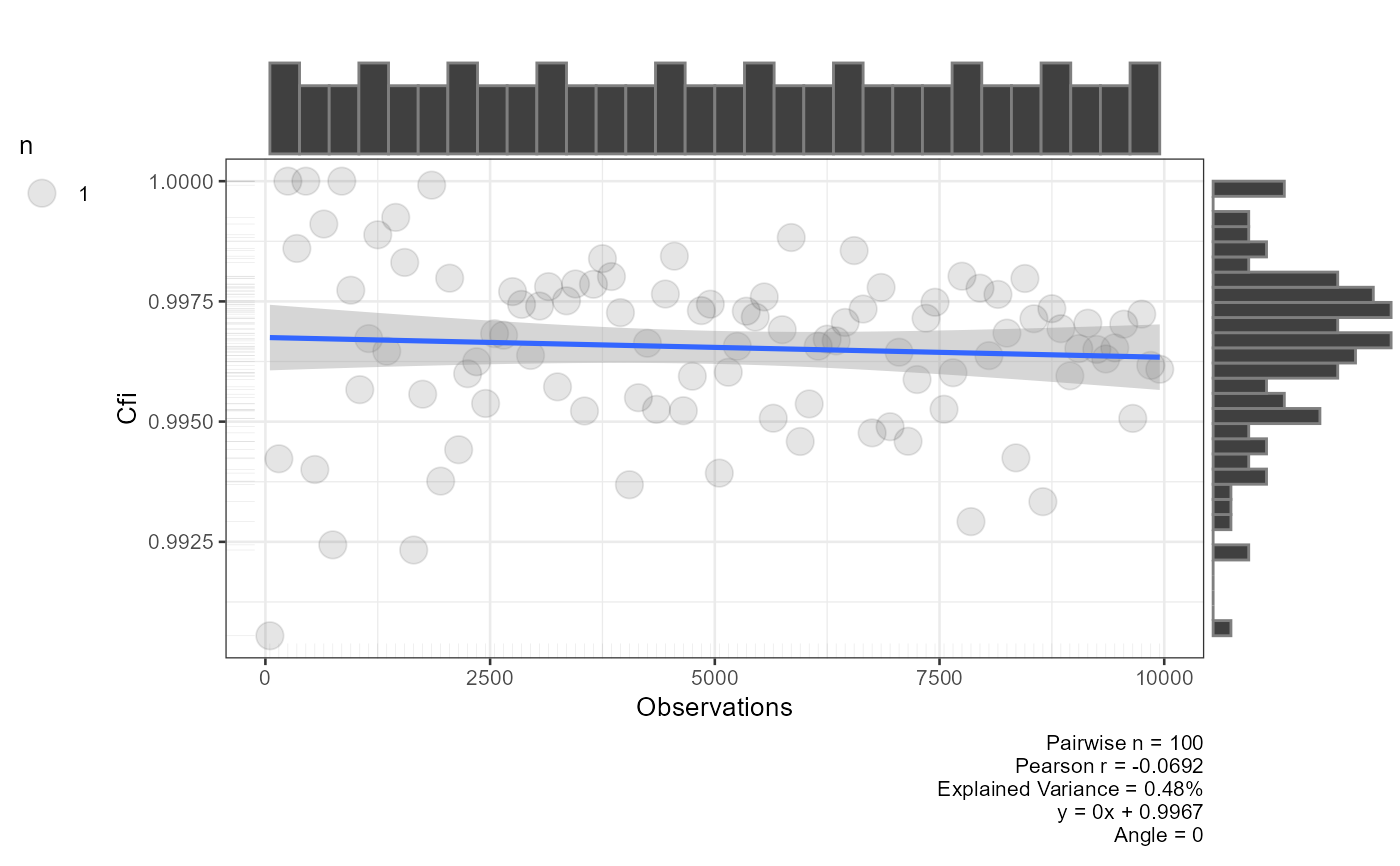
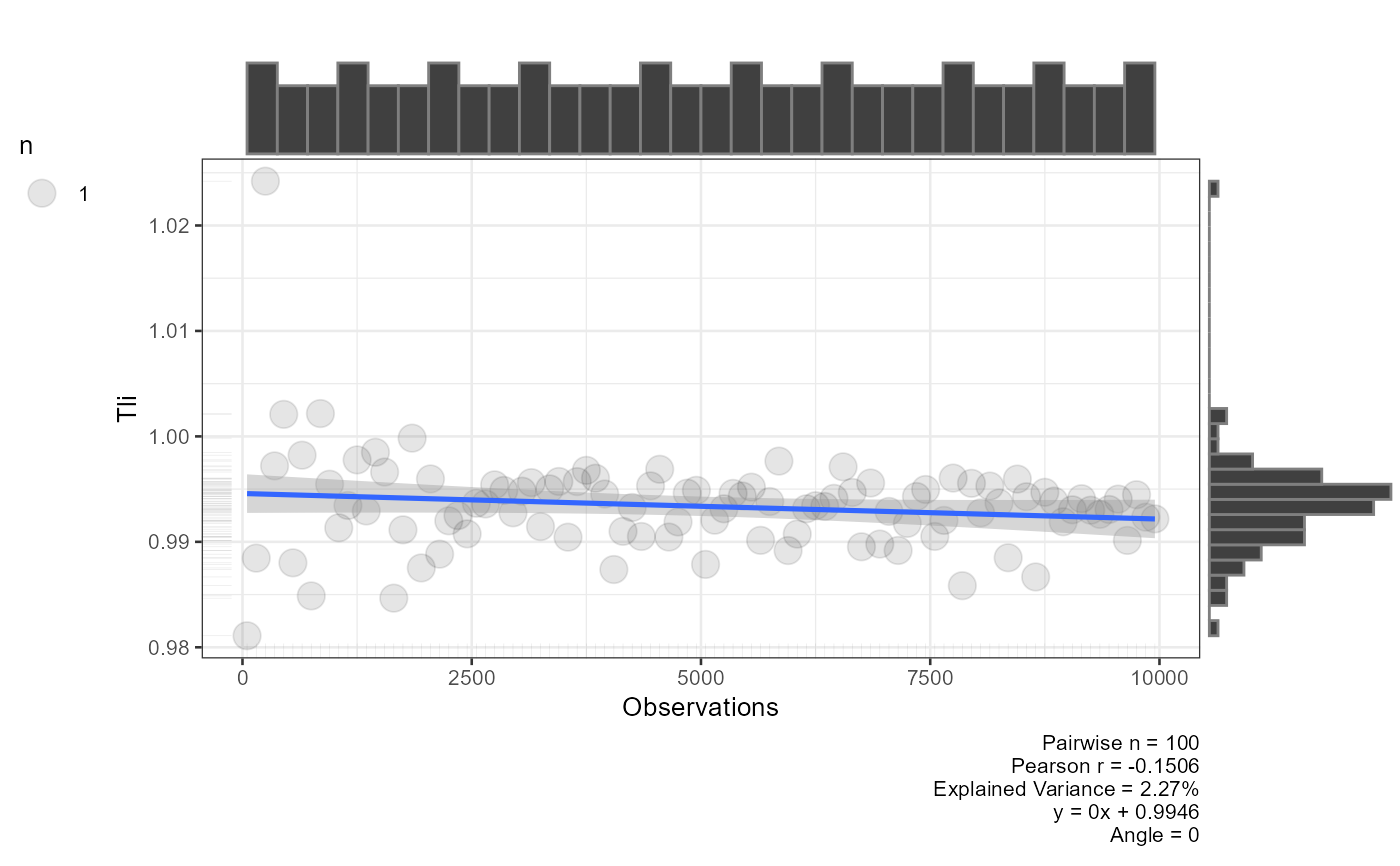
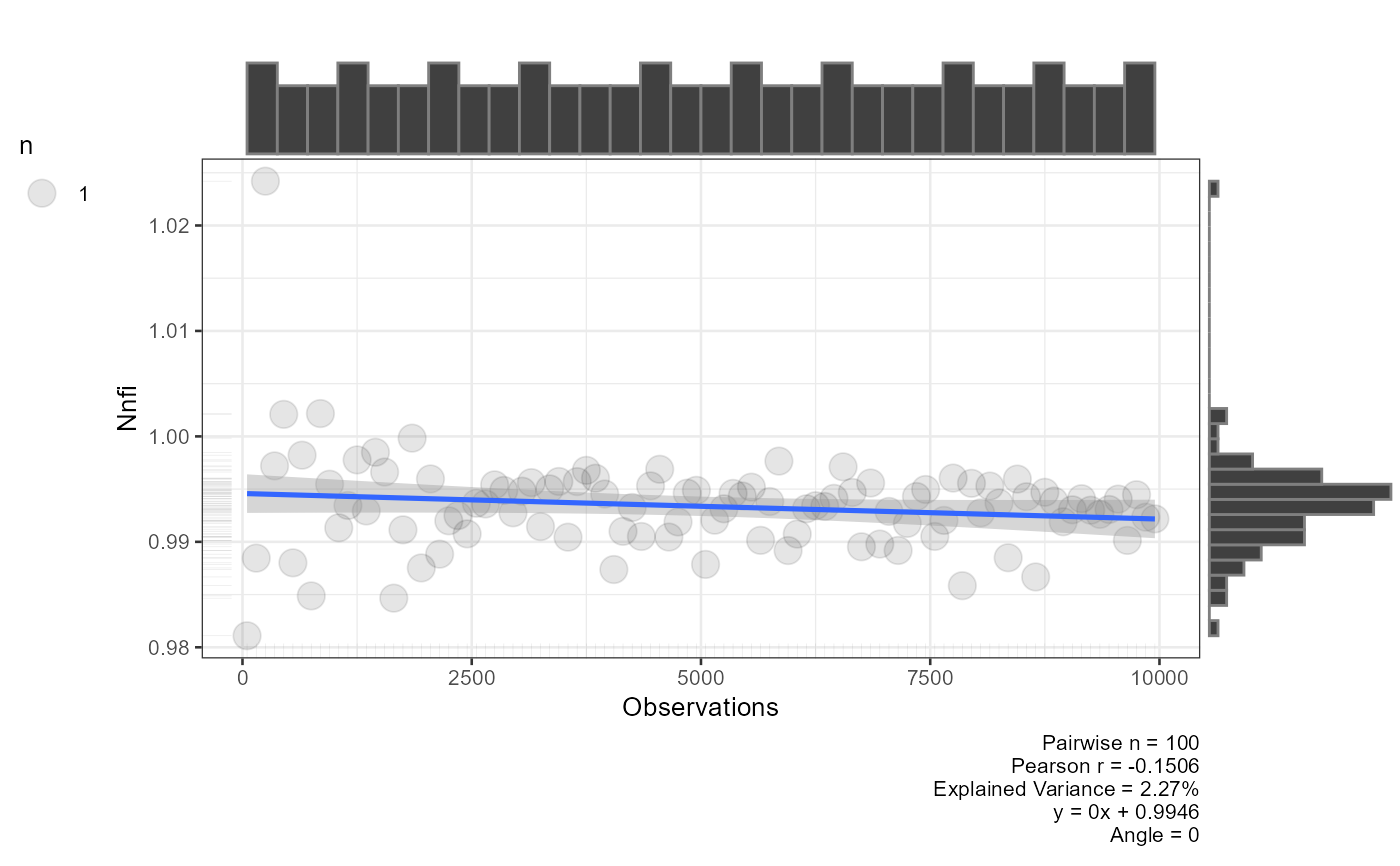
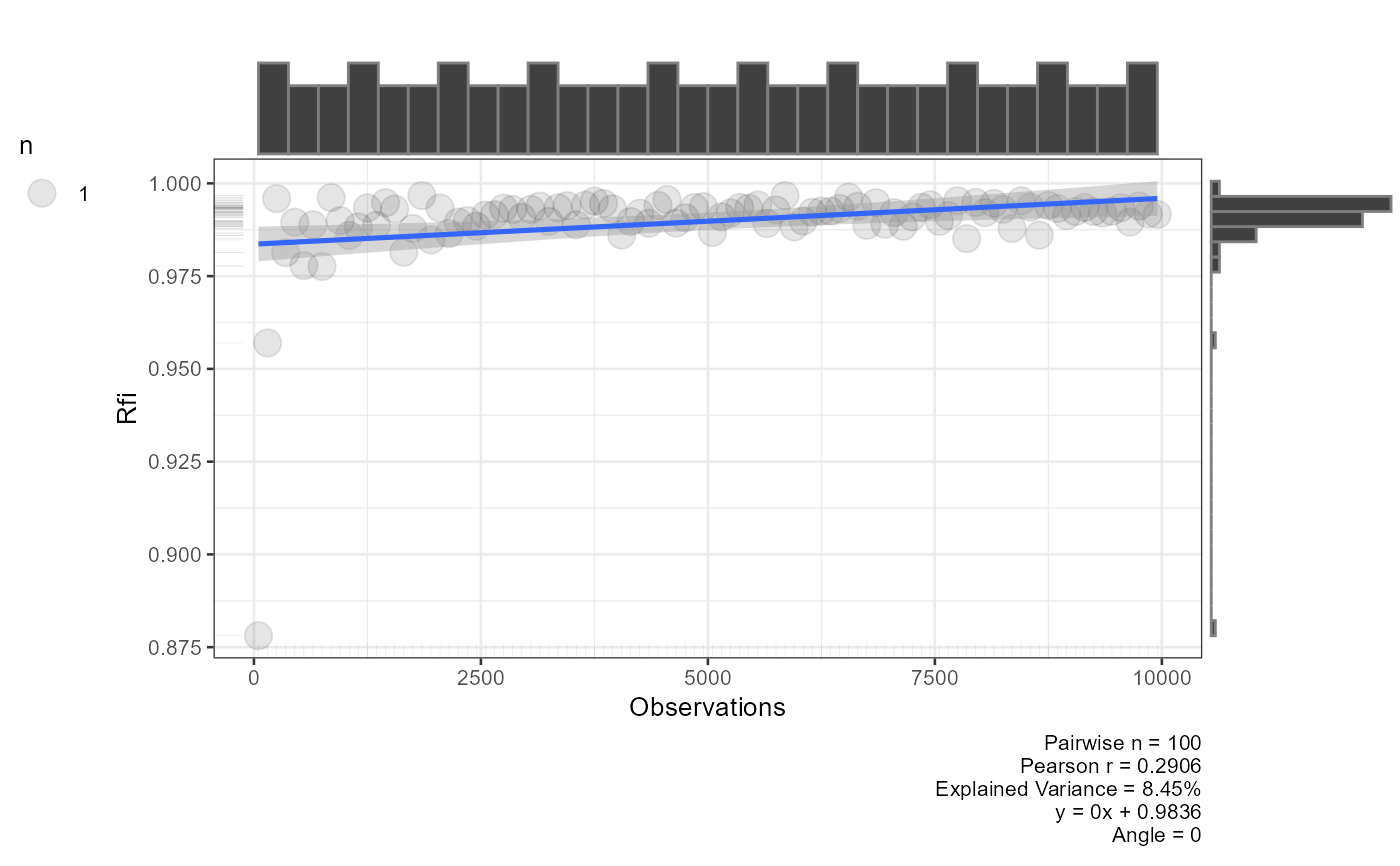
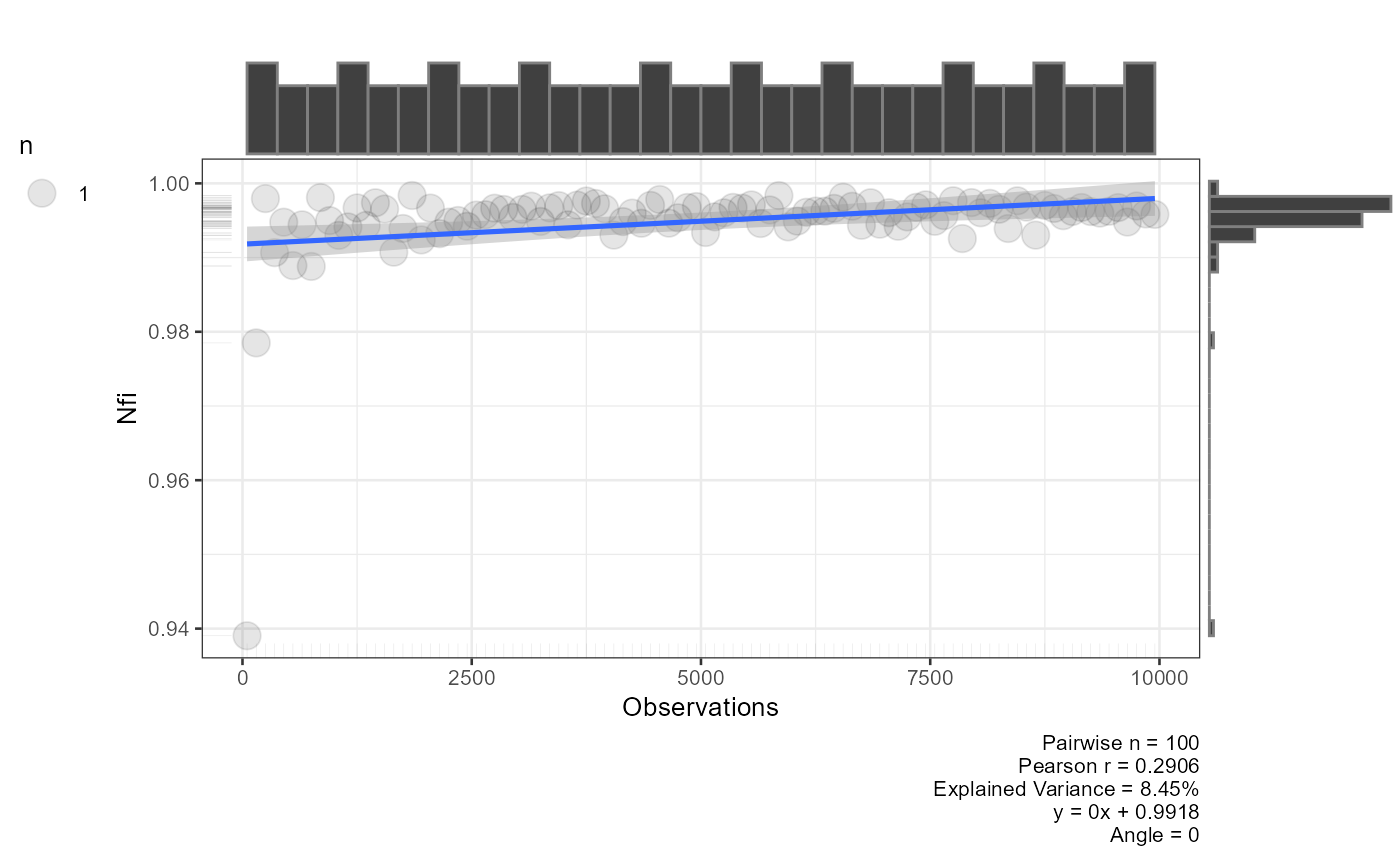
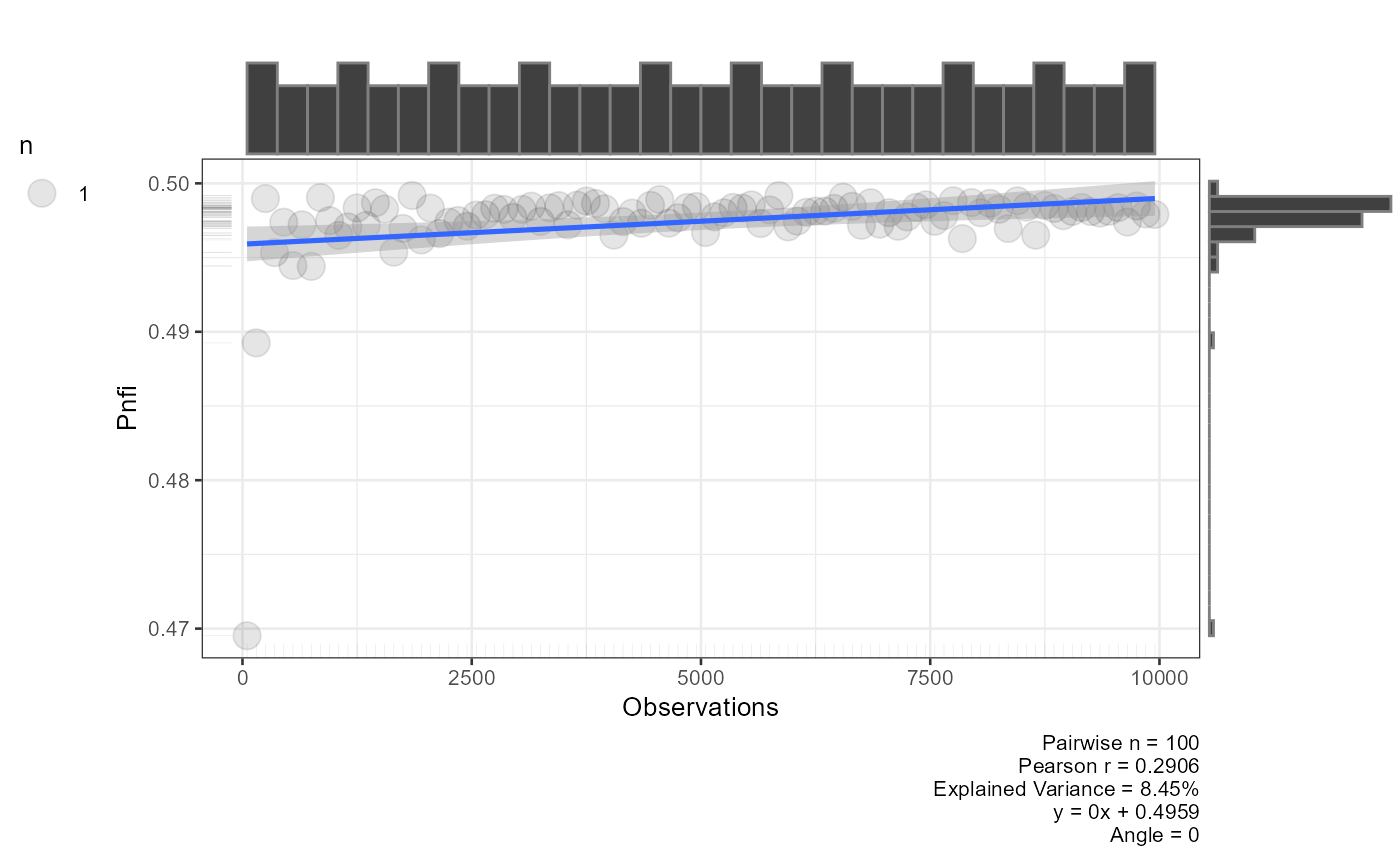
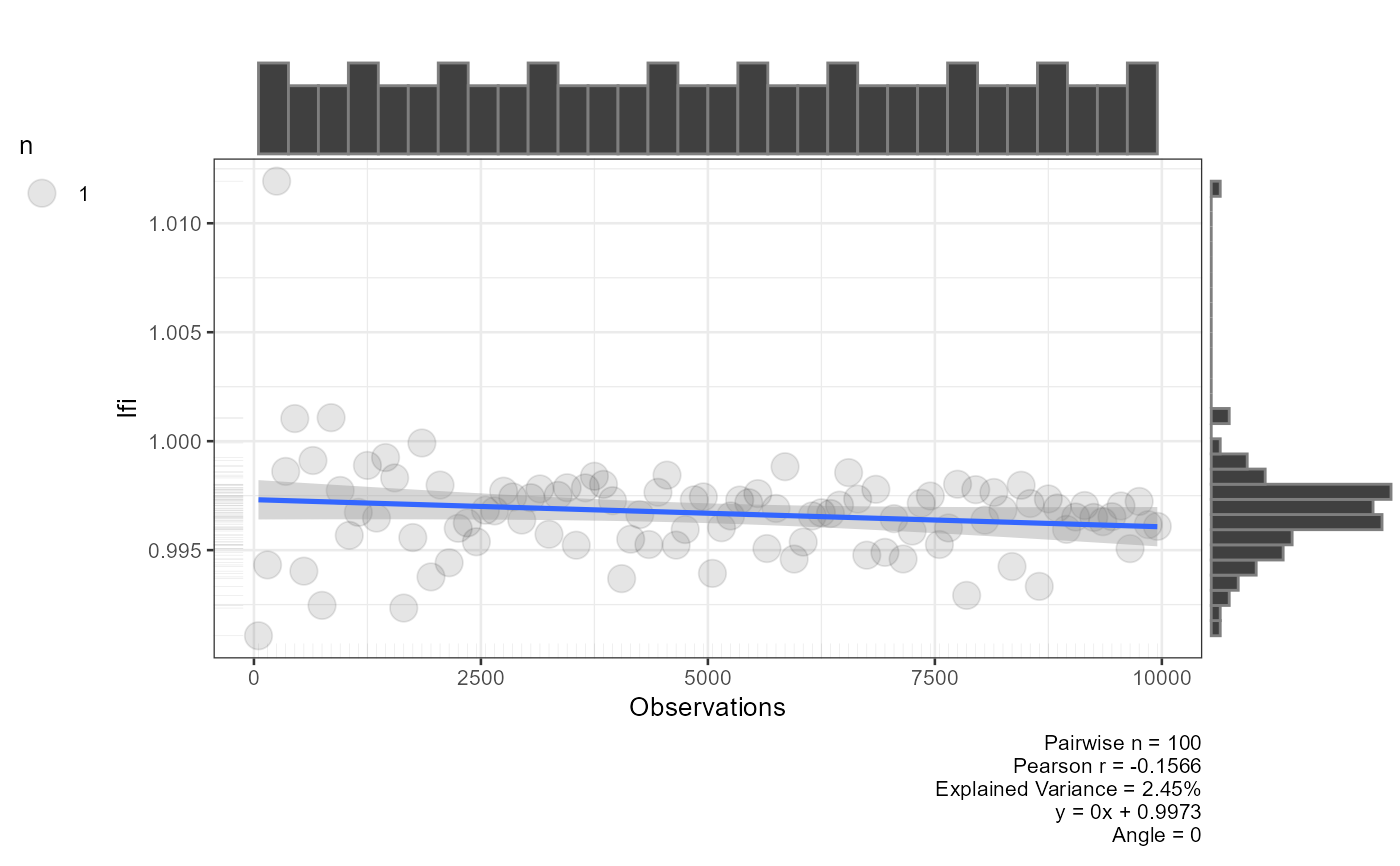
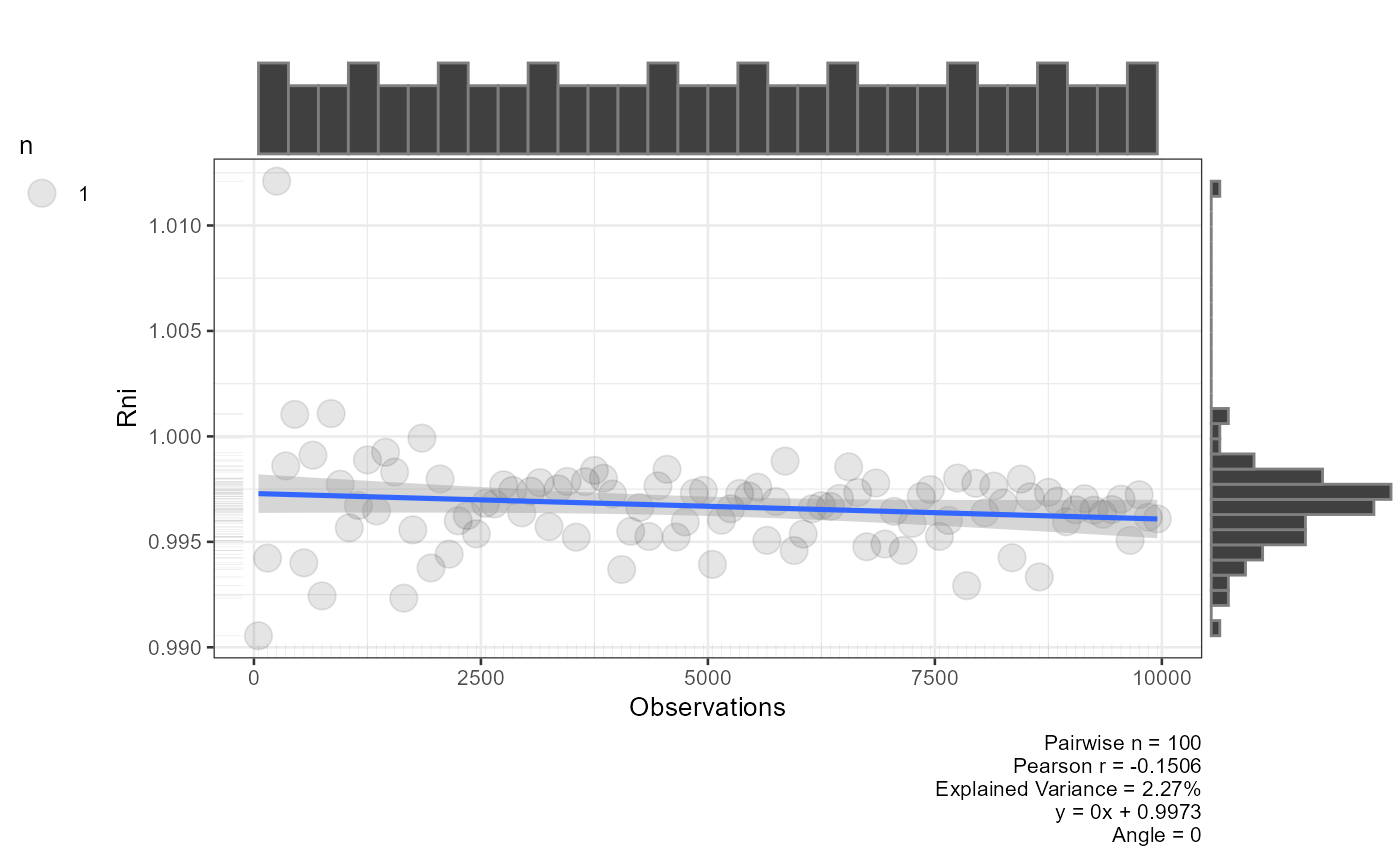
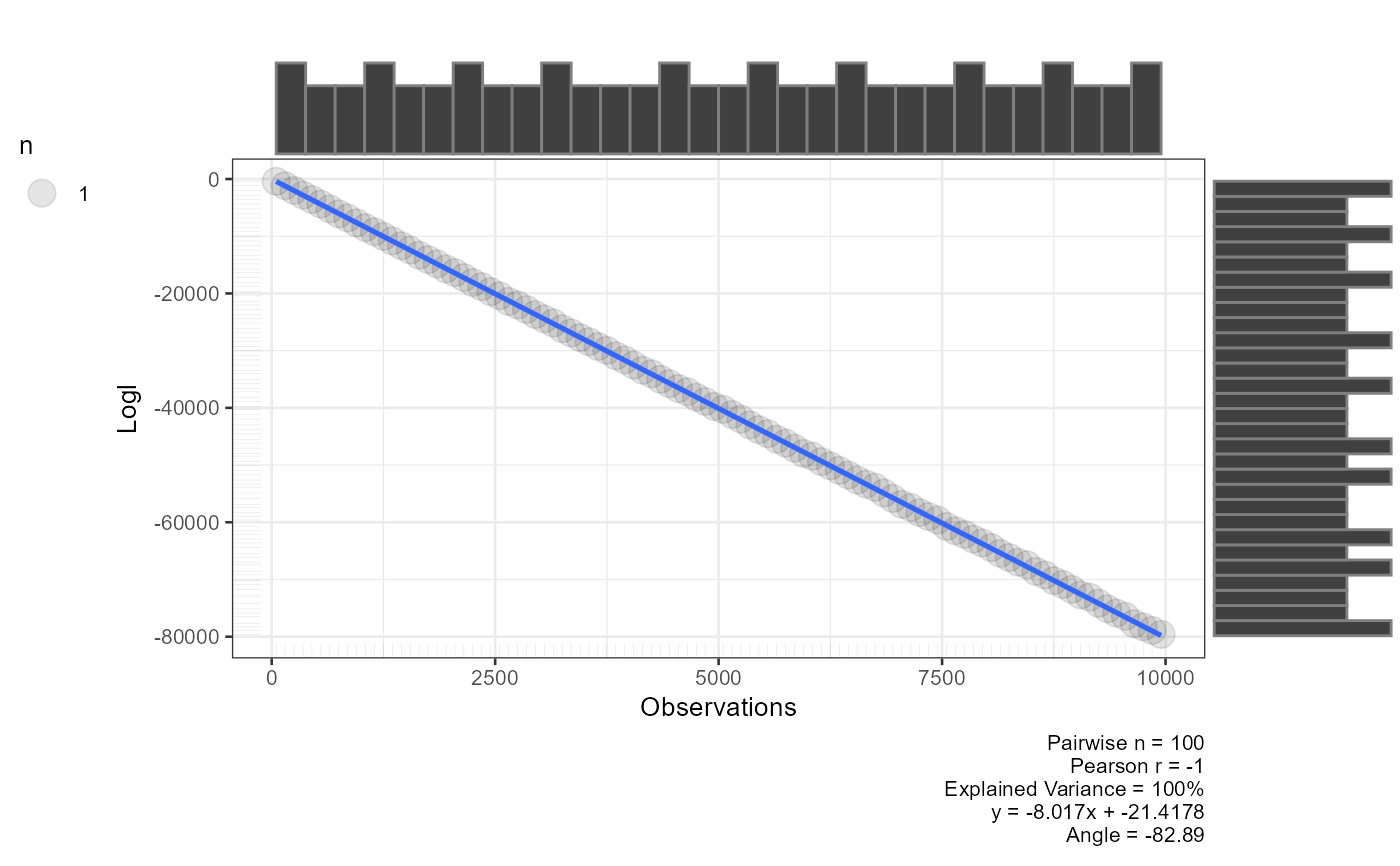
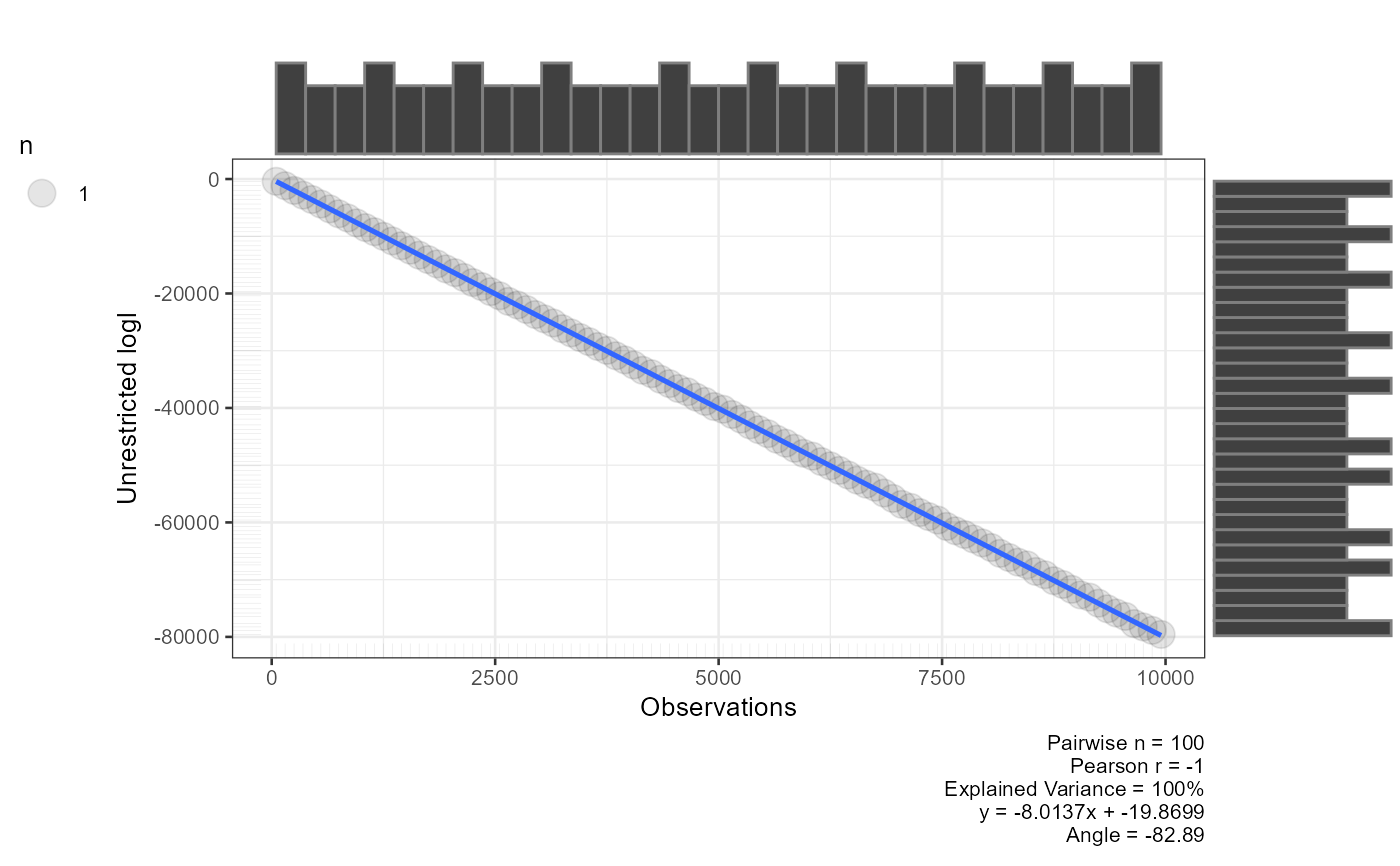
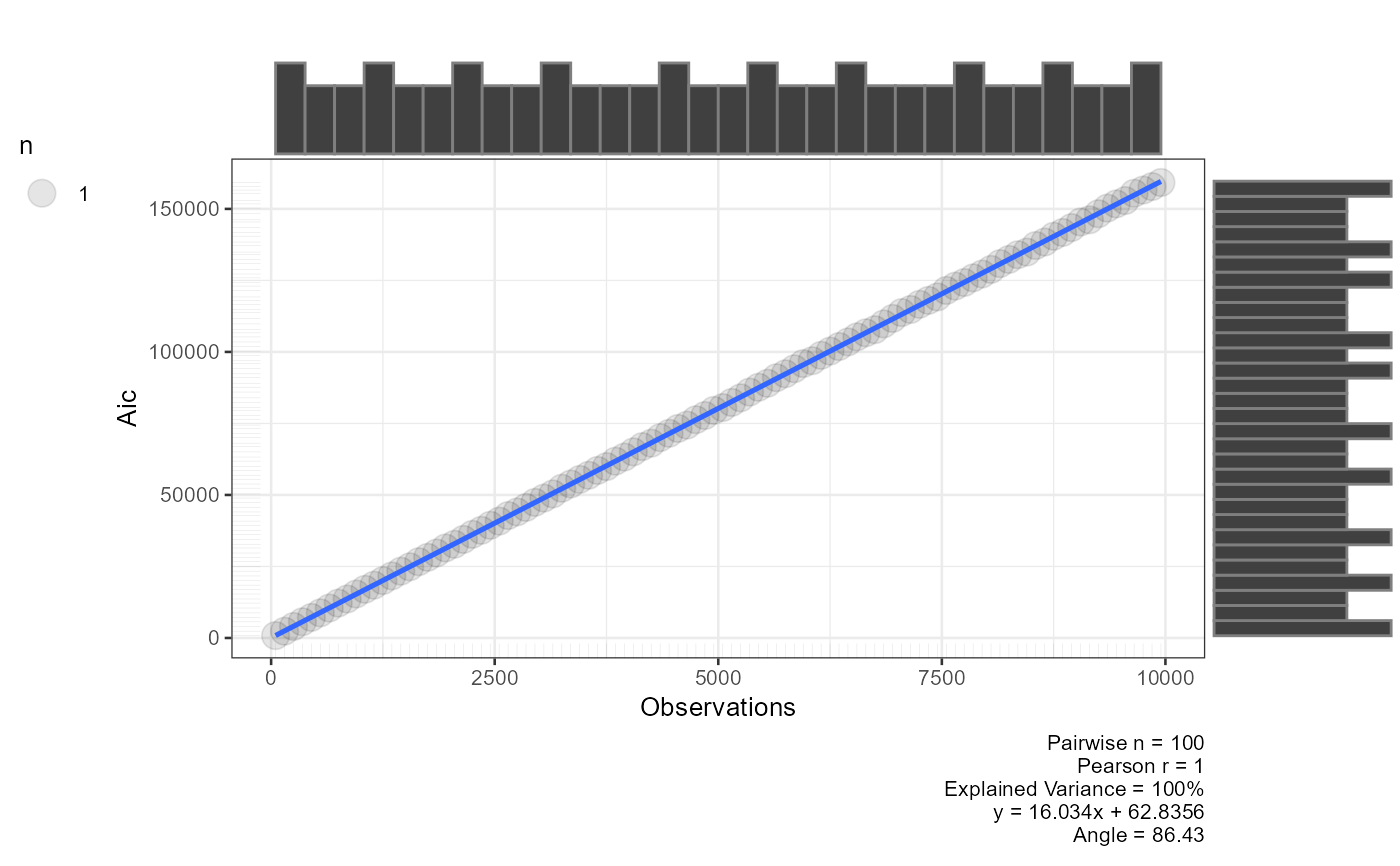
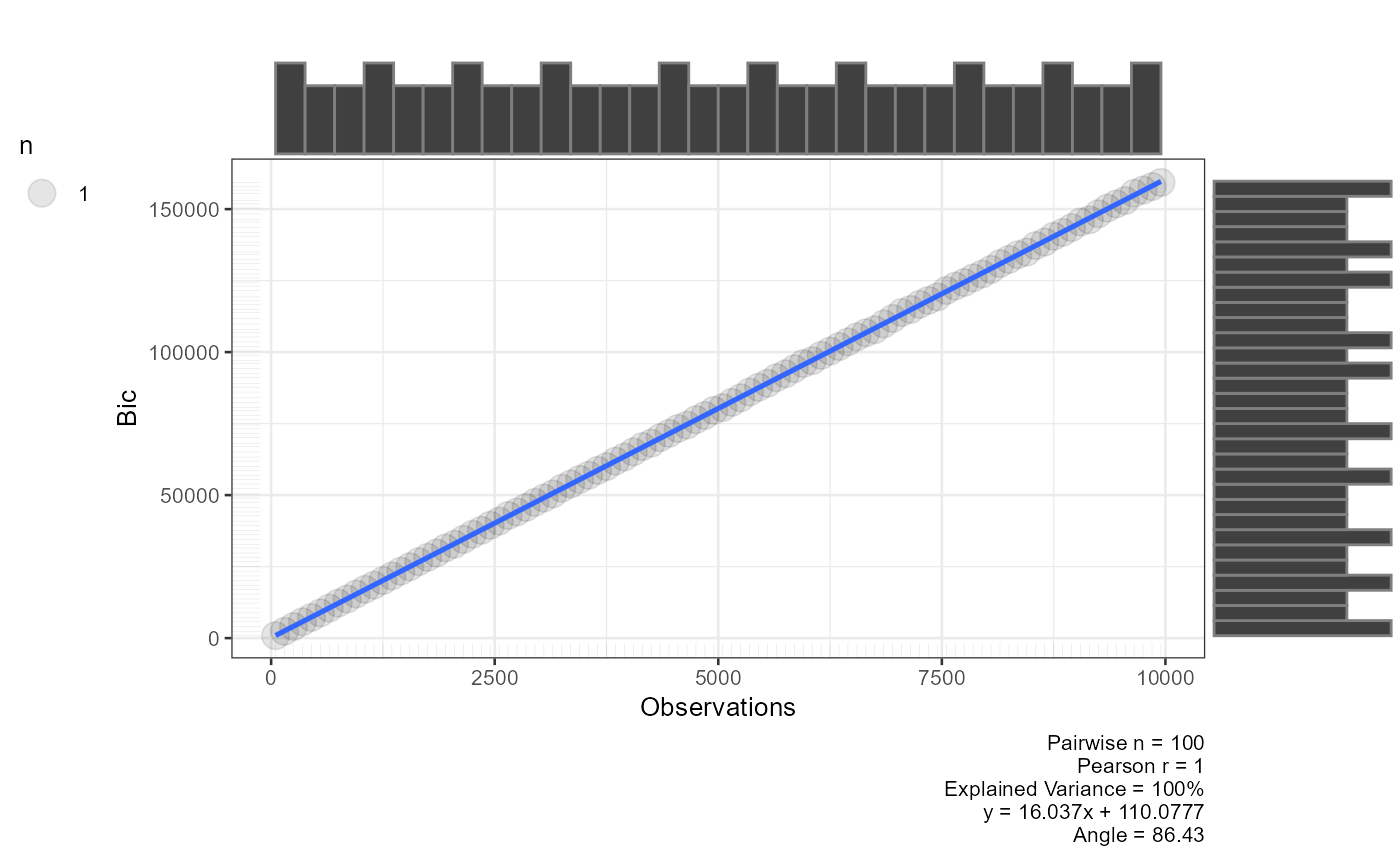
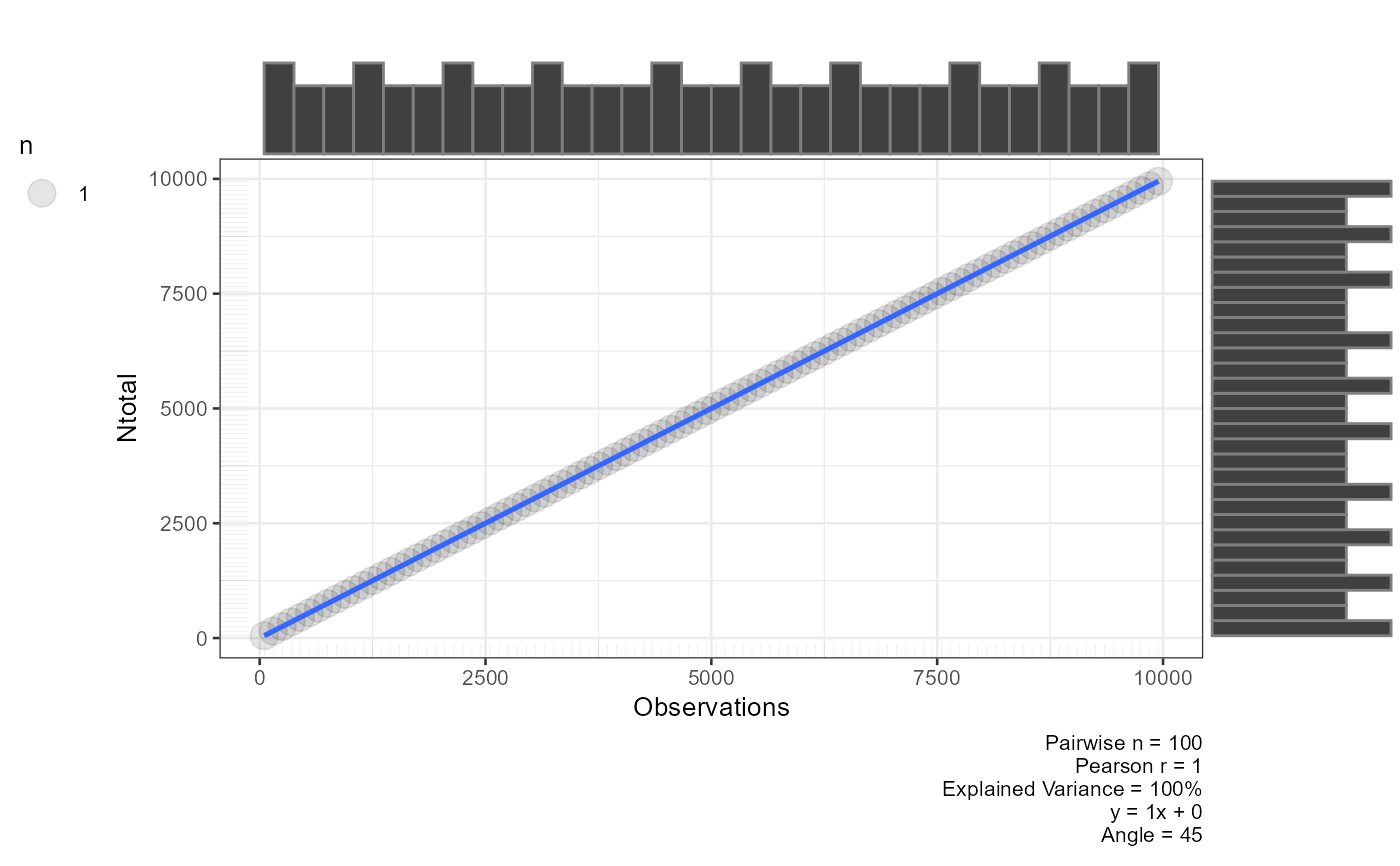
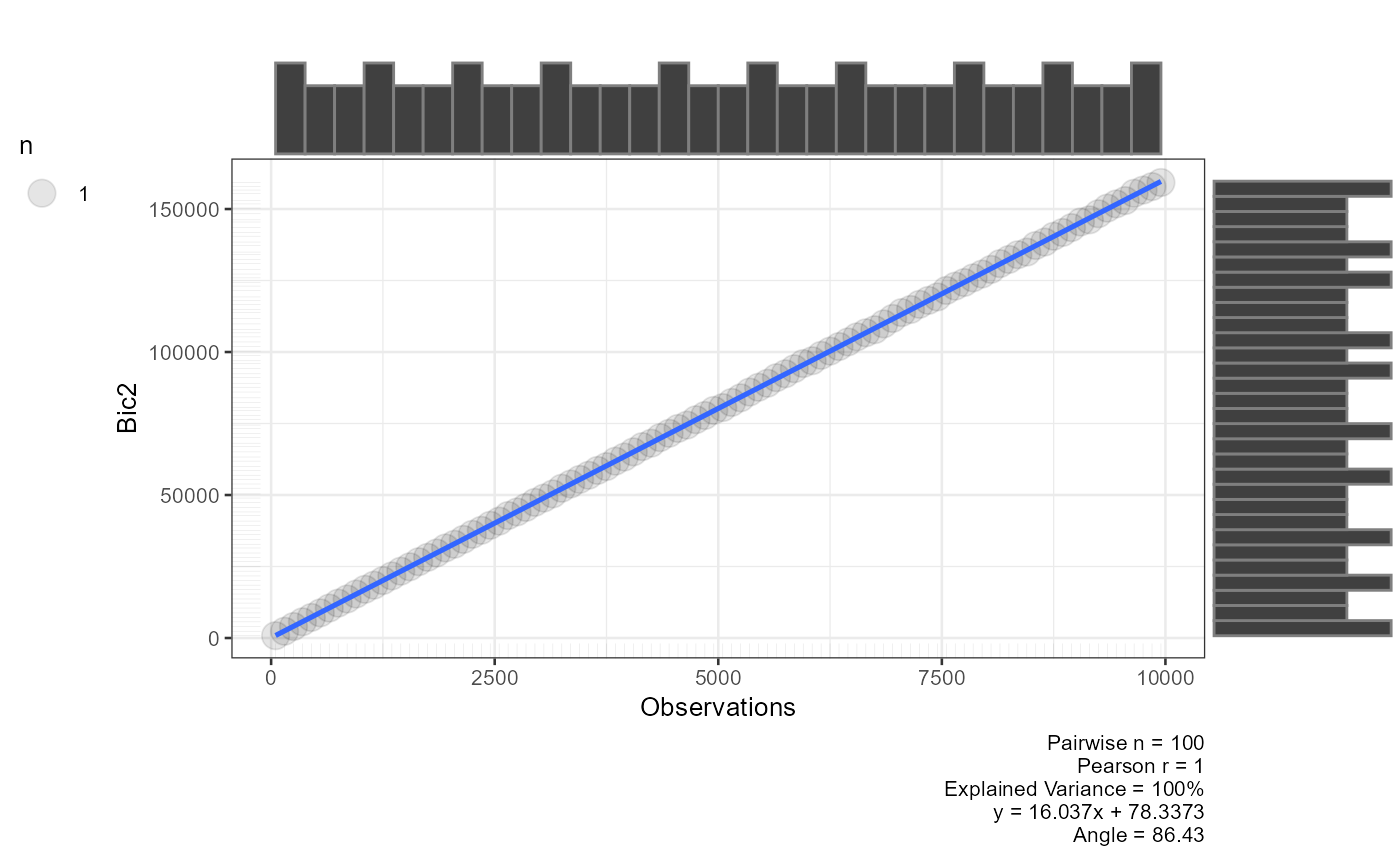
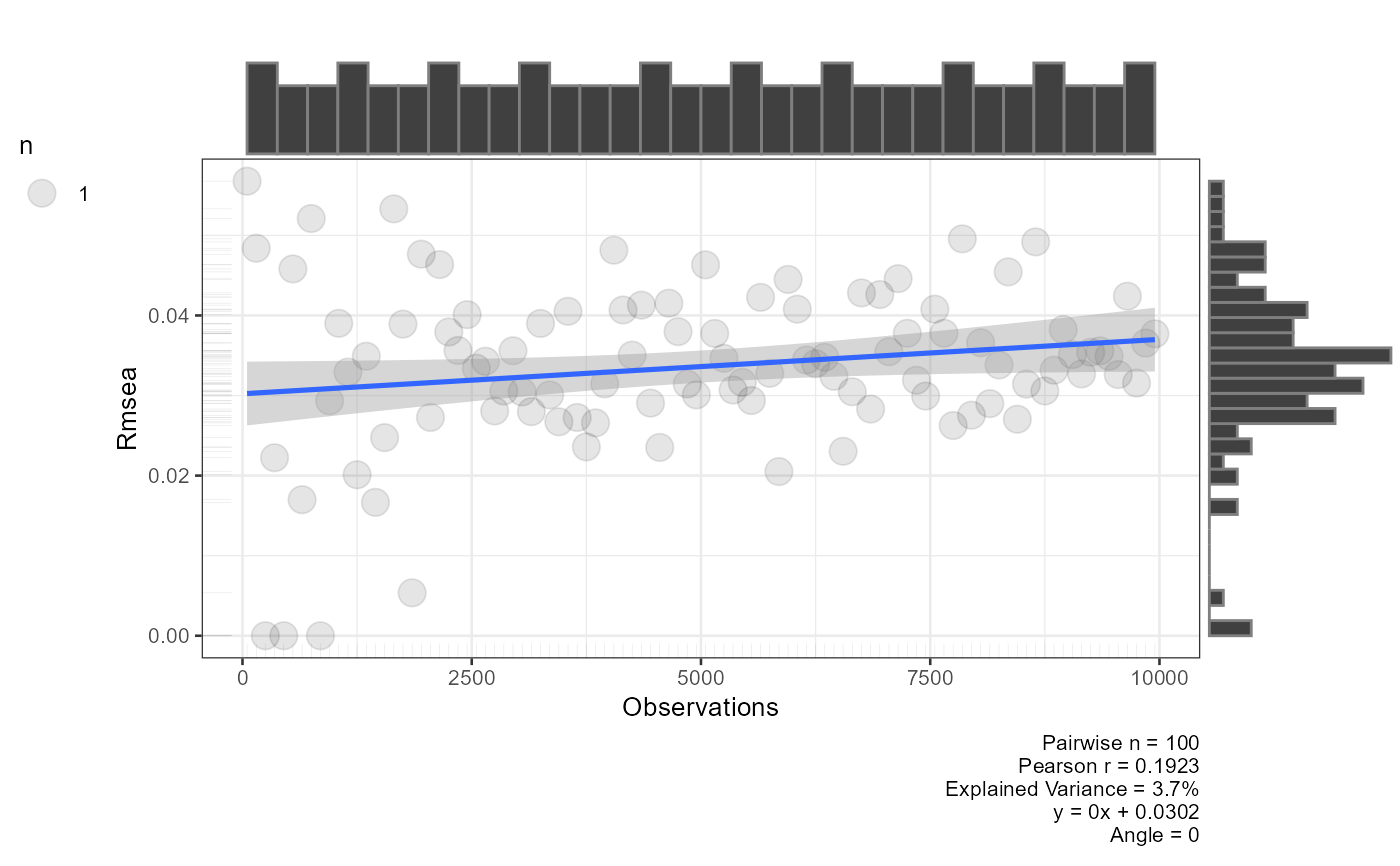
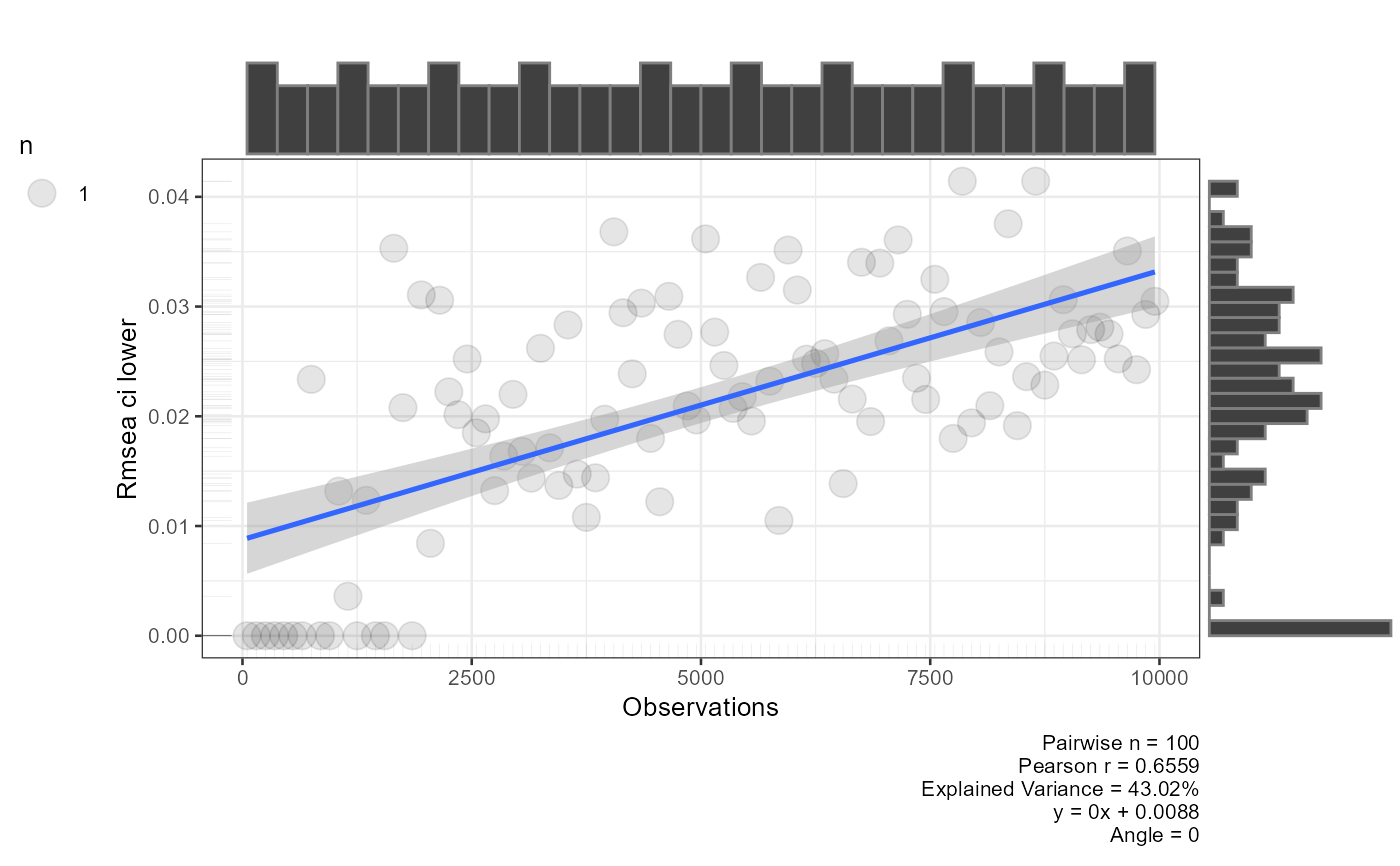
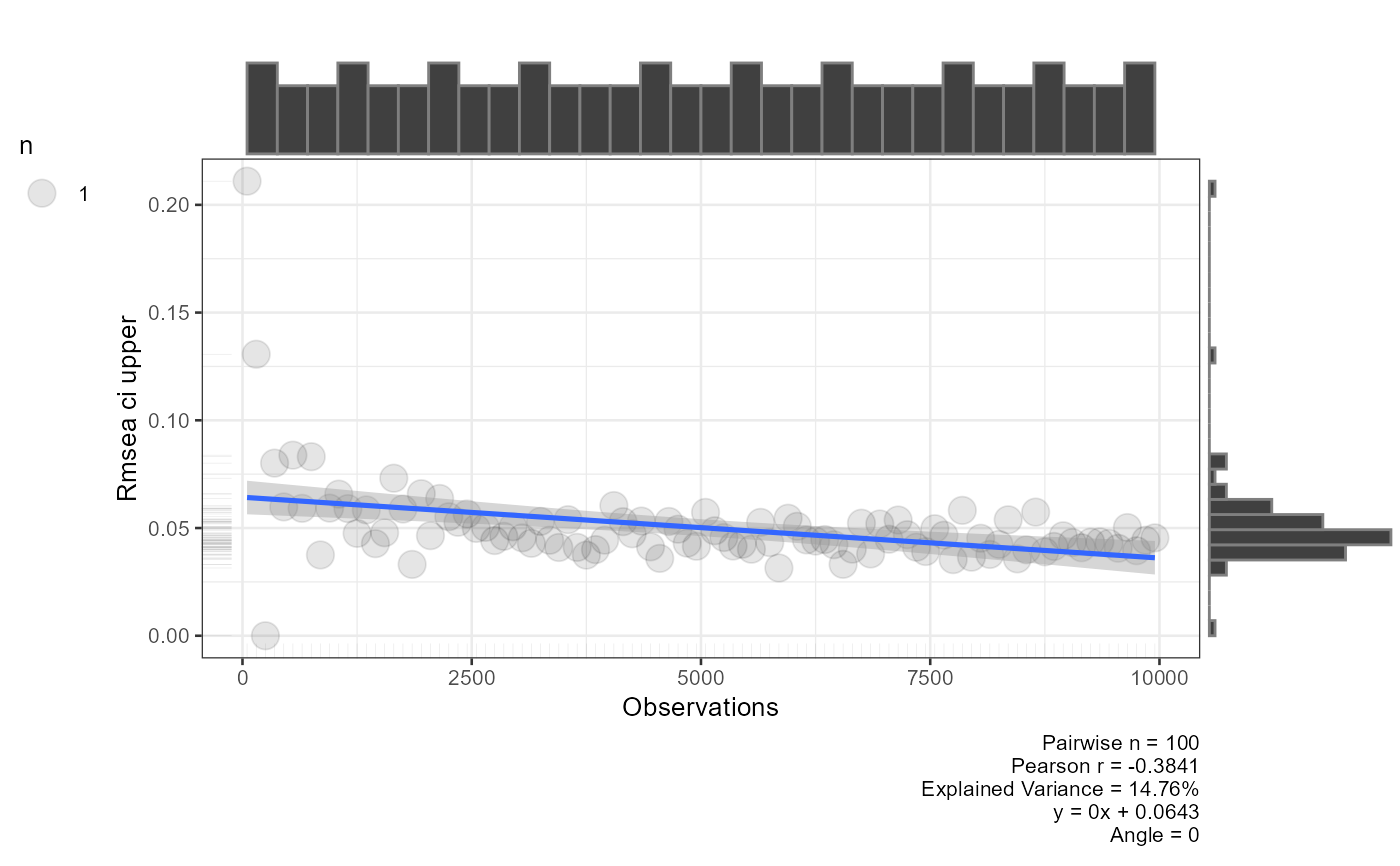
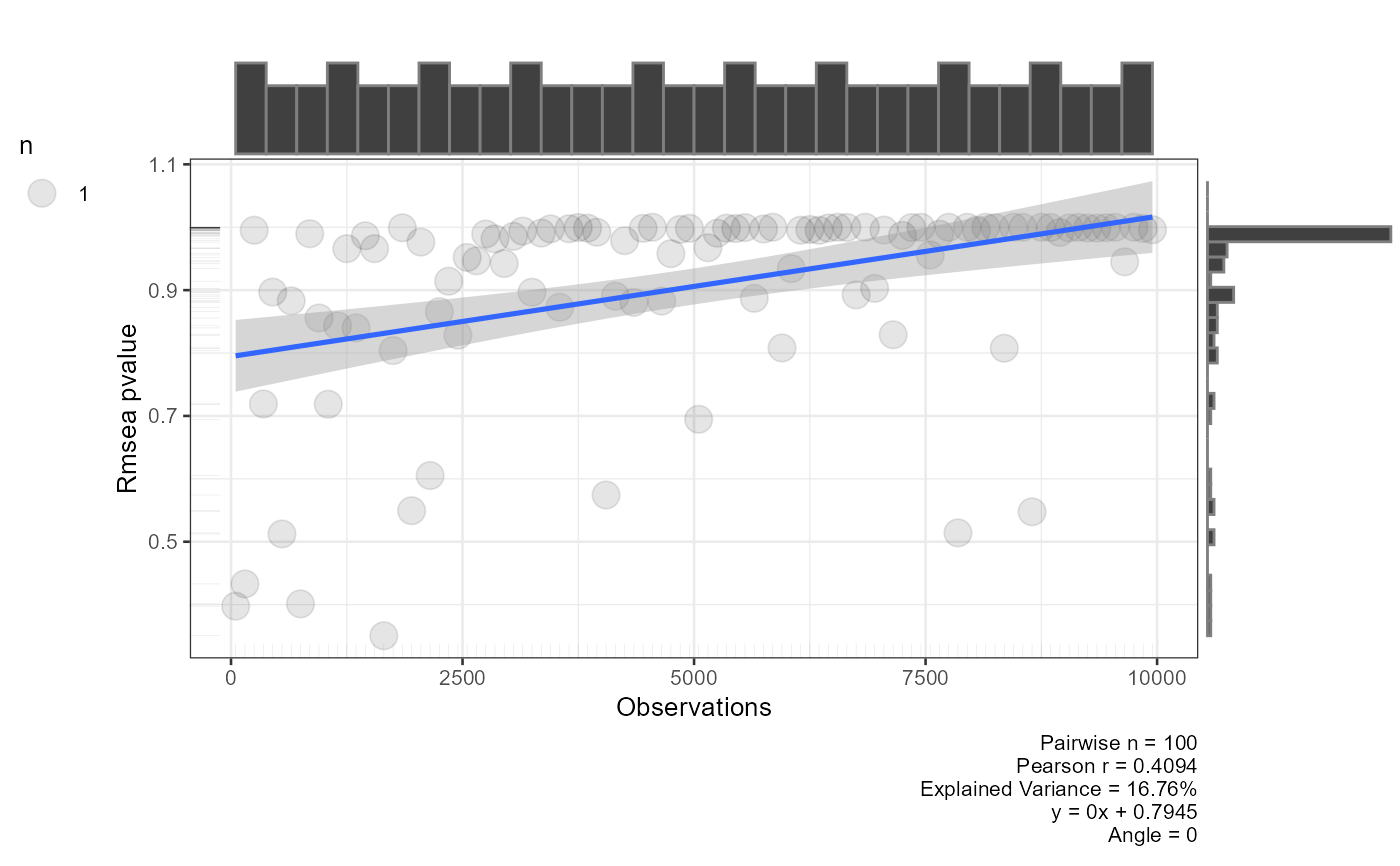
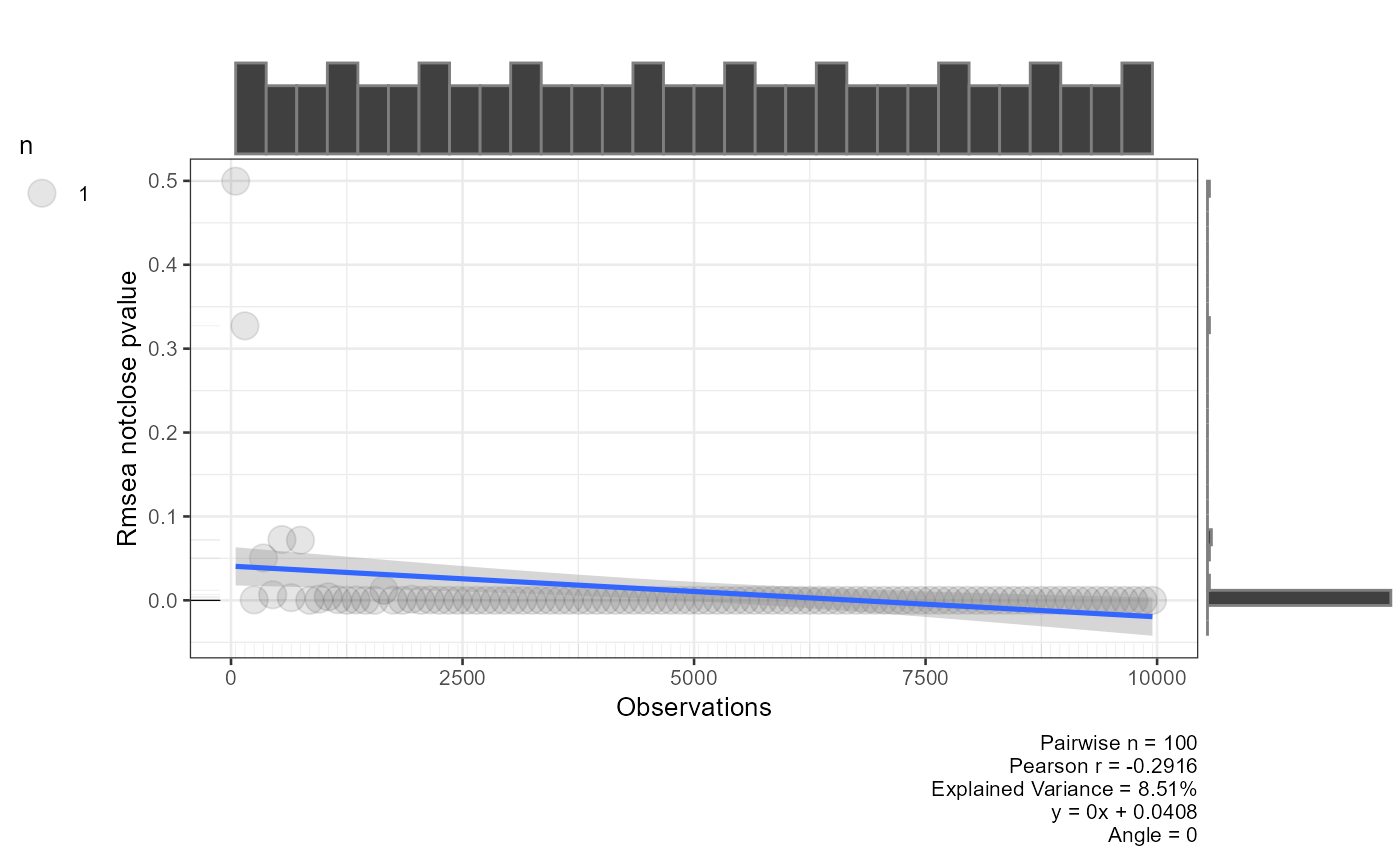
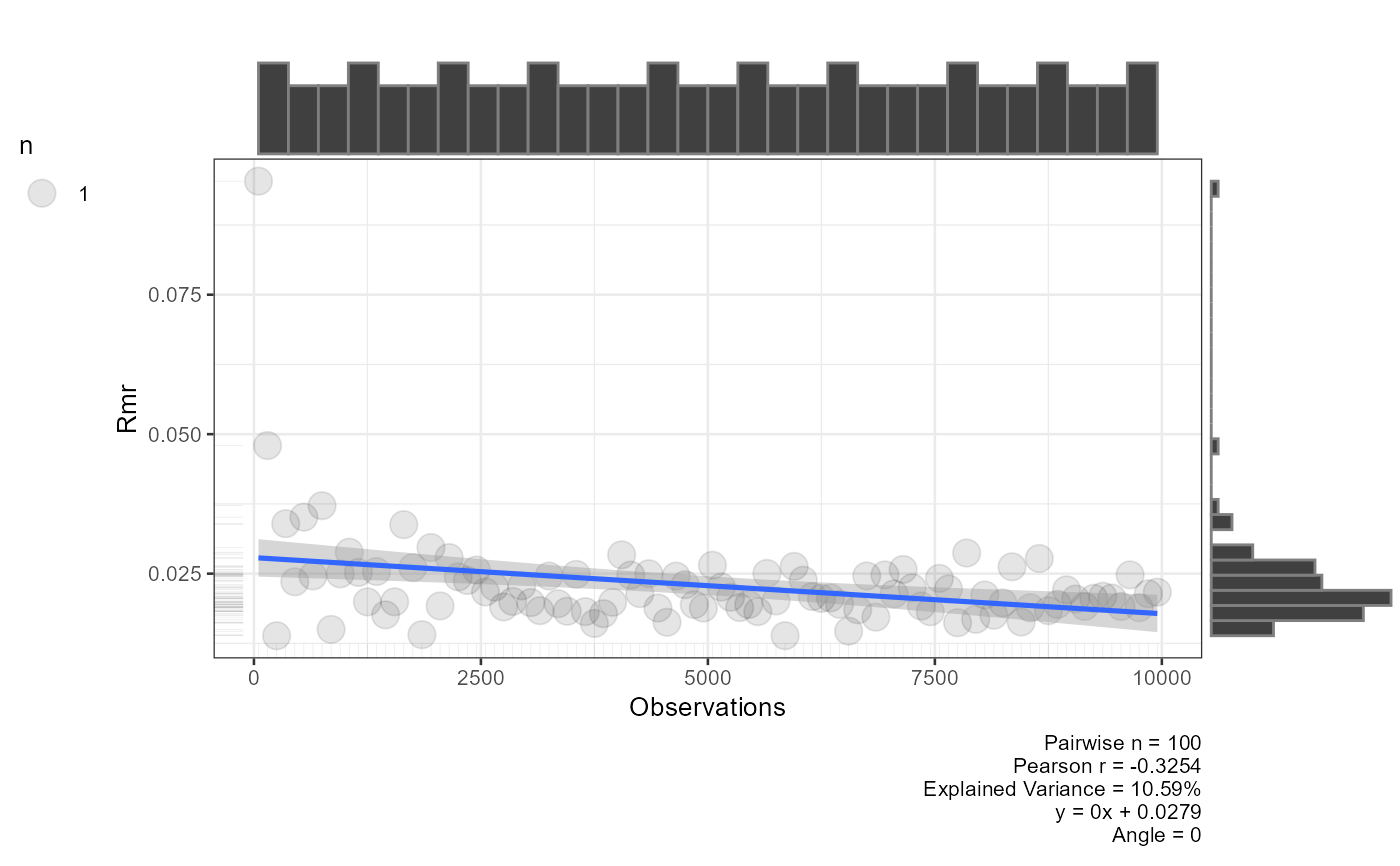
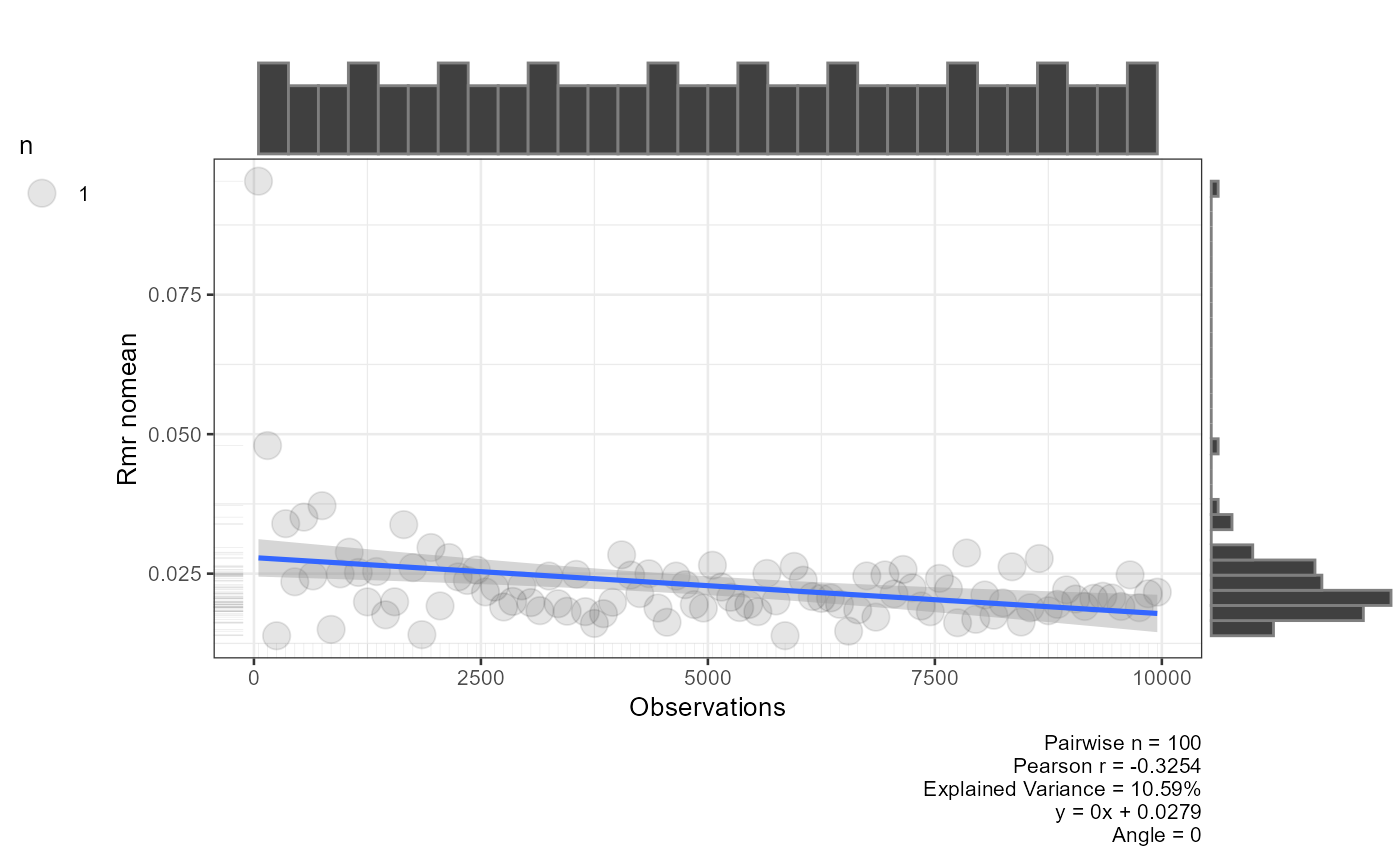
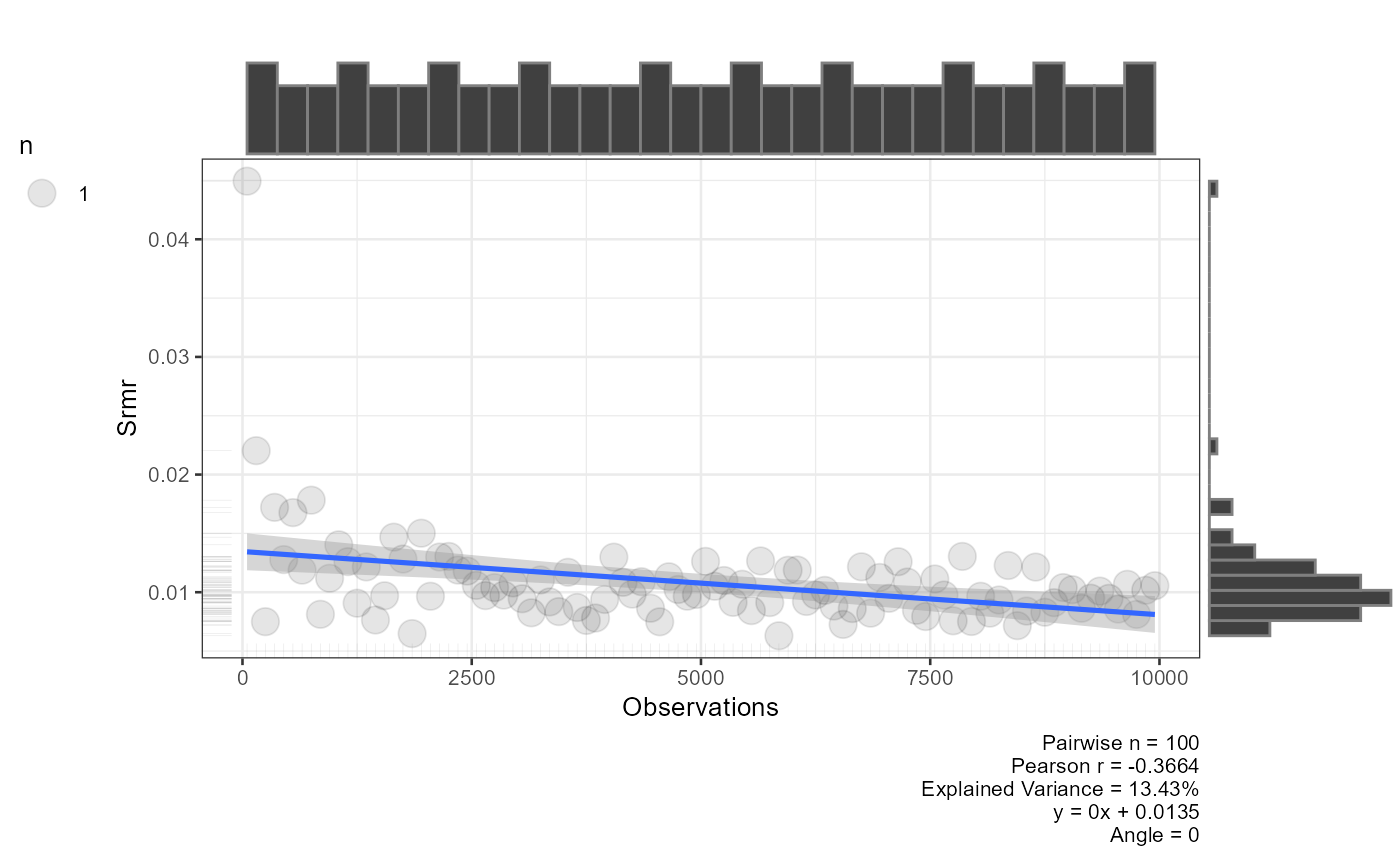
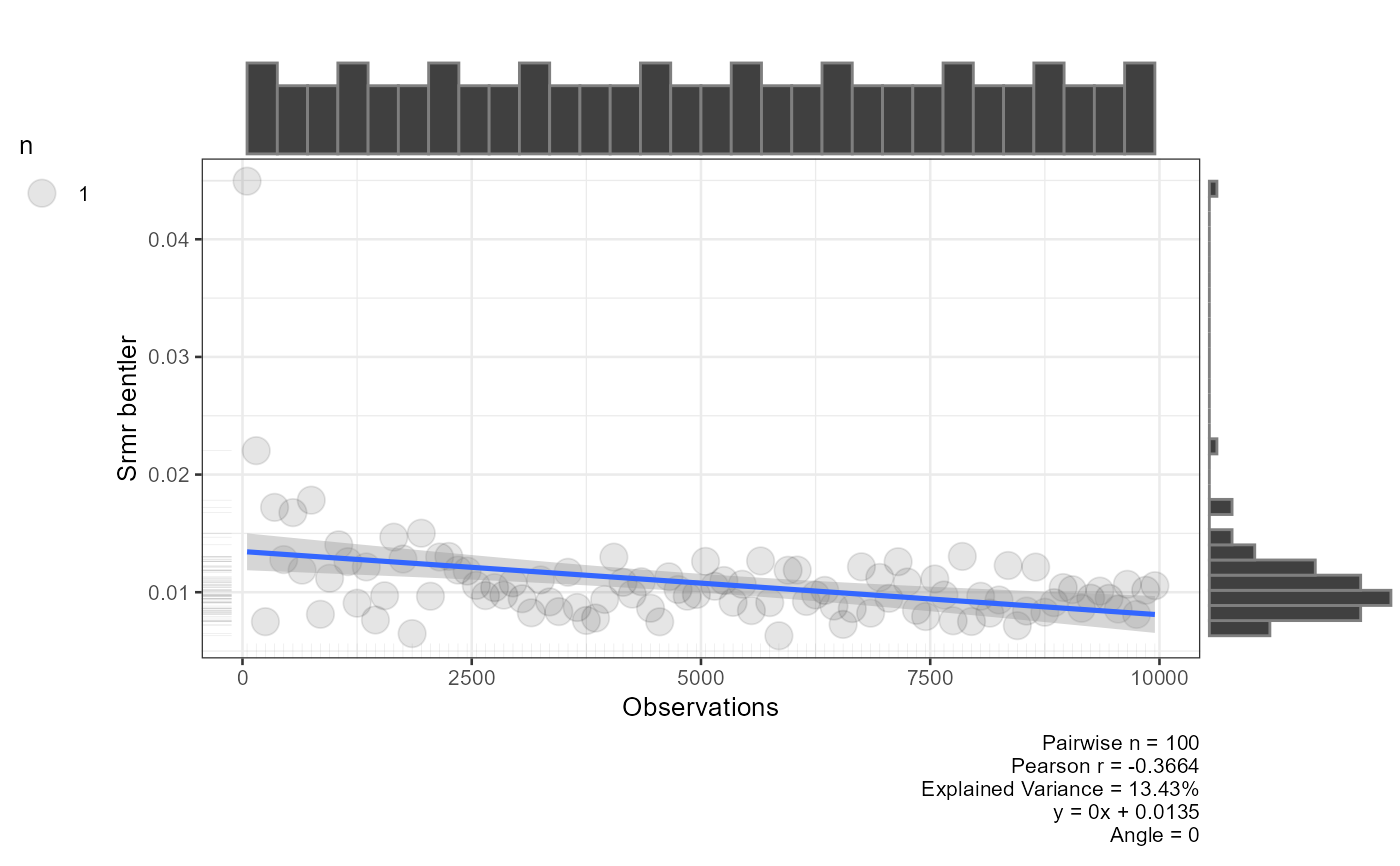
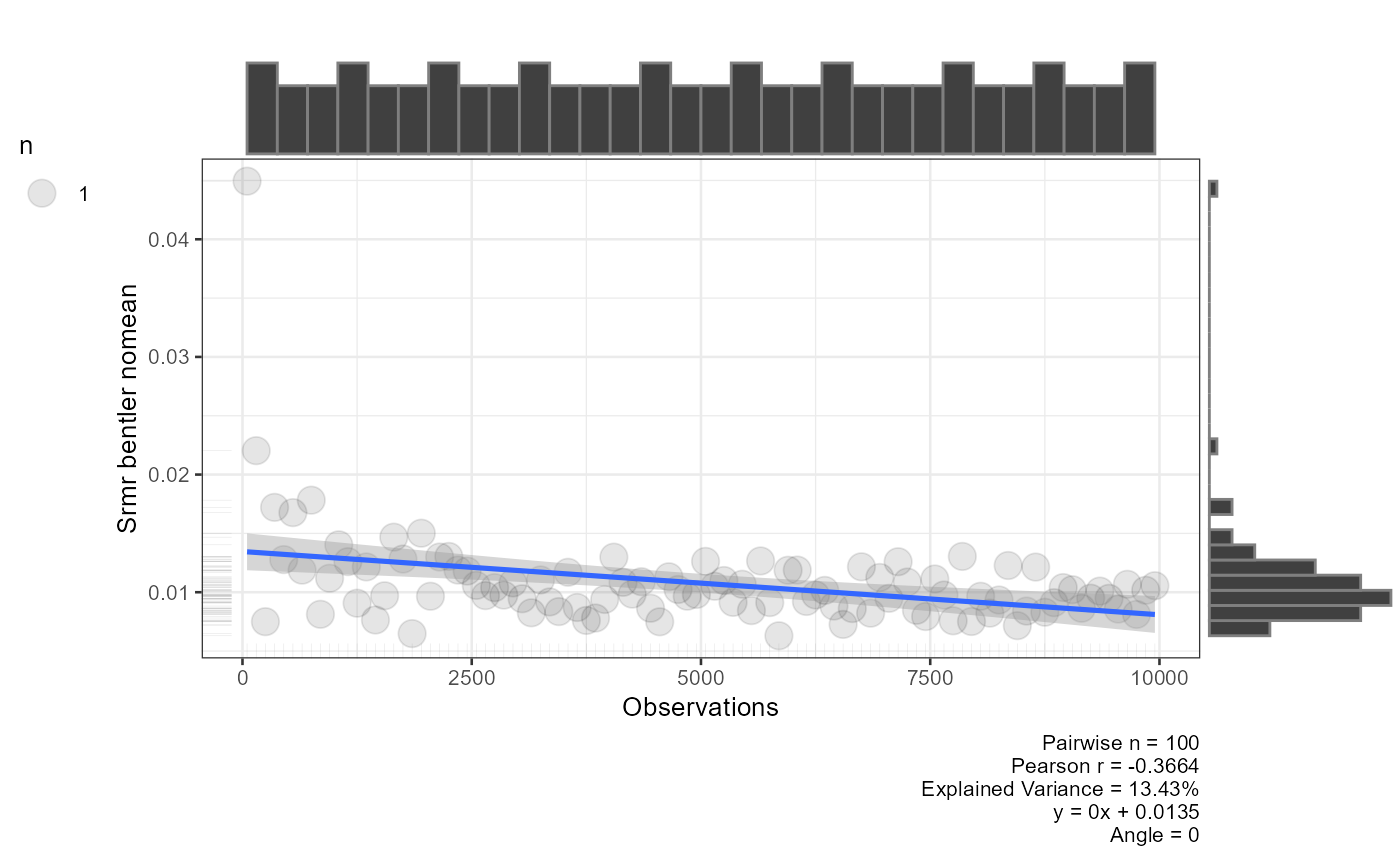
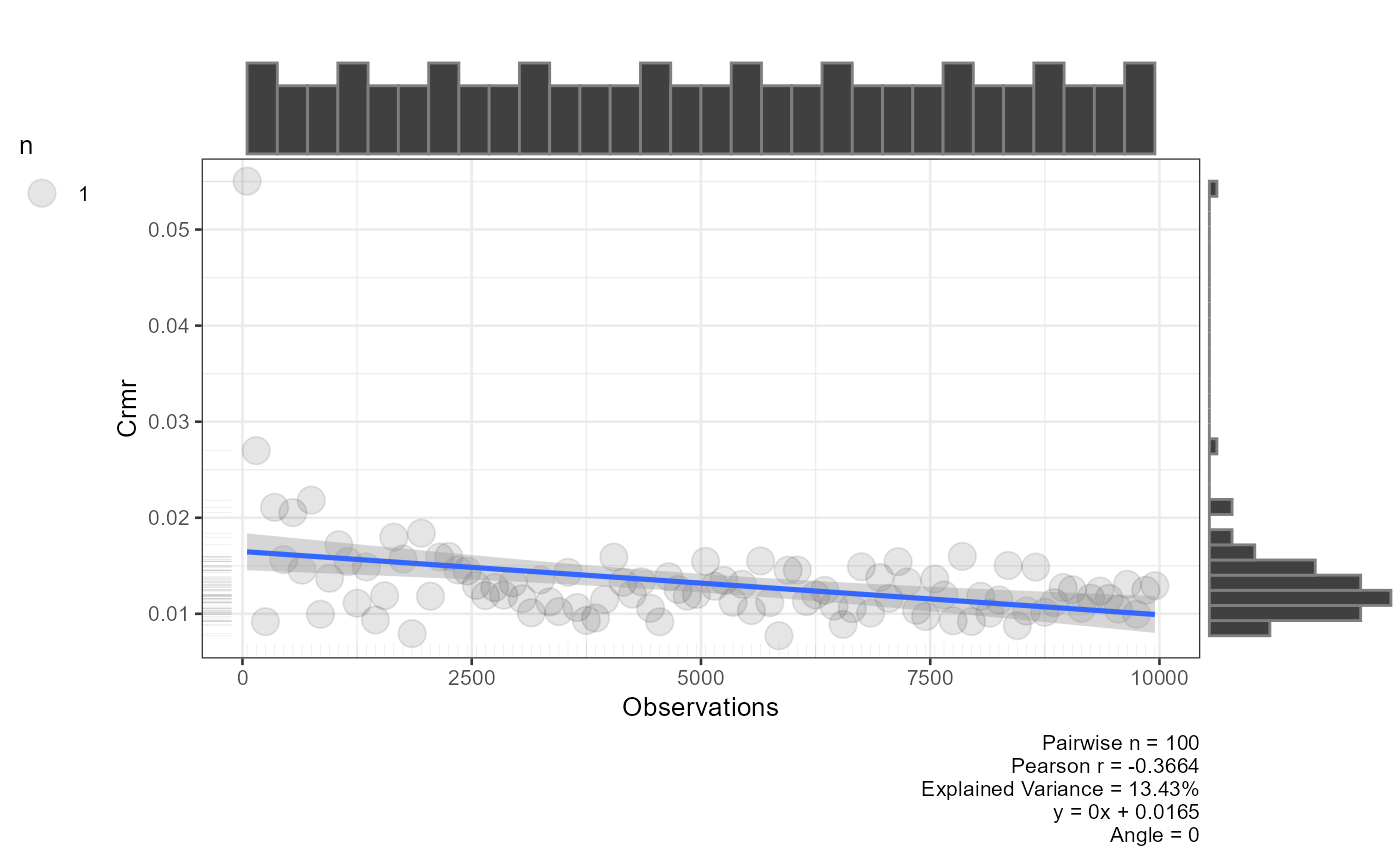
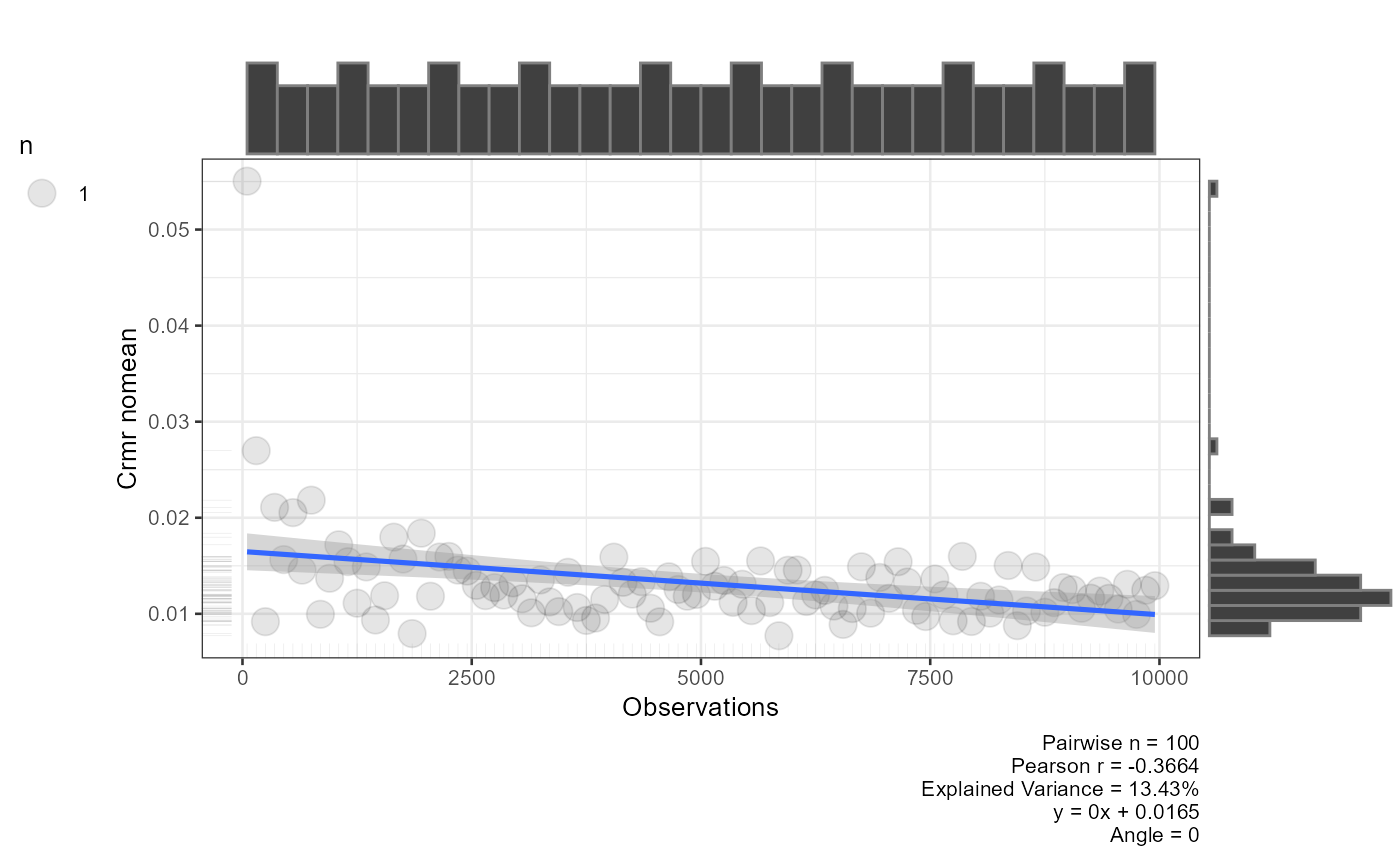
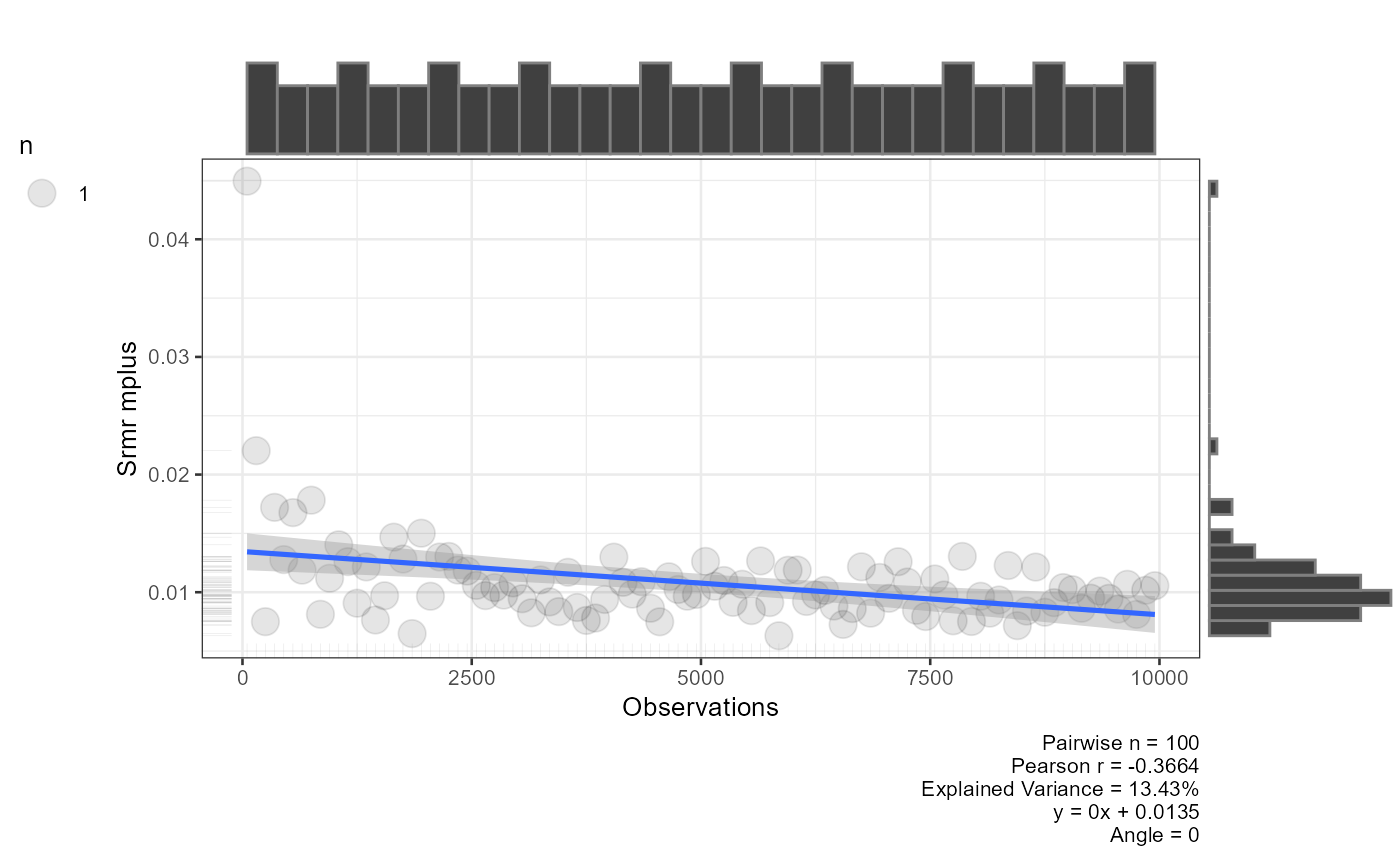
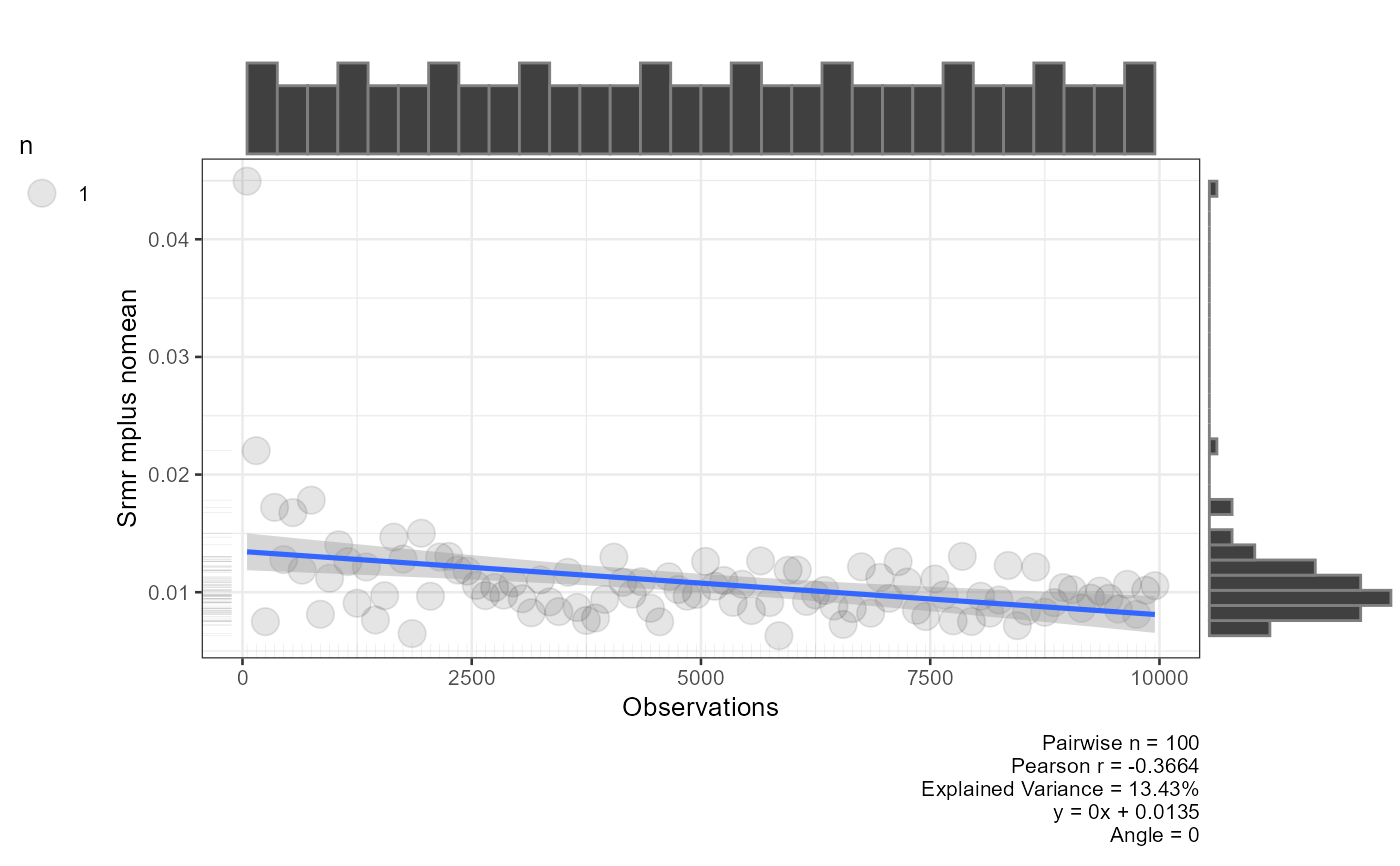
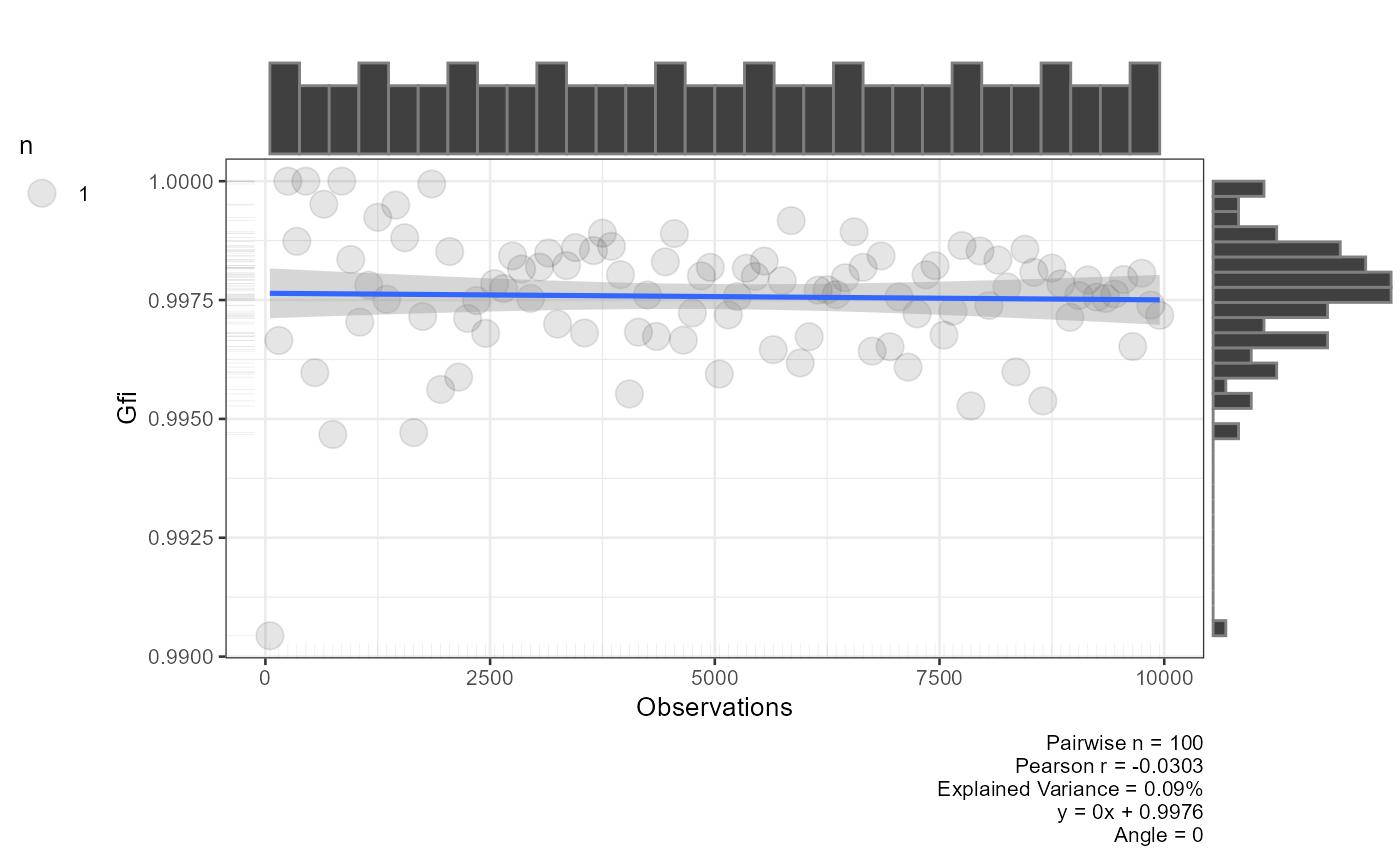
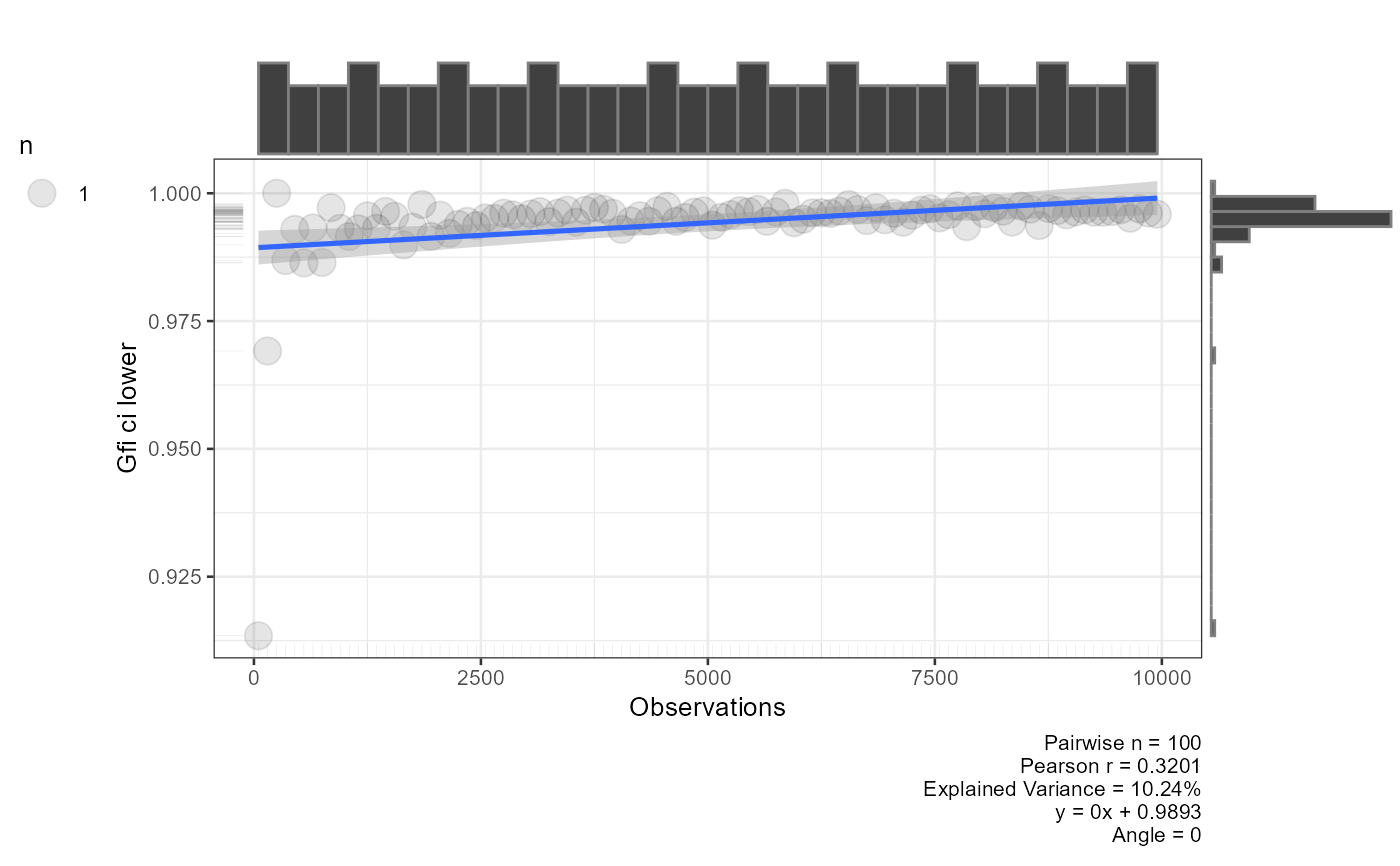
[[1]]- a data frame with one row per sample size and one column per lavaan fit index (CFI, RMSEA, SRMR, etc.).[[2]]- a named list of ggplot scatter plots, one per fit index, showing how the index changes with sample size.
Examples
model_sim <- 'LATENT =~ 1*X1 + 0.5*X2 + 1.5*X3 + 1.5*X4 + X5'
model <- 'LATENT =~ X1 + X2 + X3 + X4 + X5'
# Coefficient-based: generate data from known population parameters
result<-simulate_cfa_fit(model_sim=model_sim, model=model,
minnobs=50, maxnobs=1000, stepping=100, file="report")
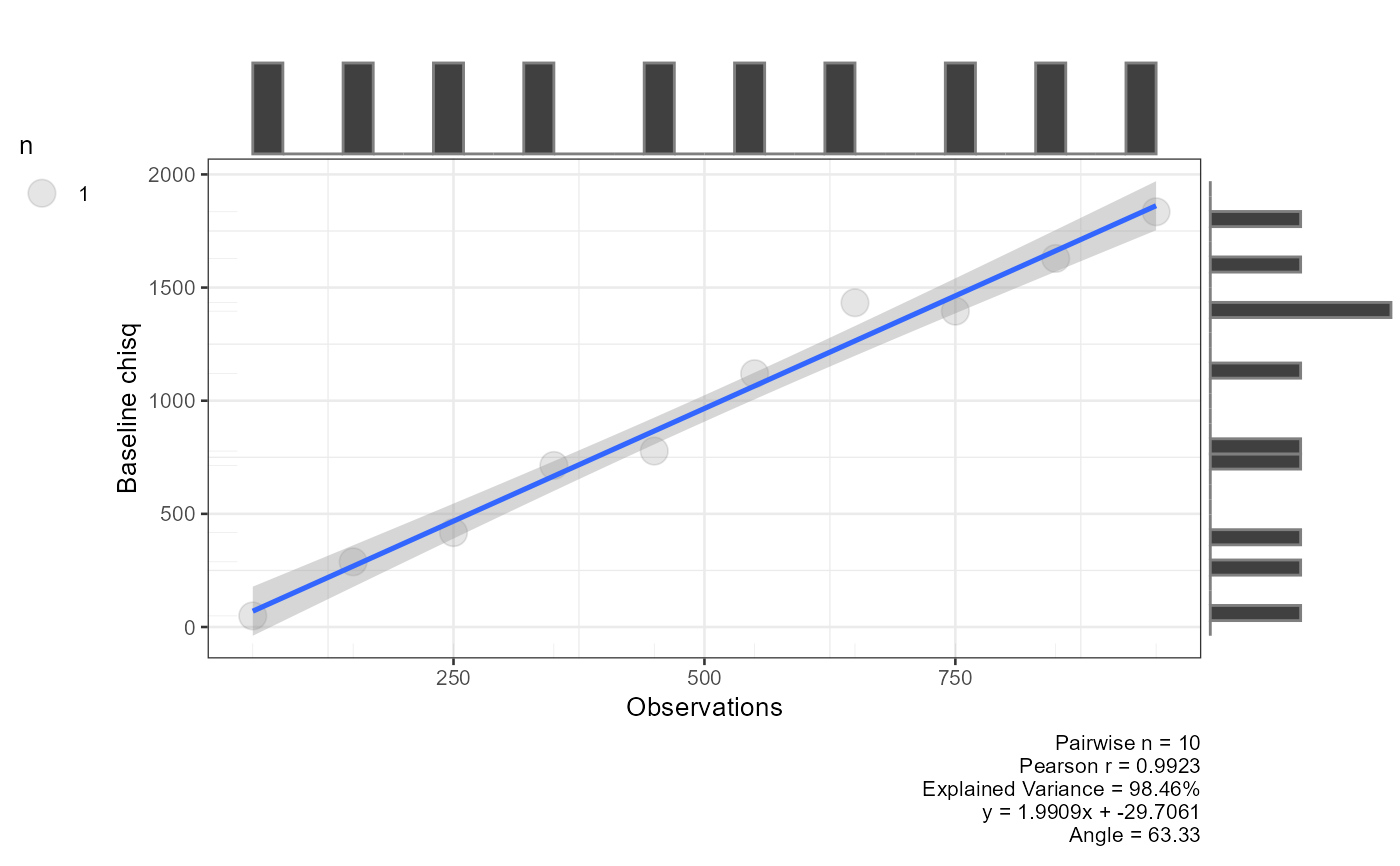
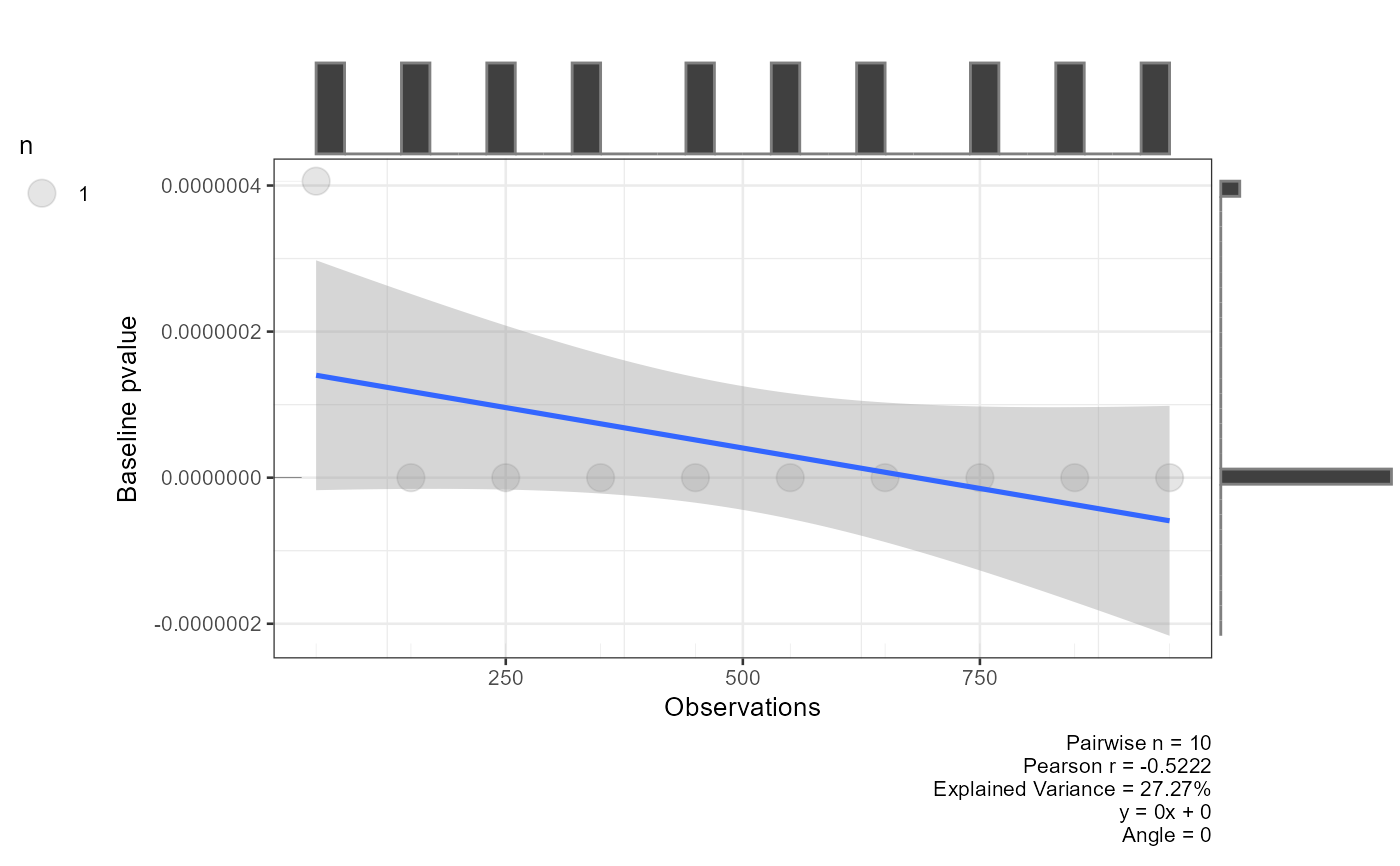
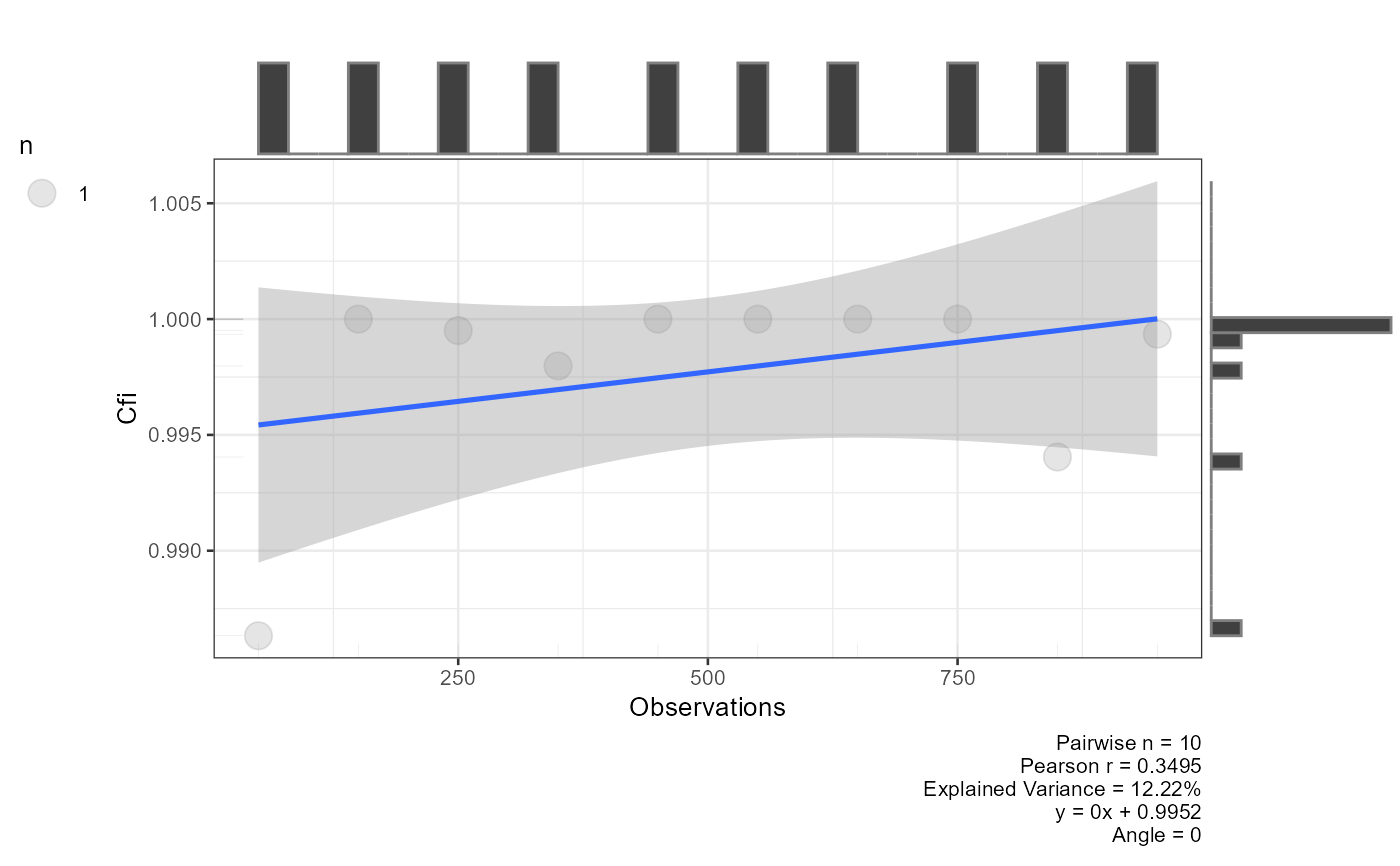
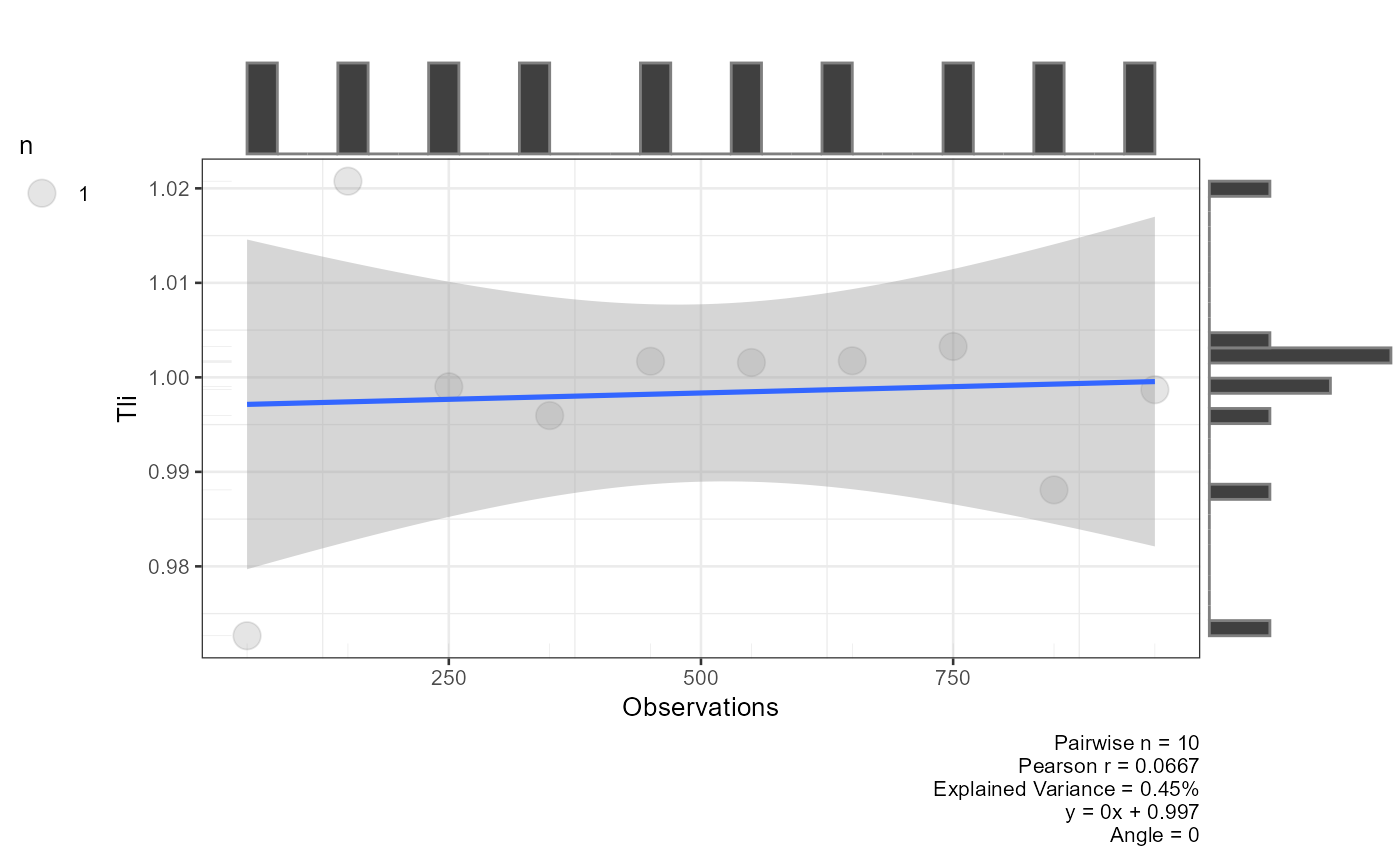
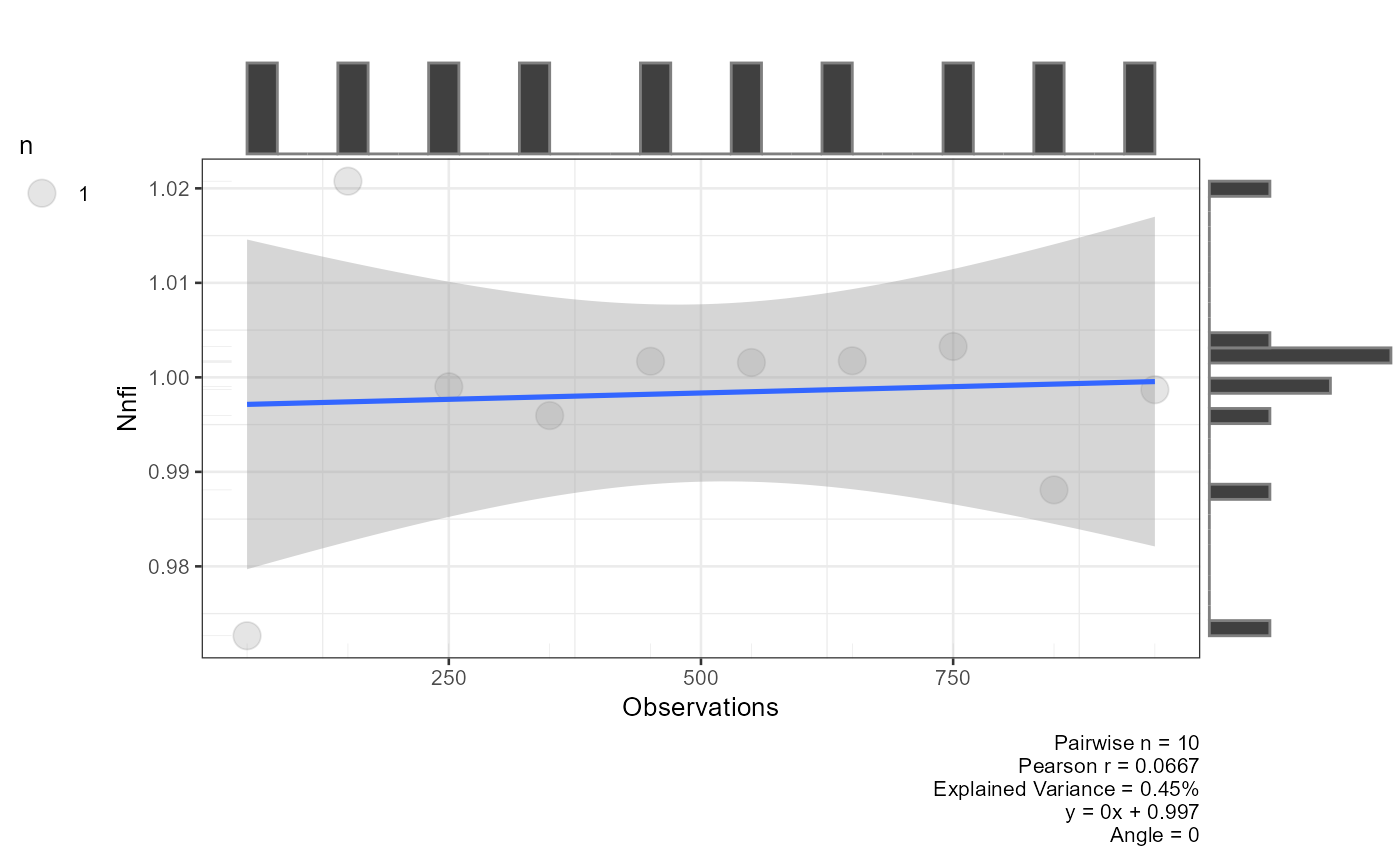
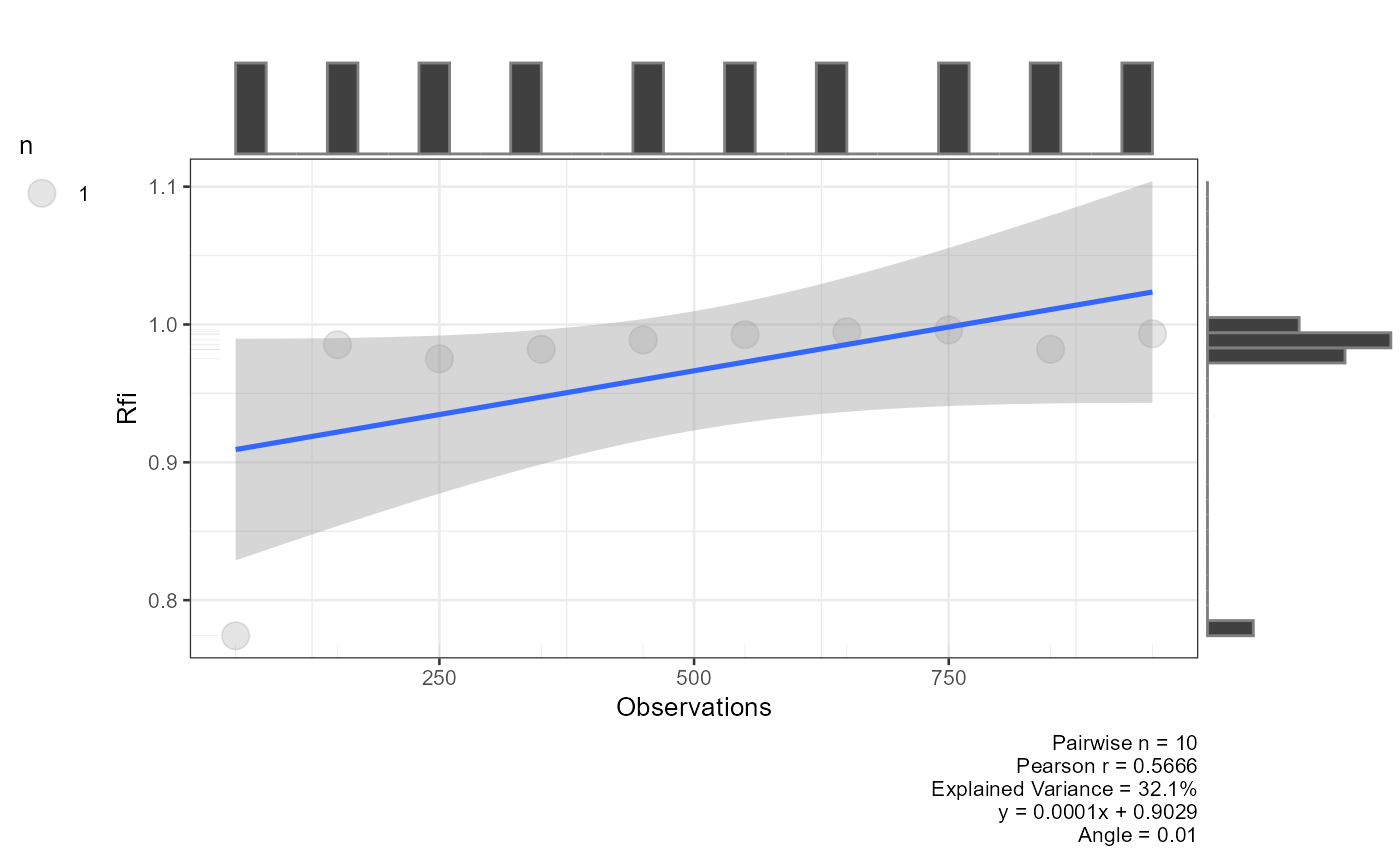
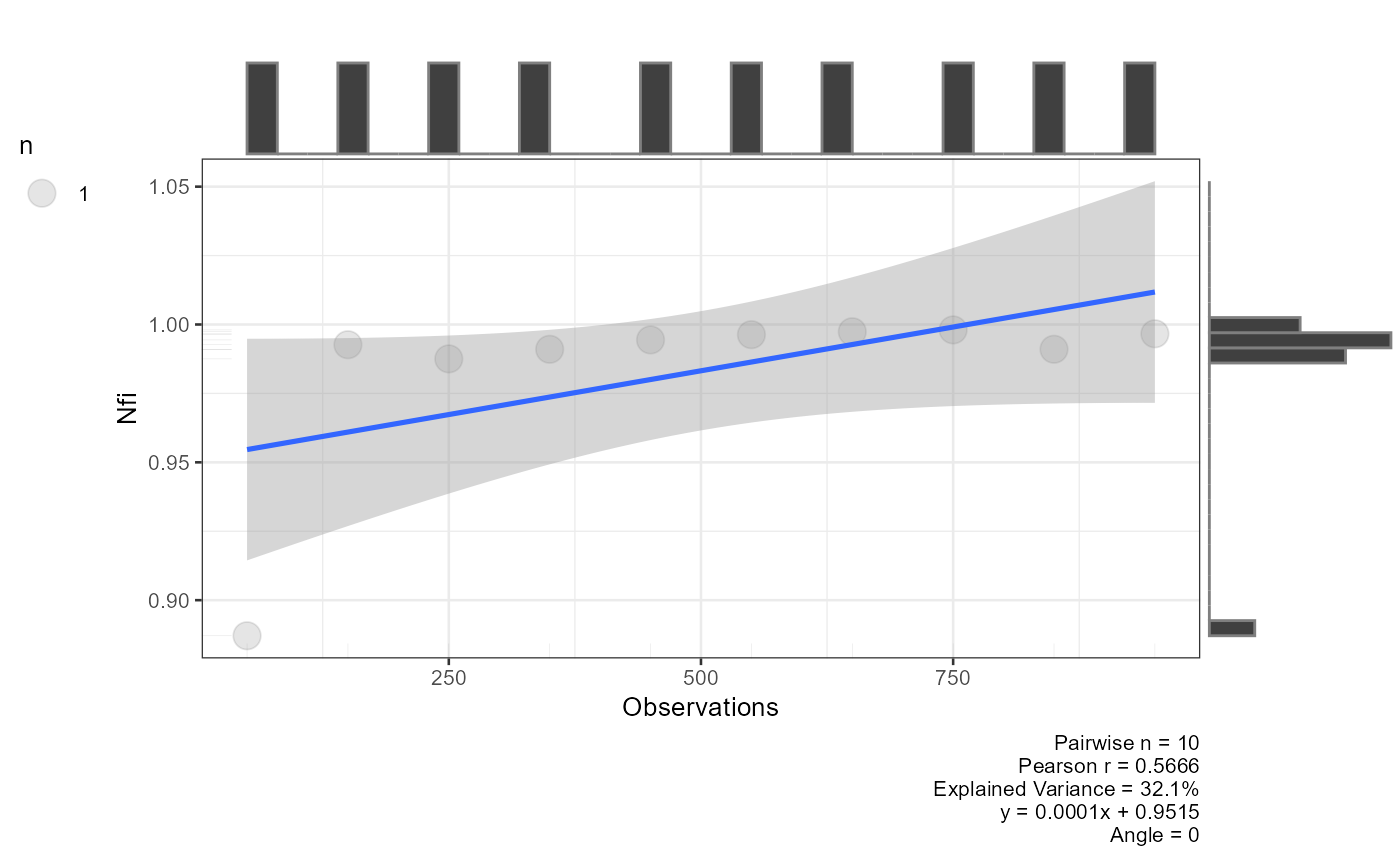
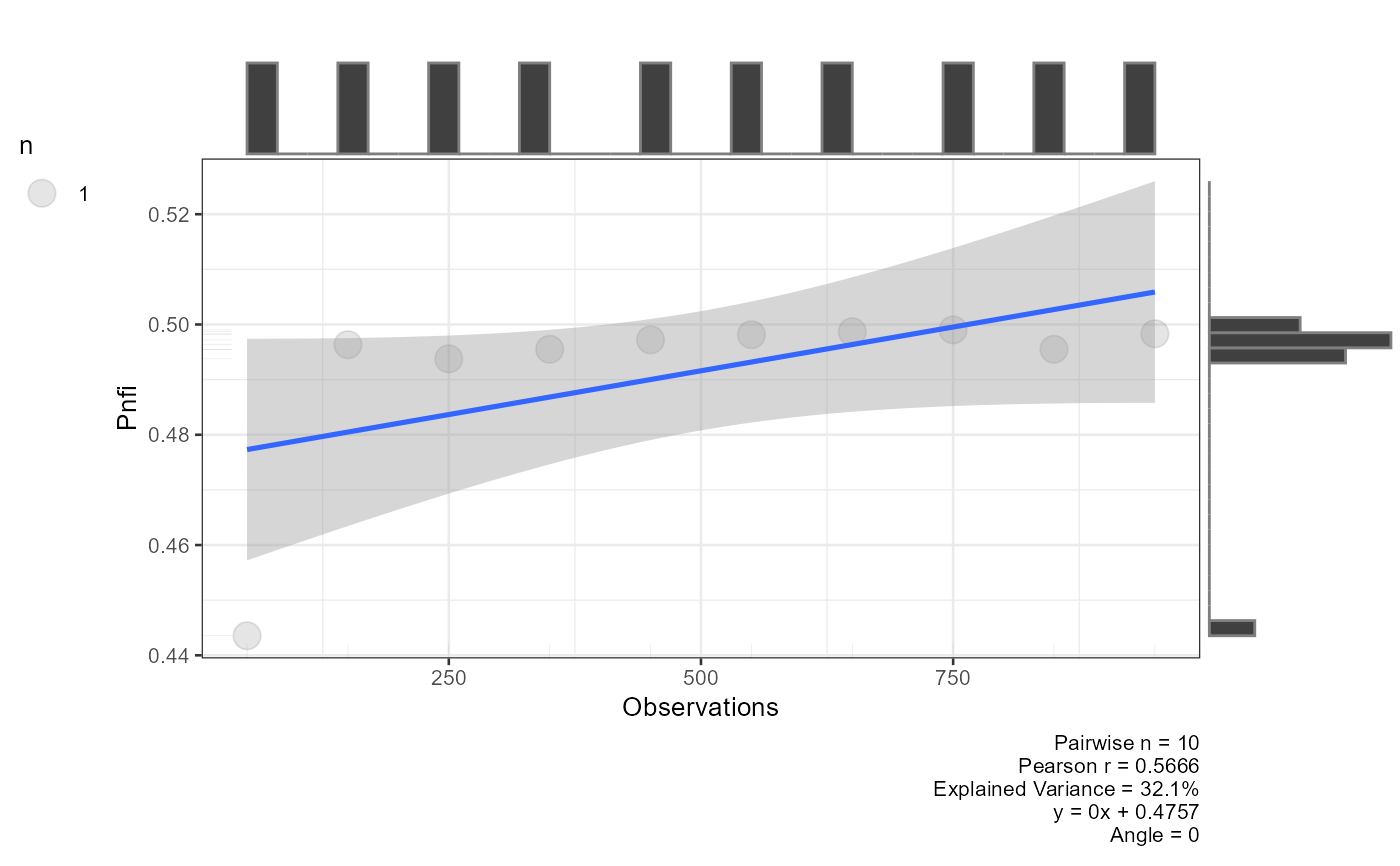
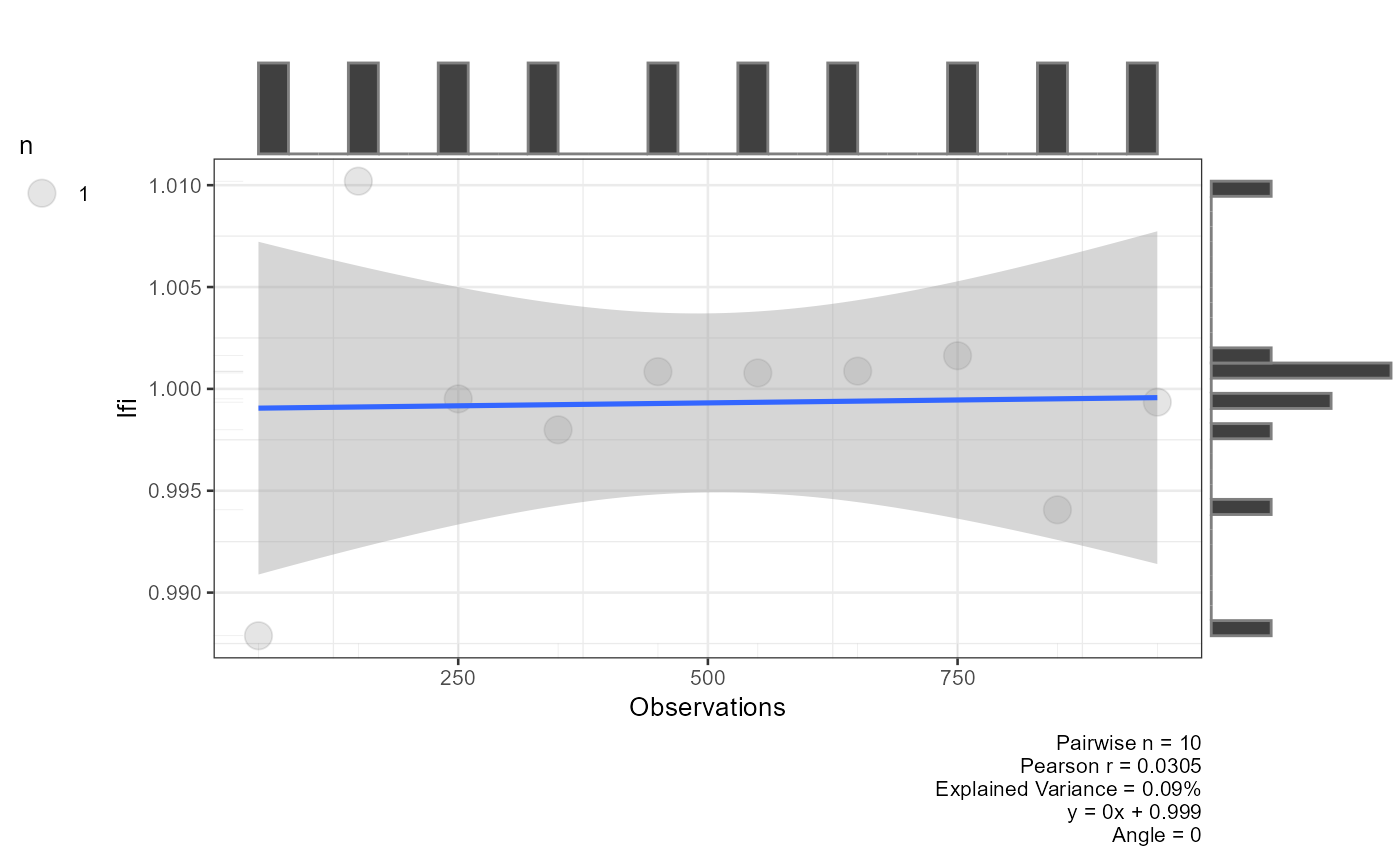
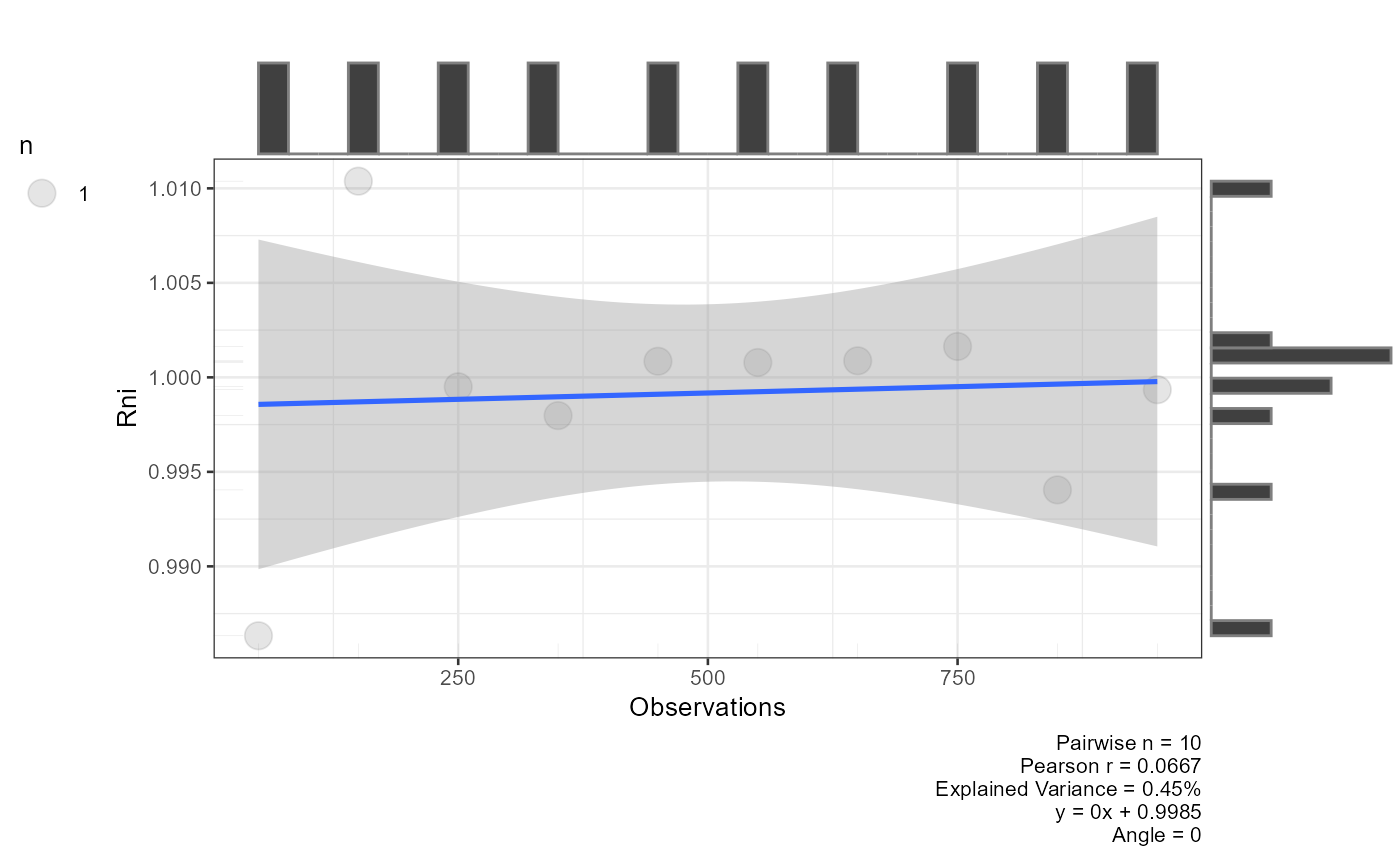
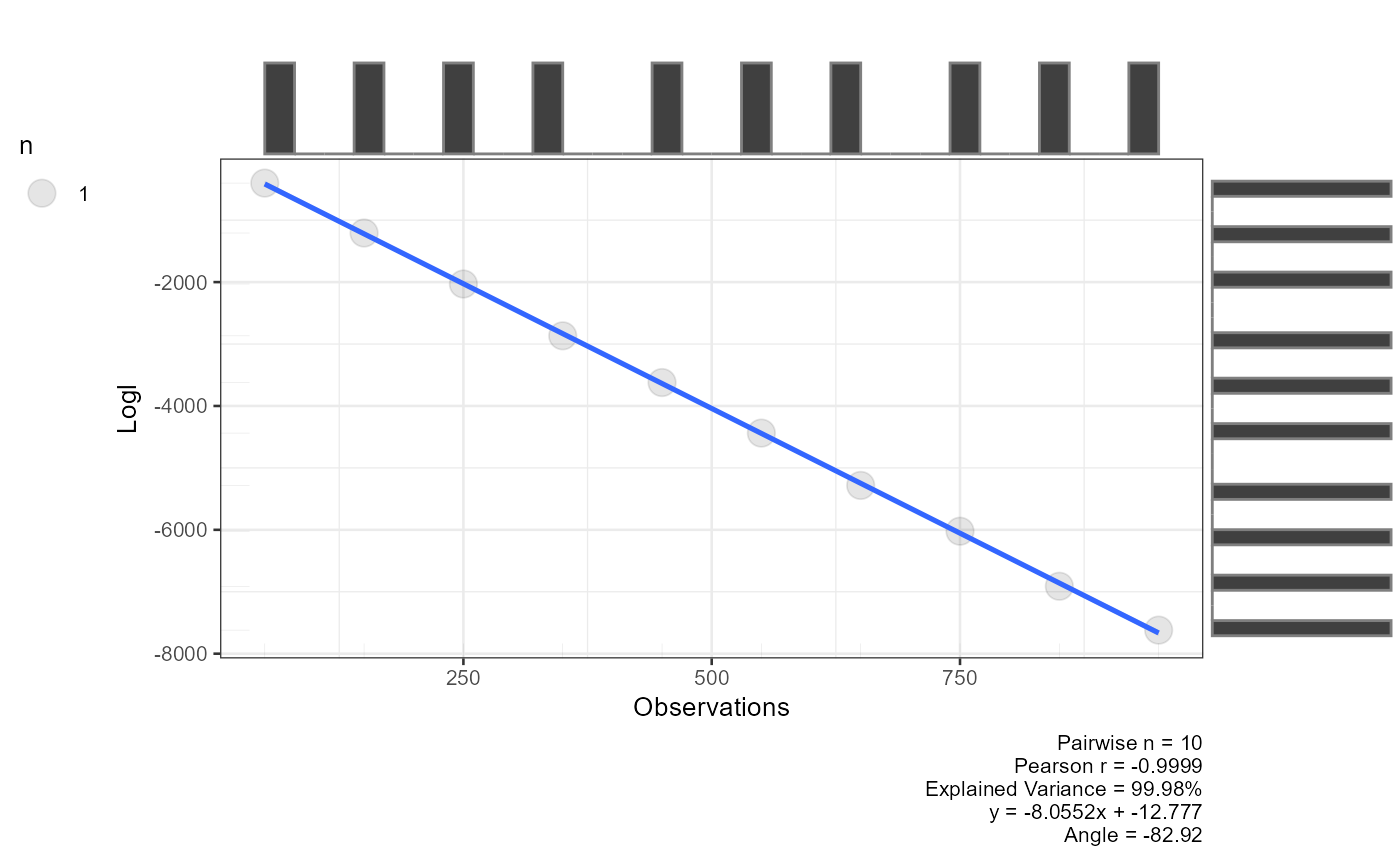
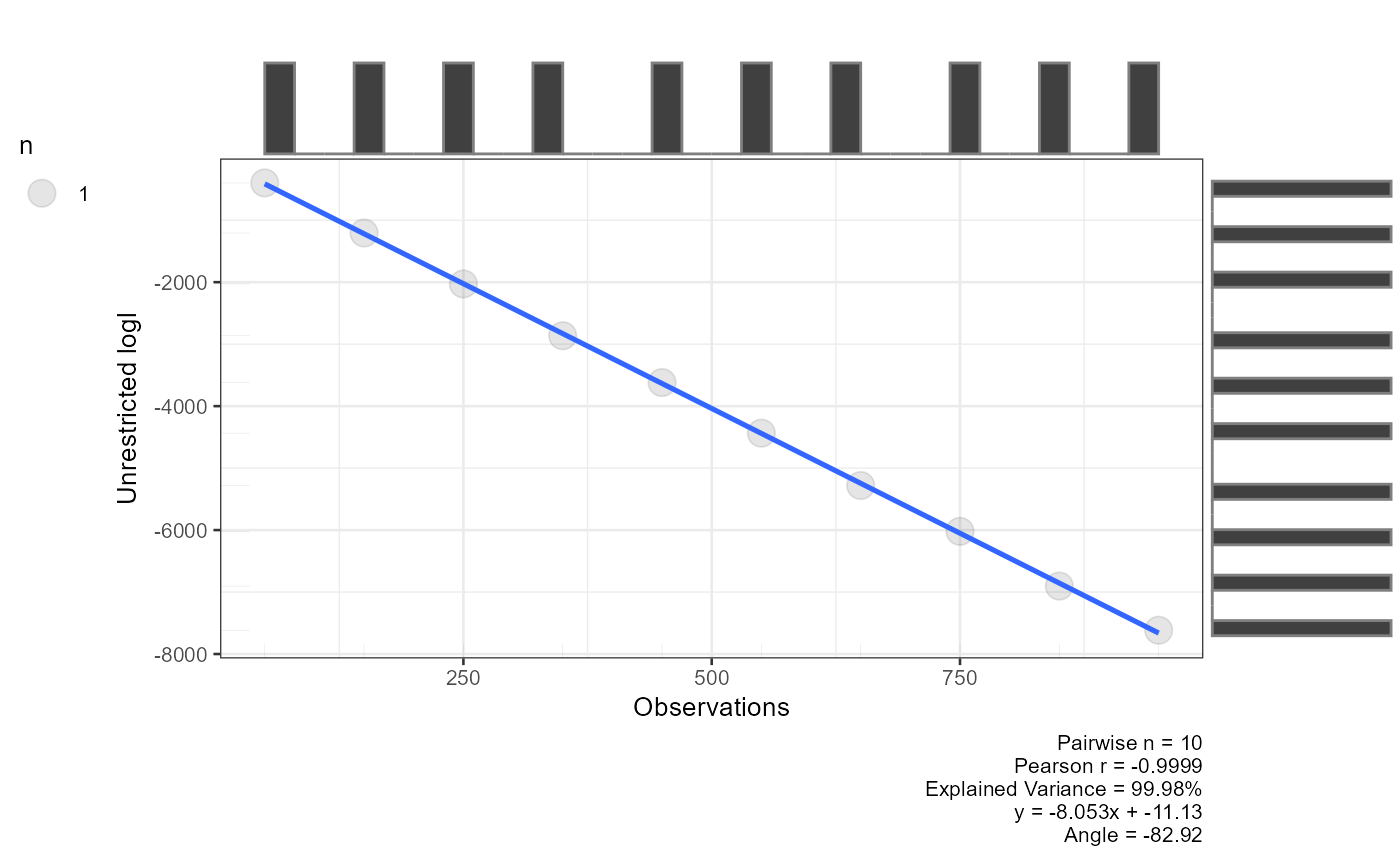
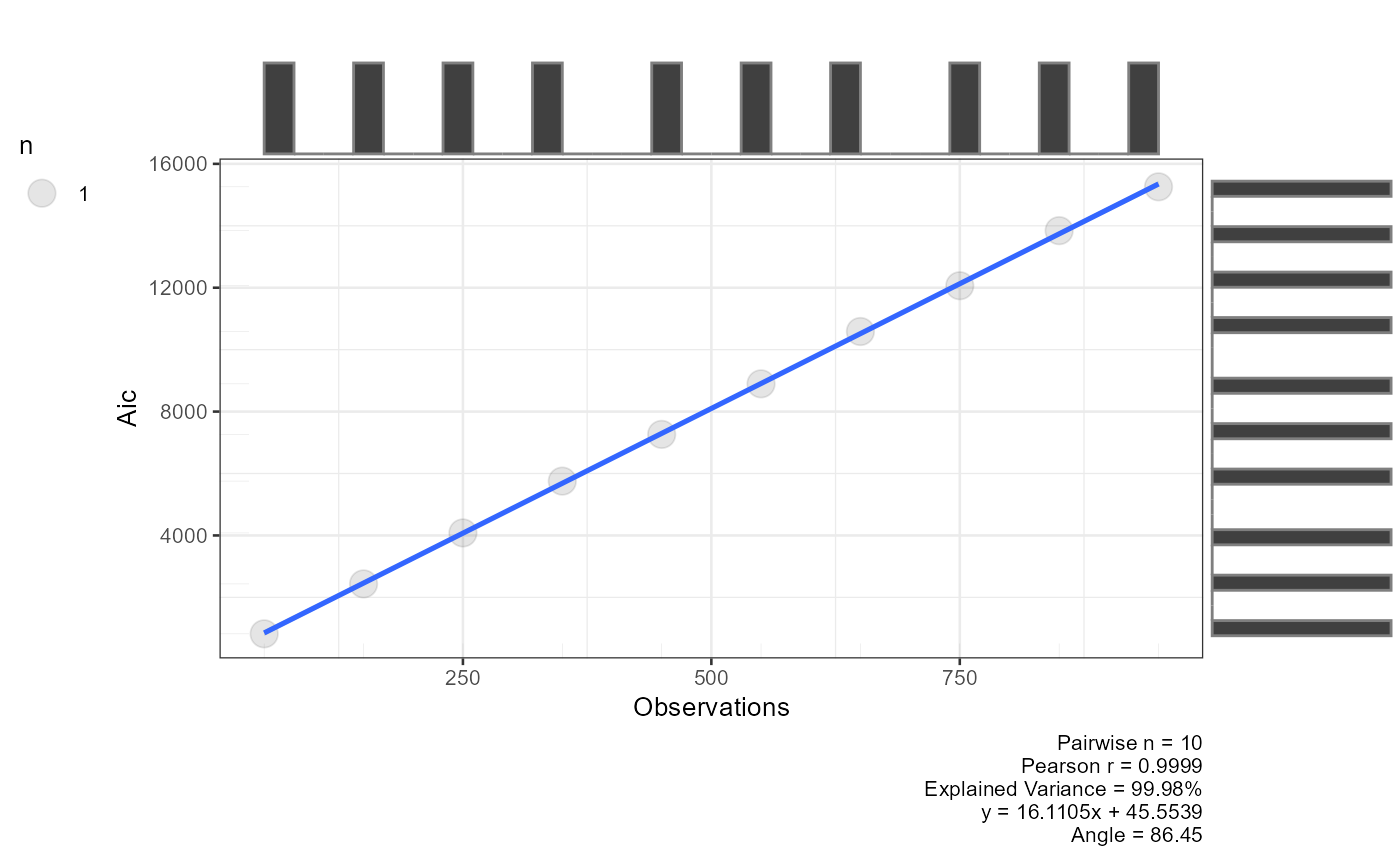
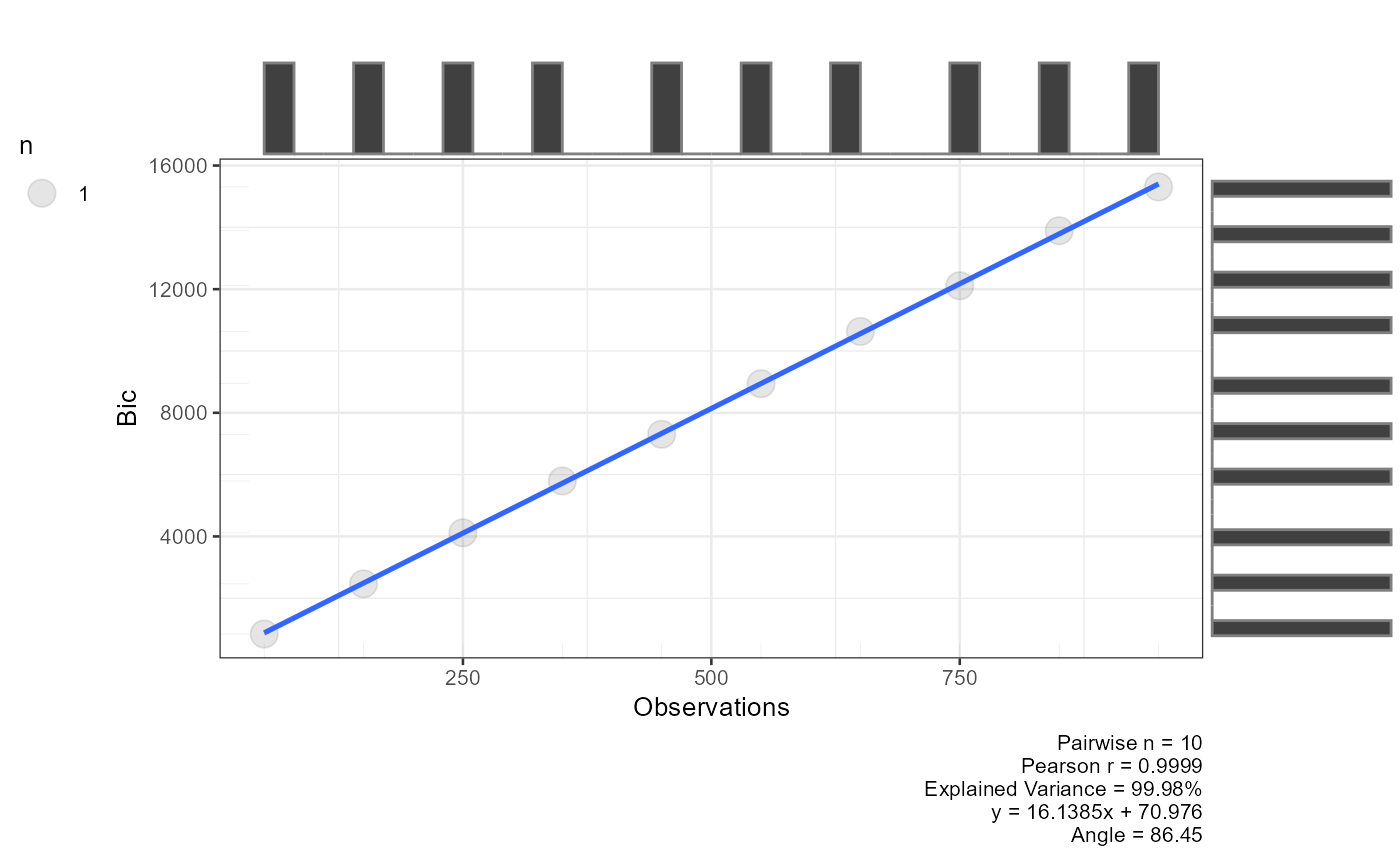
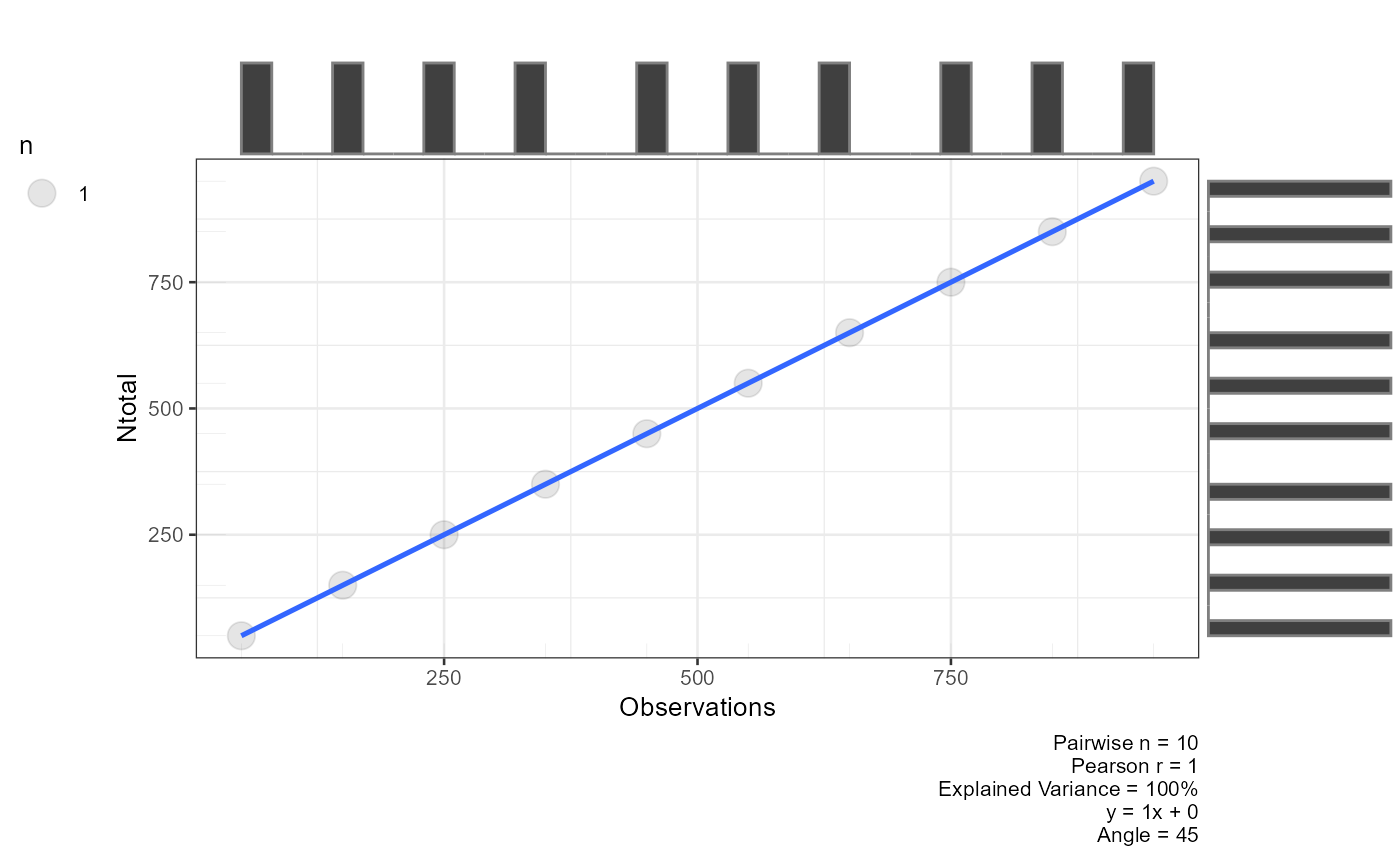
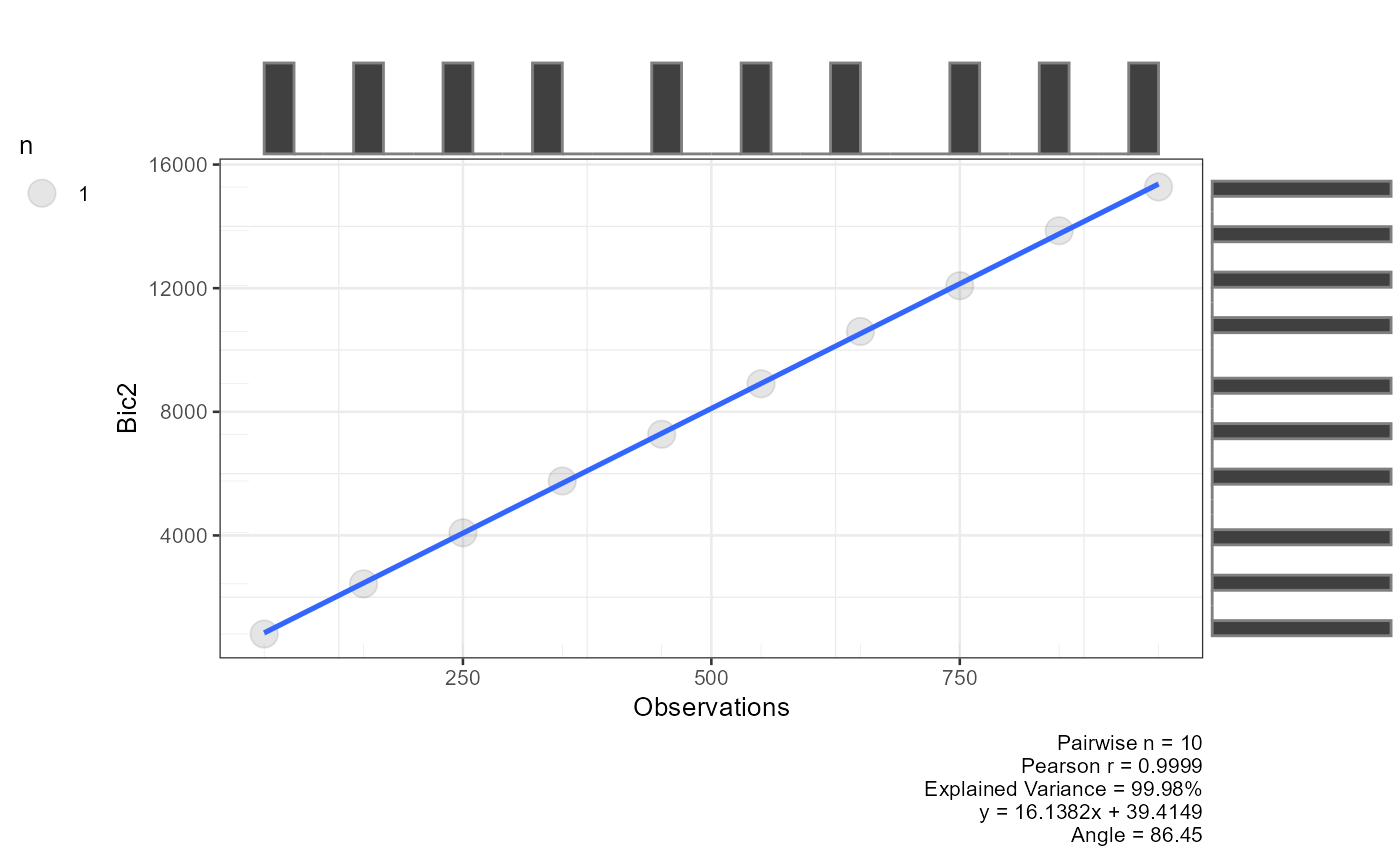
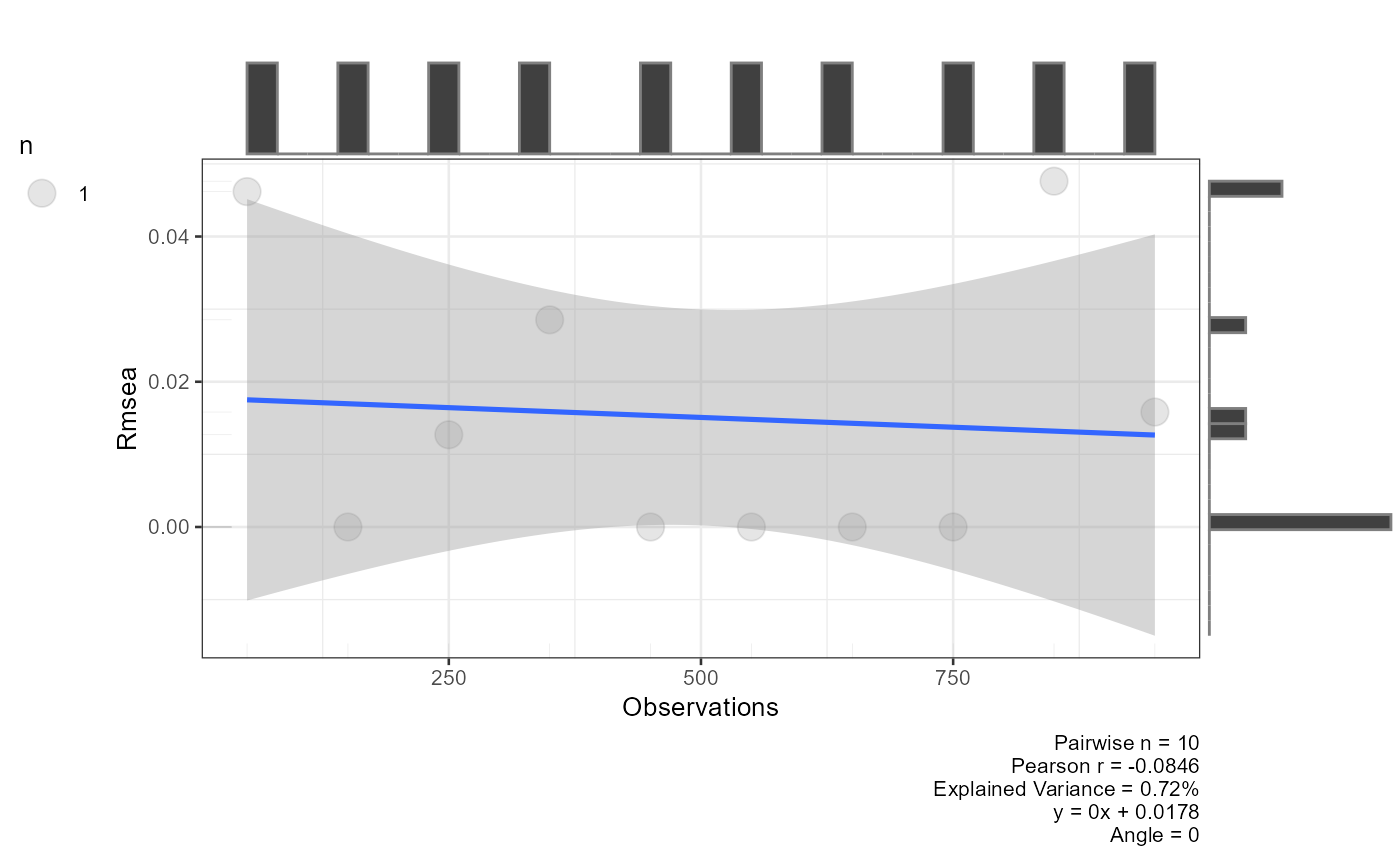
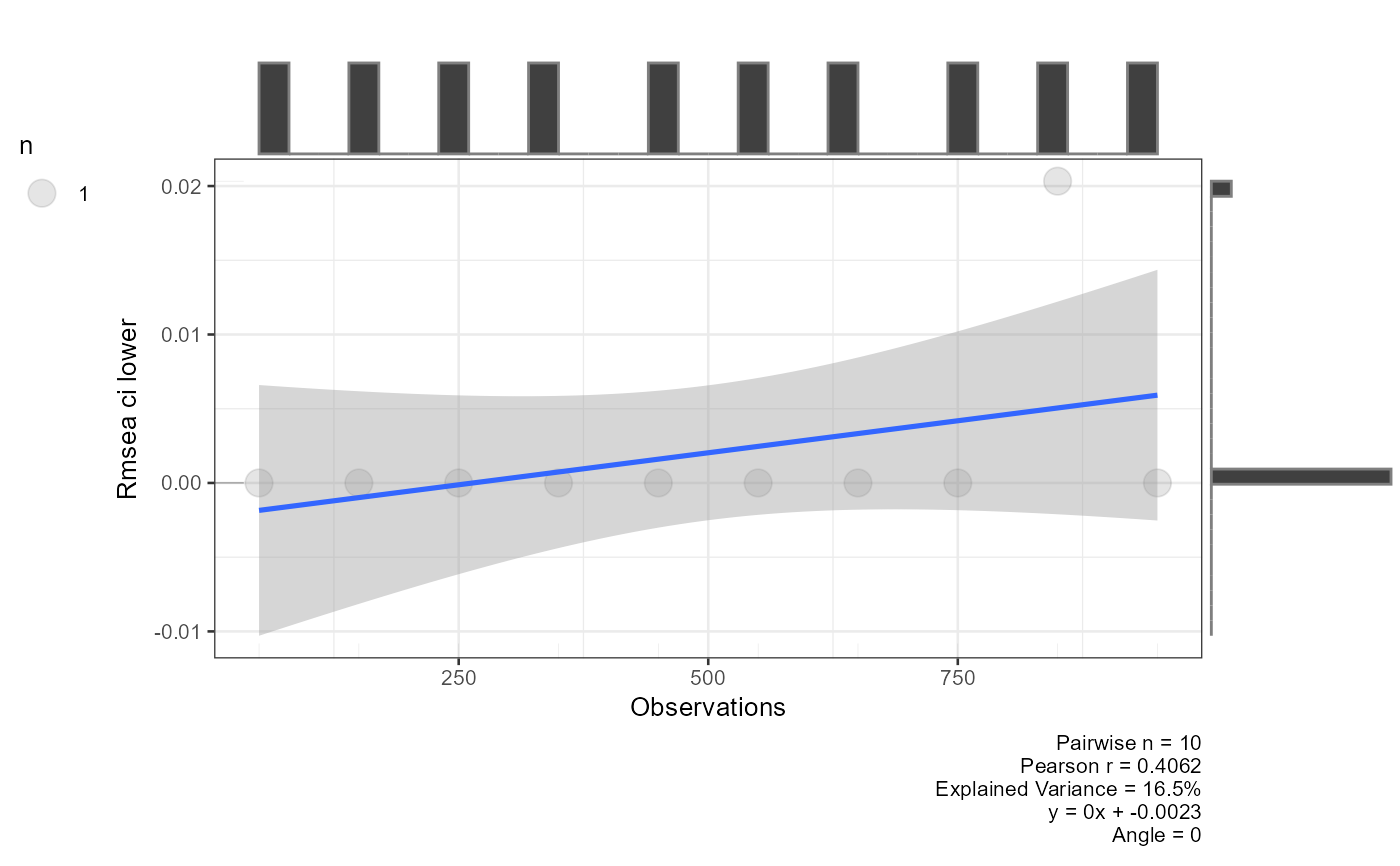
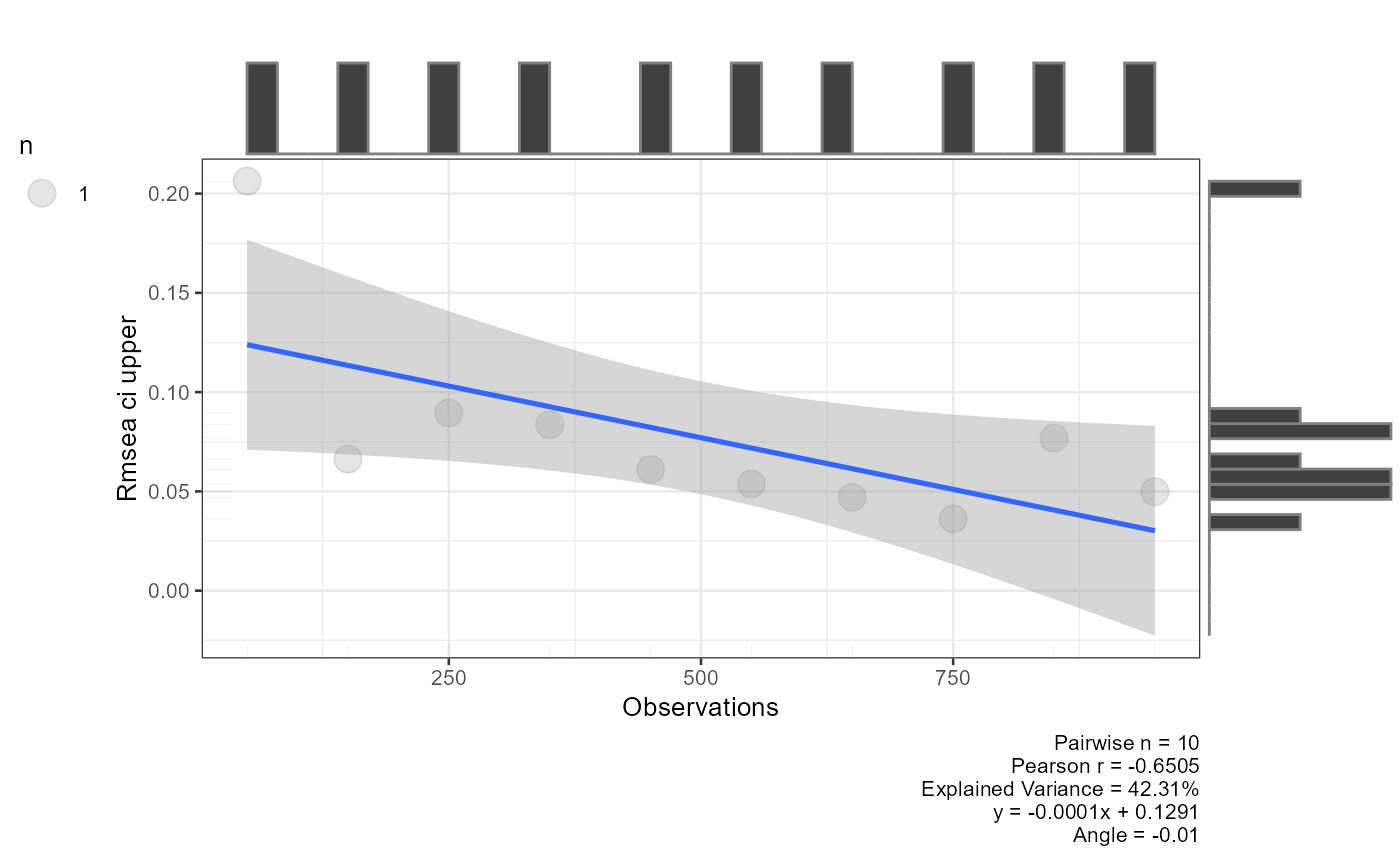
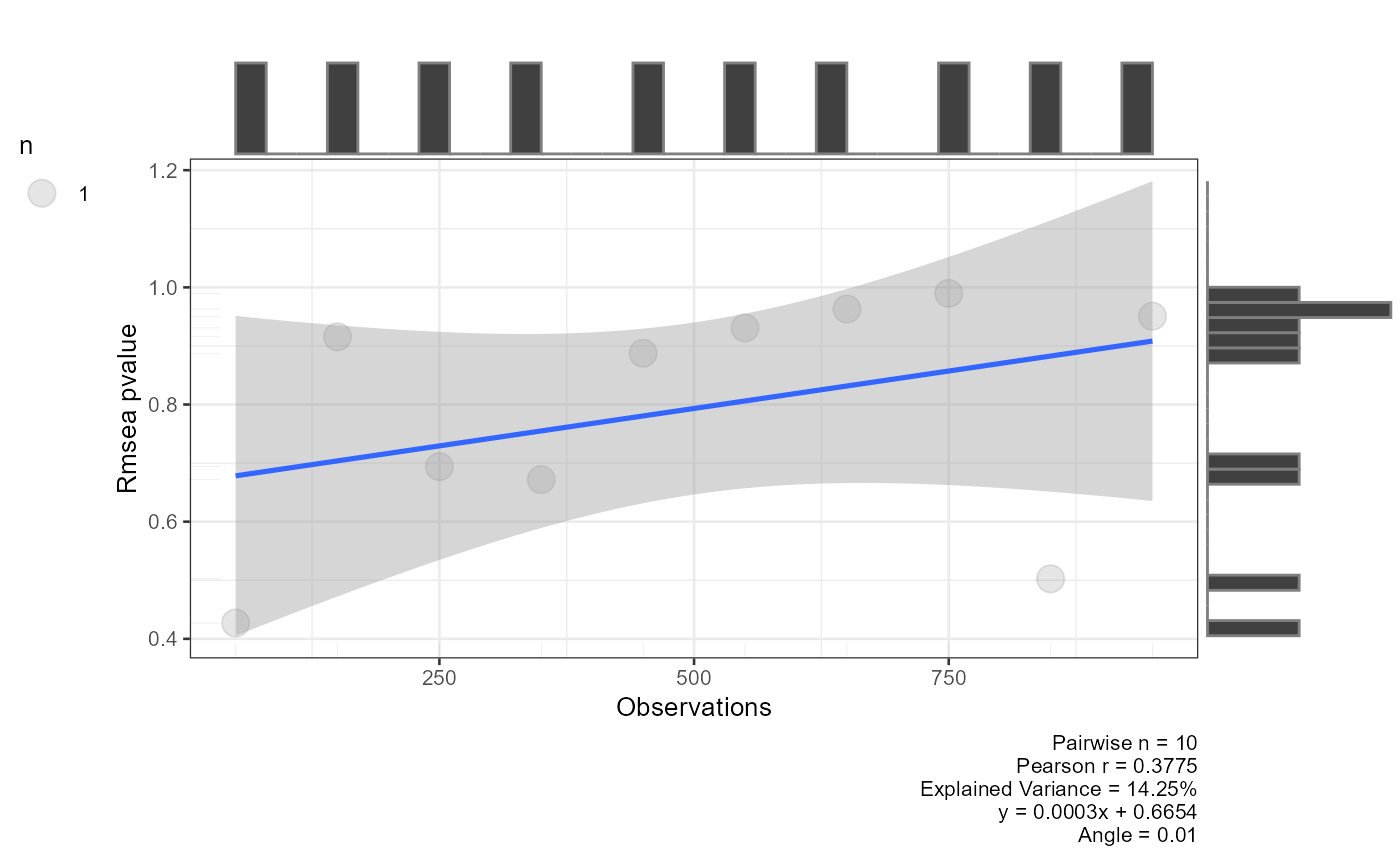
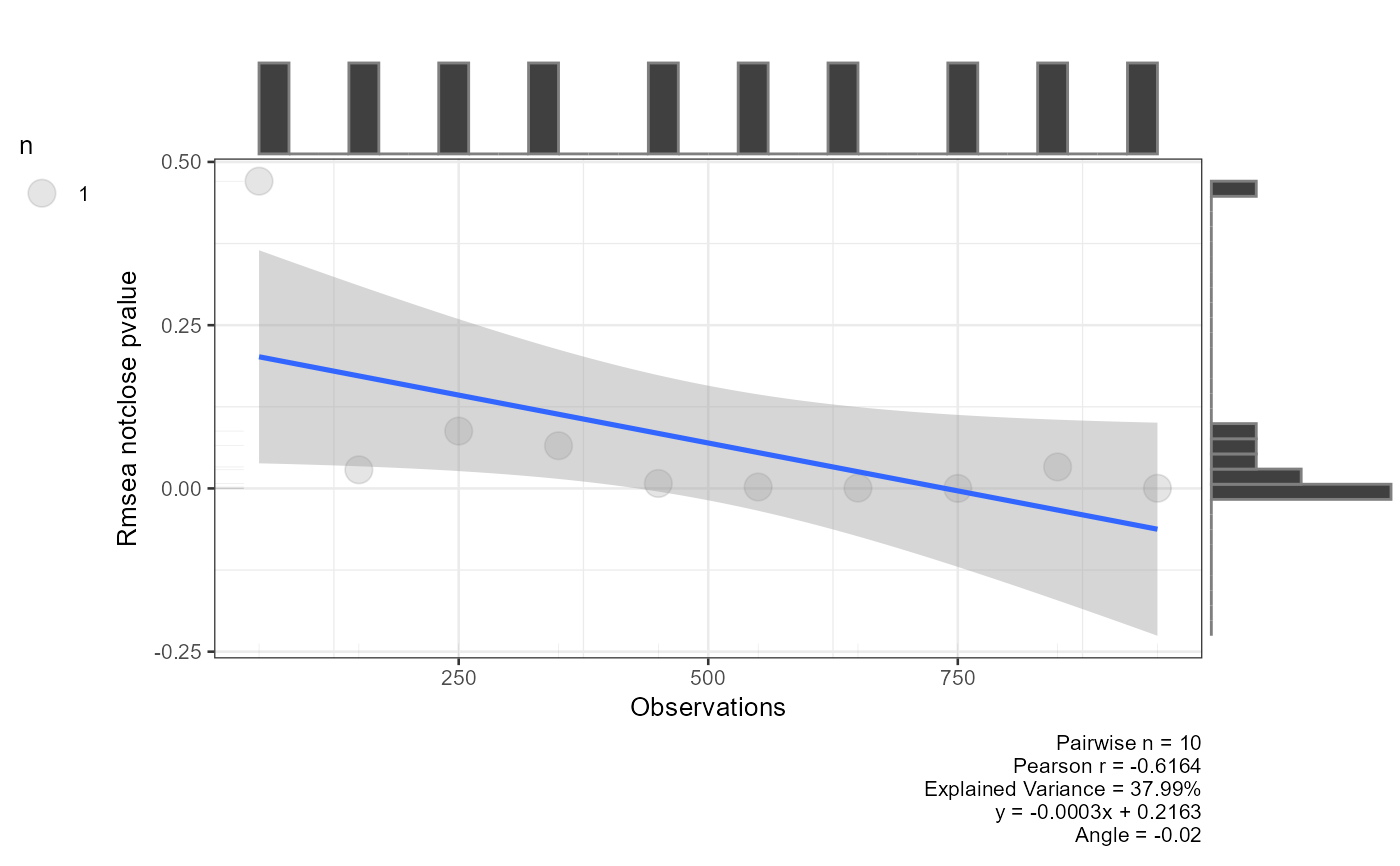
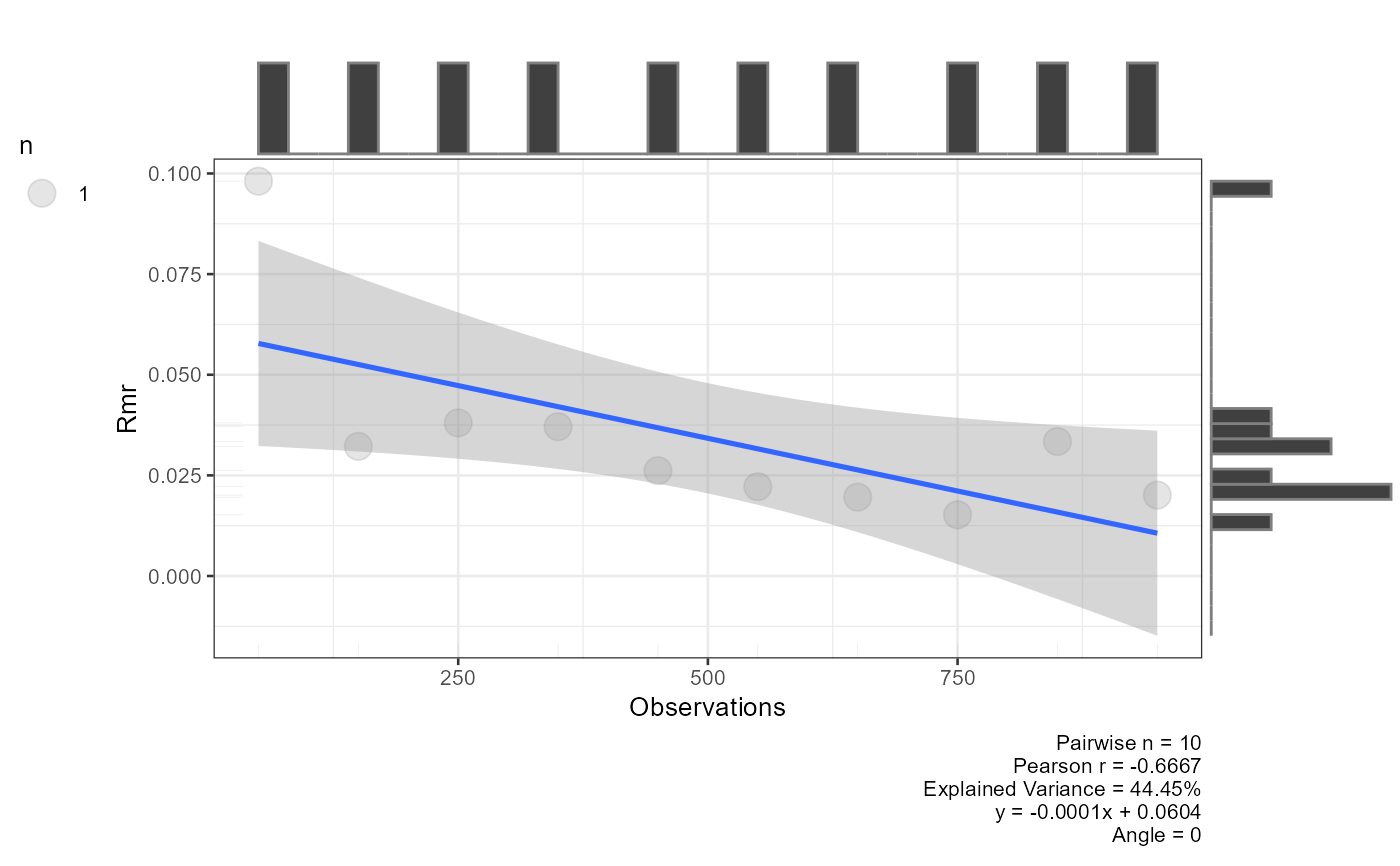
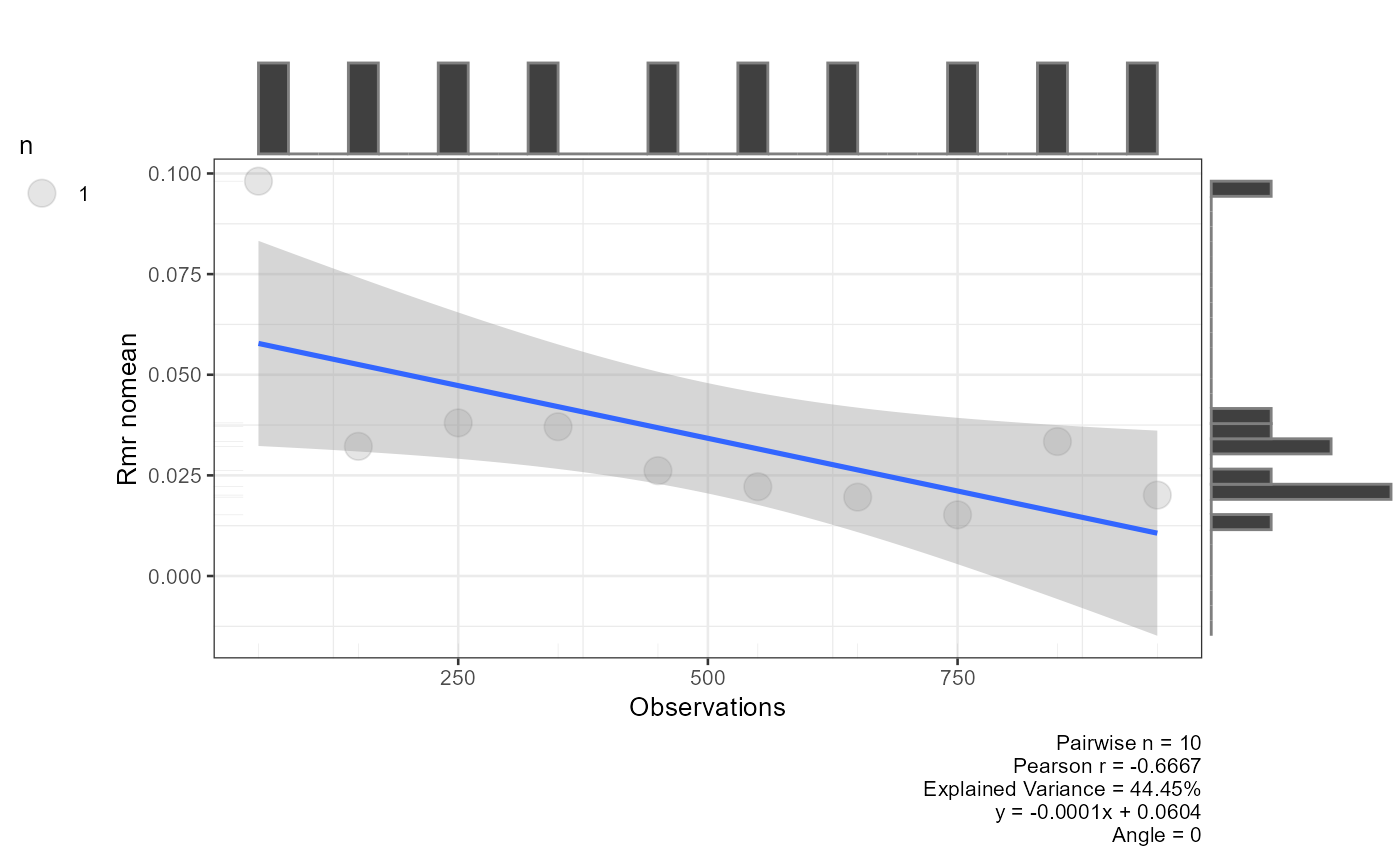
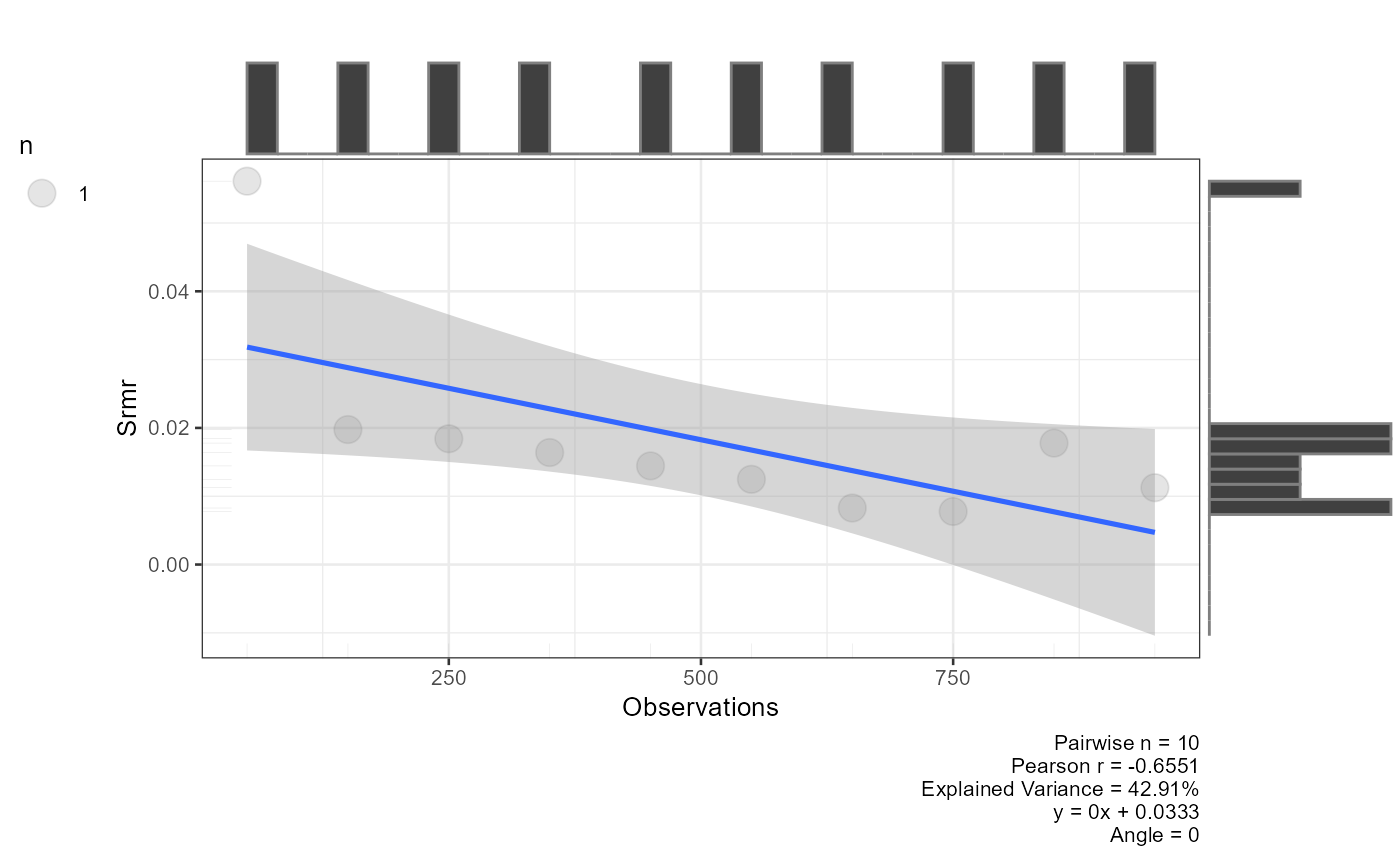
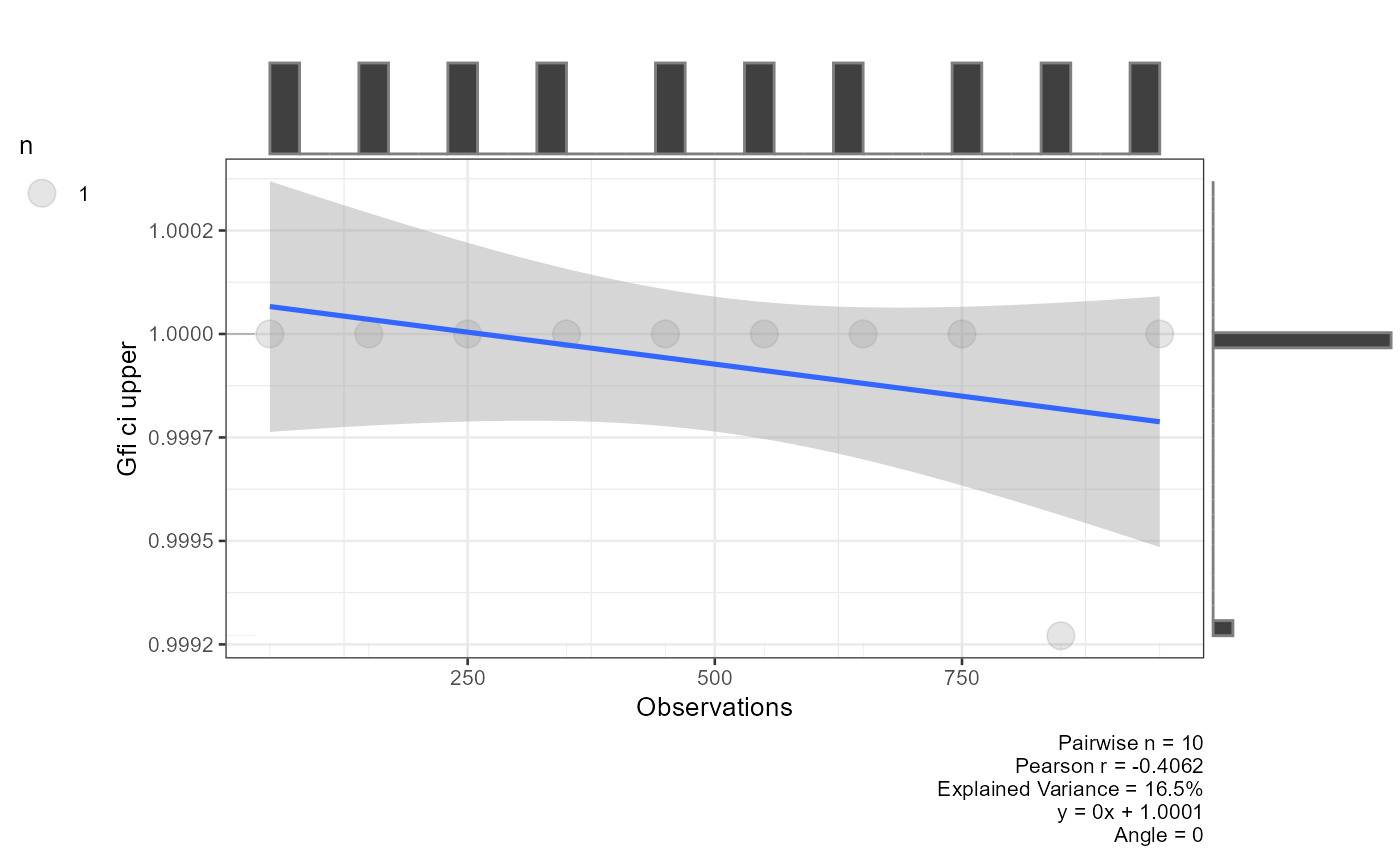
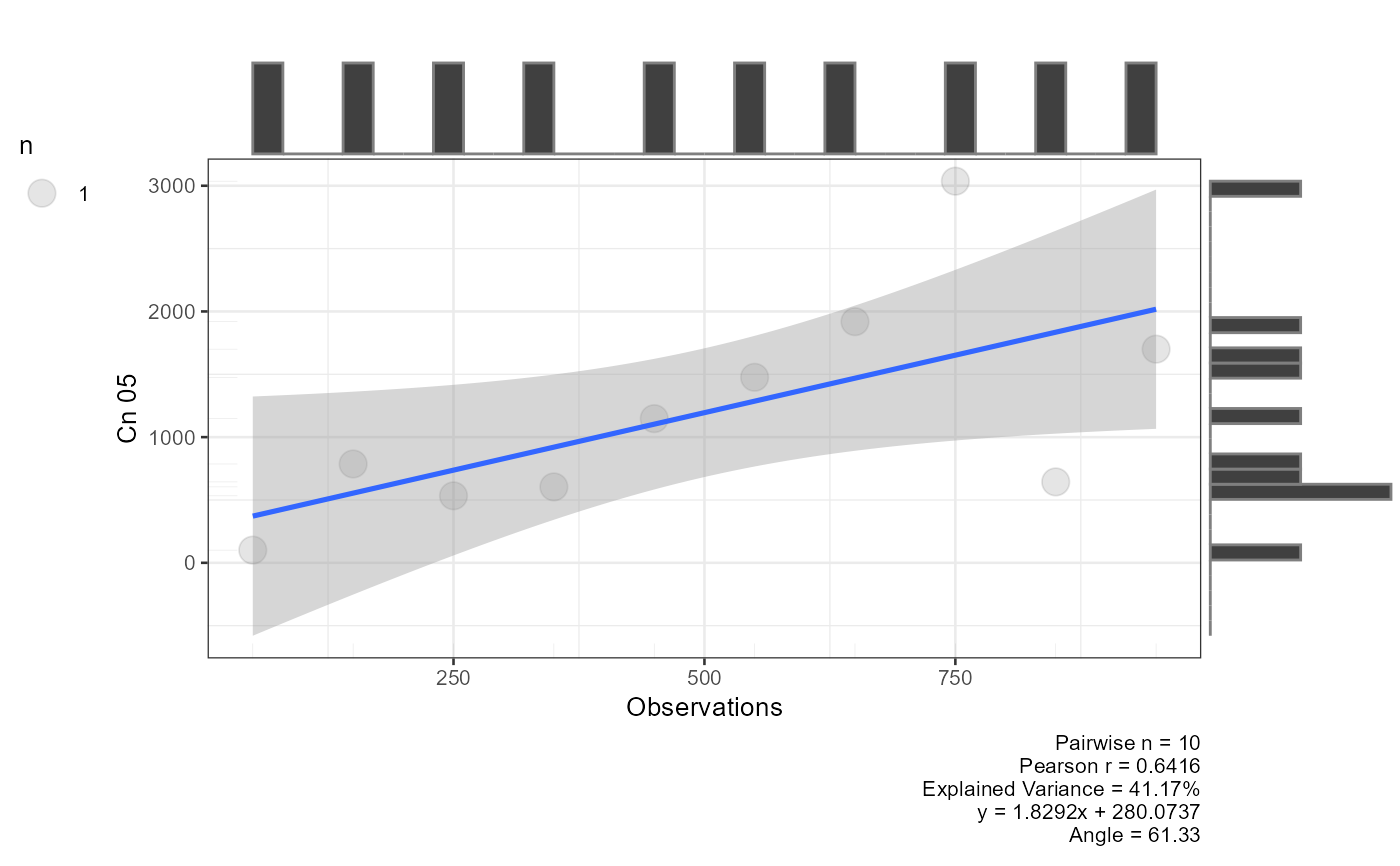
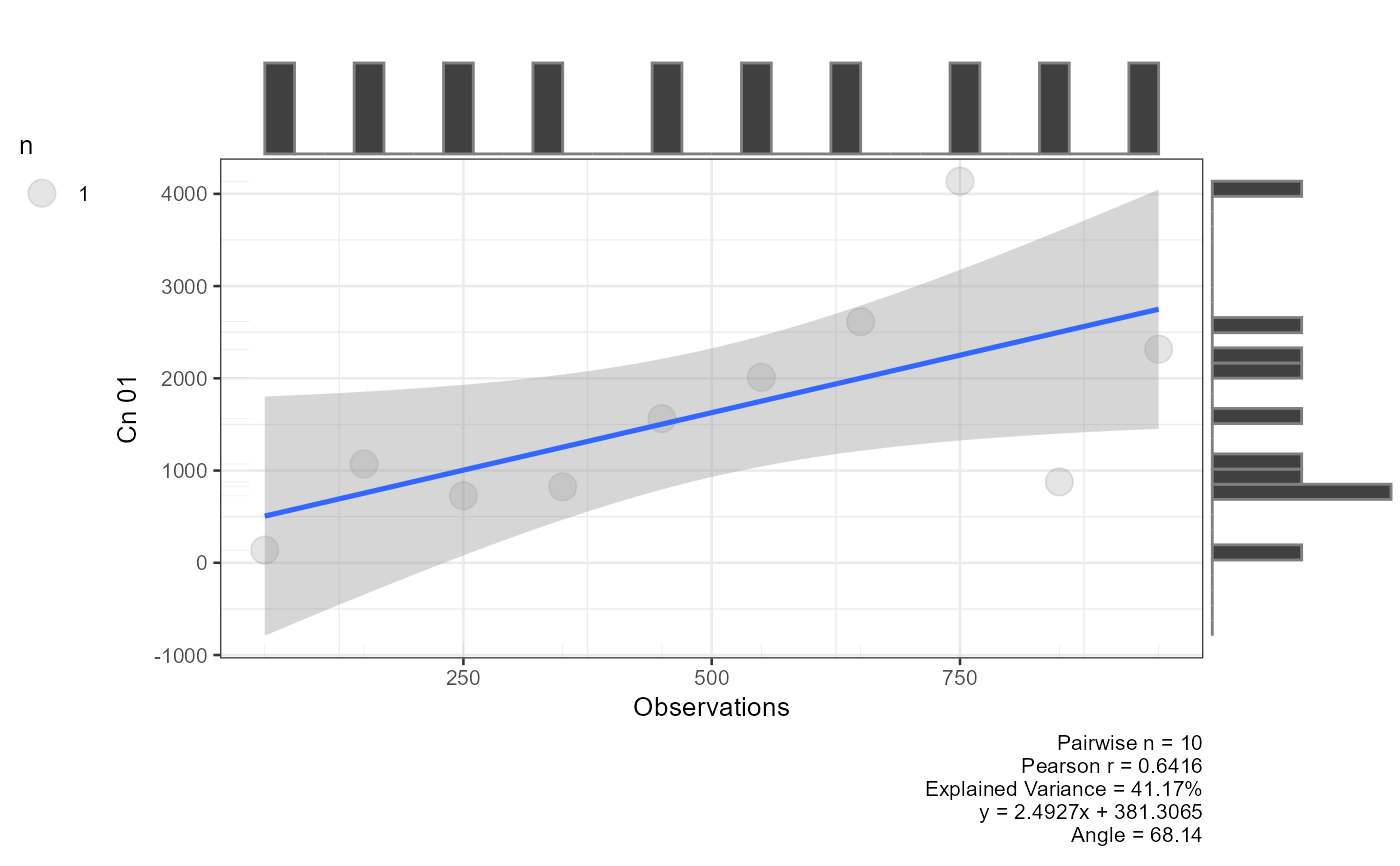
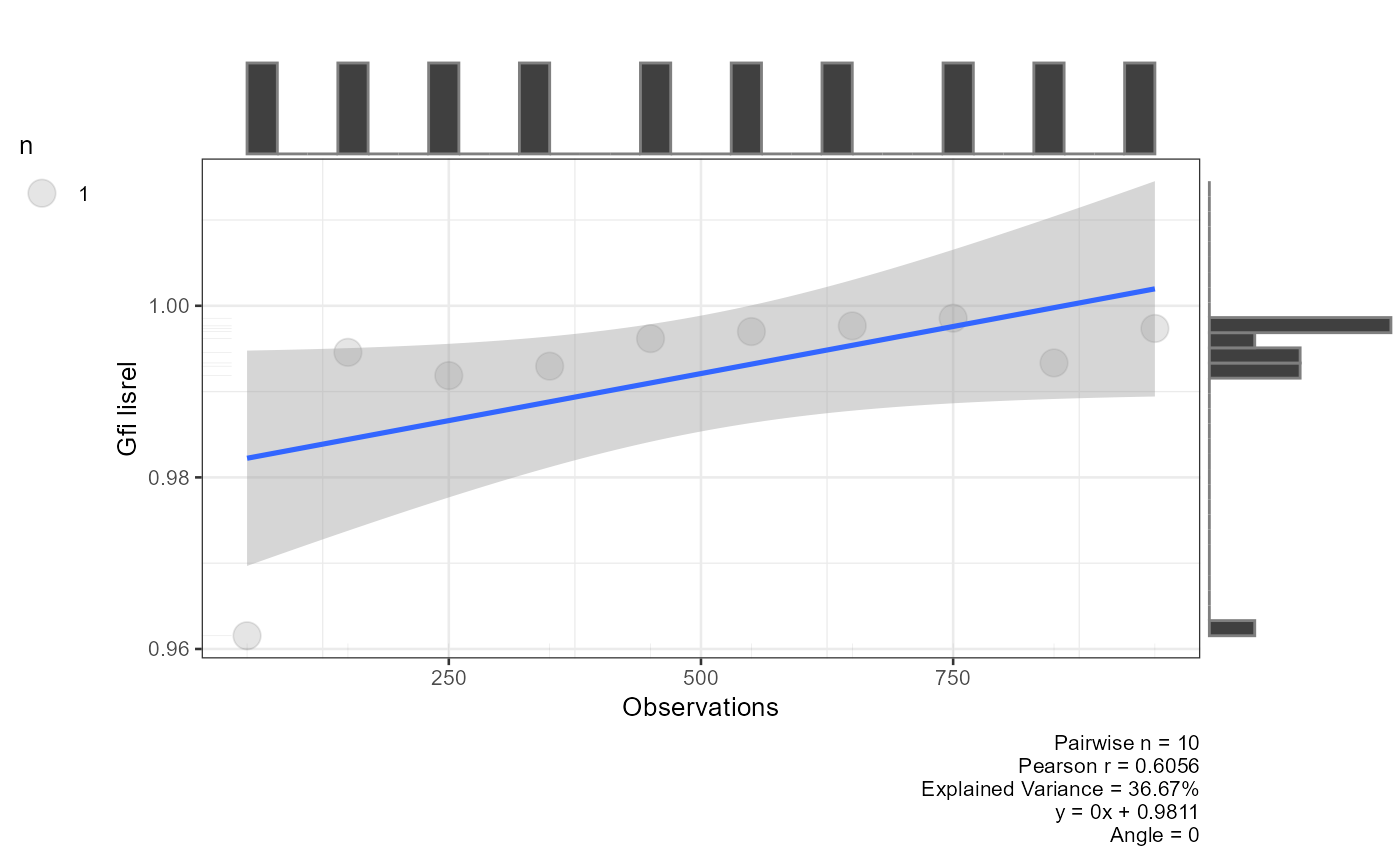
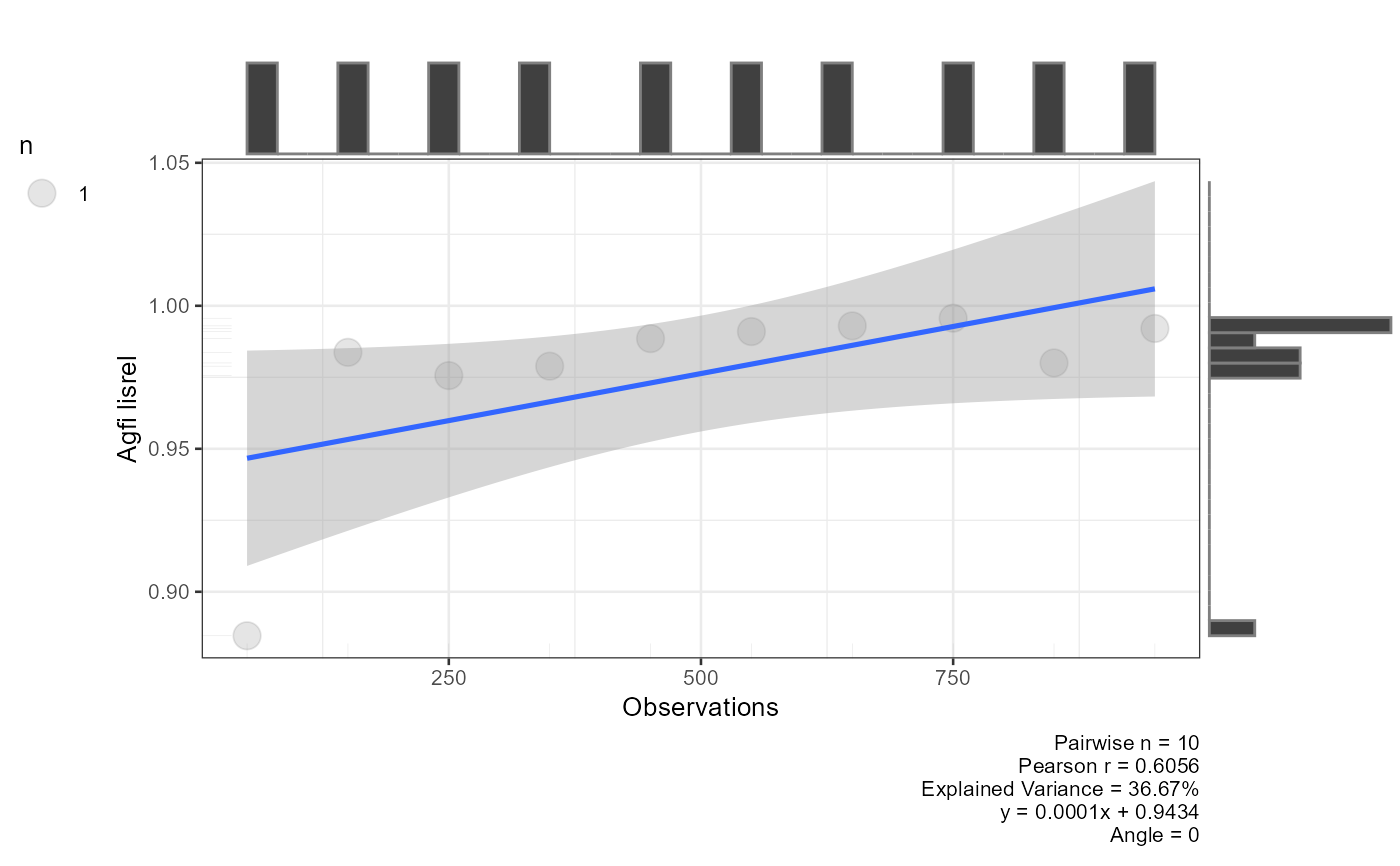
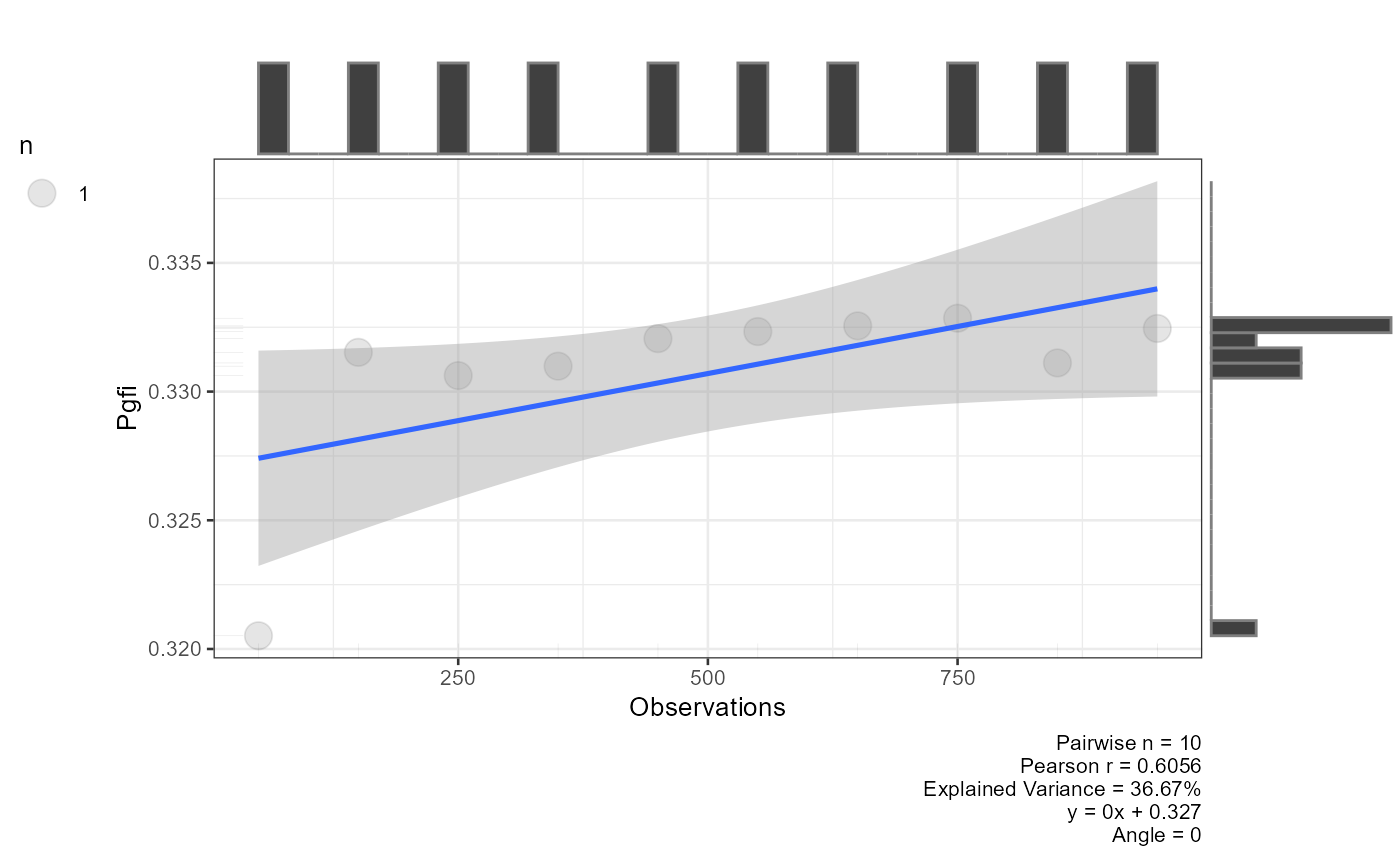
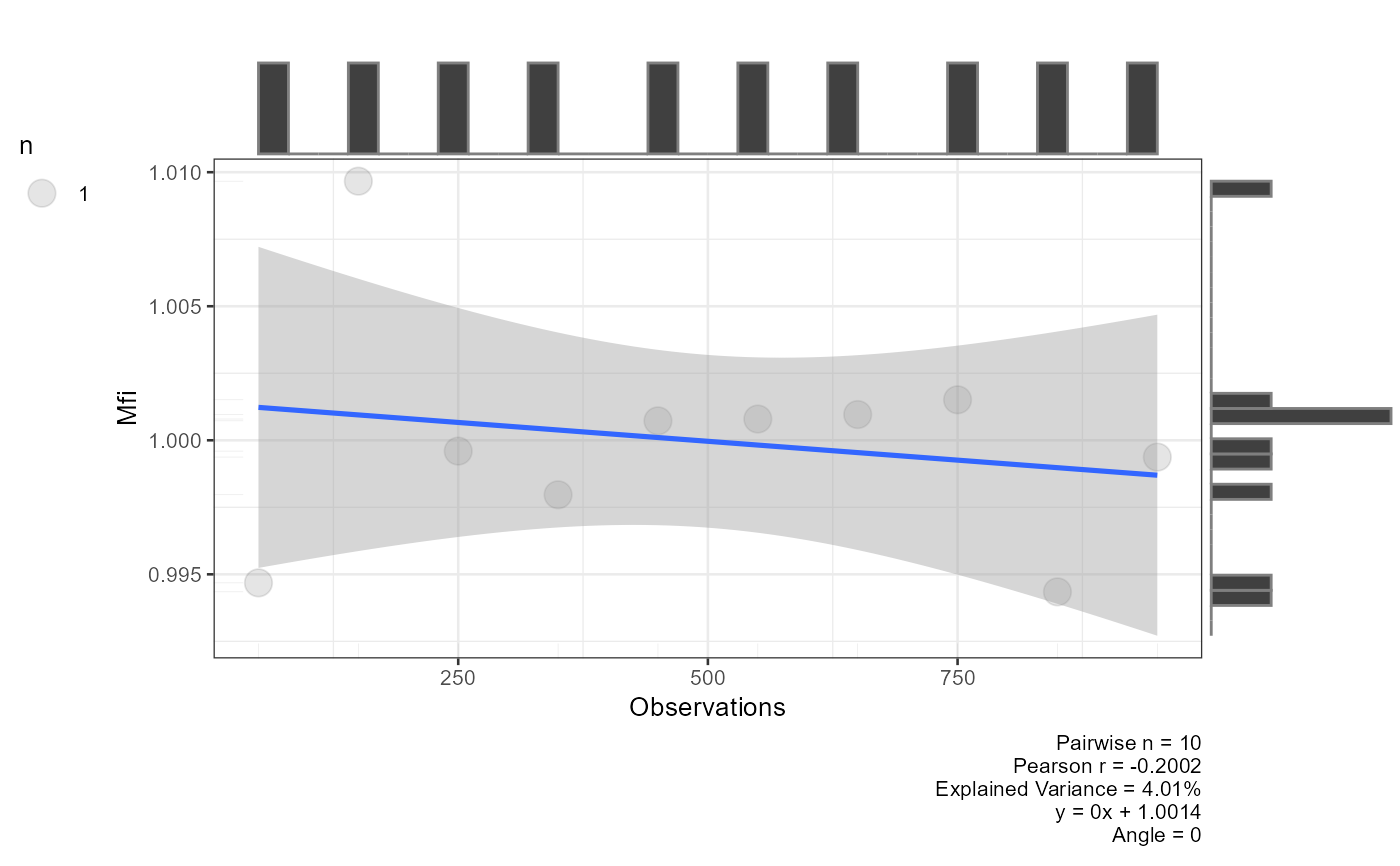
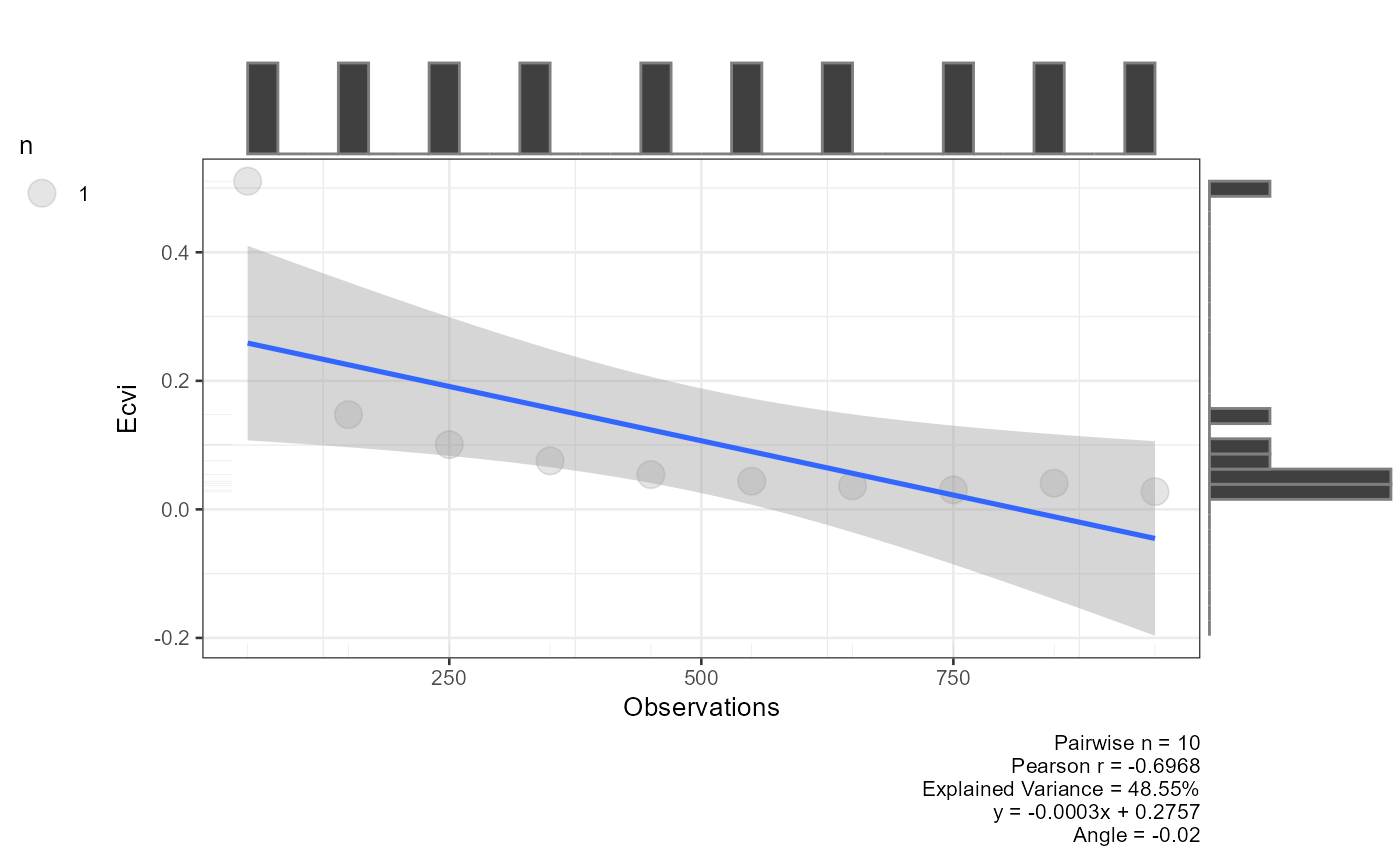 plot_multiplot(plotlist=result[[2]], cols=4)
 # Correlation-based: resample from observed data
df <- lavaan::simulateData(model=model_sim, model.type="cfa",
return.type="data.frame", sample.nobs=1000)
result<-simulate_cfa_fit(model=model, df=df,
minnobs=50, maxnobs=10000, stepping=100, file="report")
 plot_multiplot(plotlist=result[[2]], cols=4)