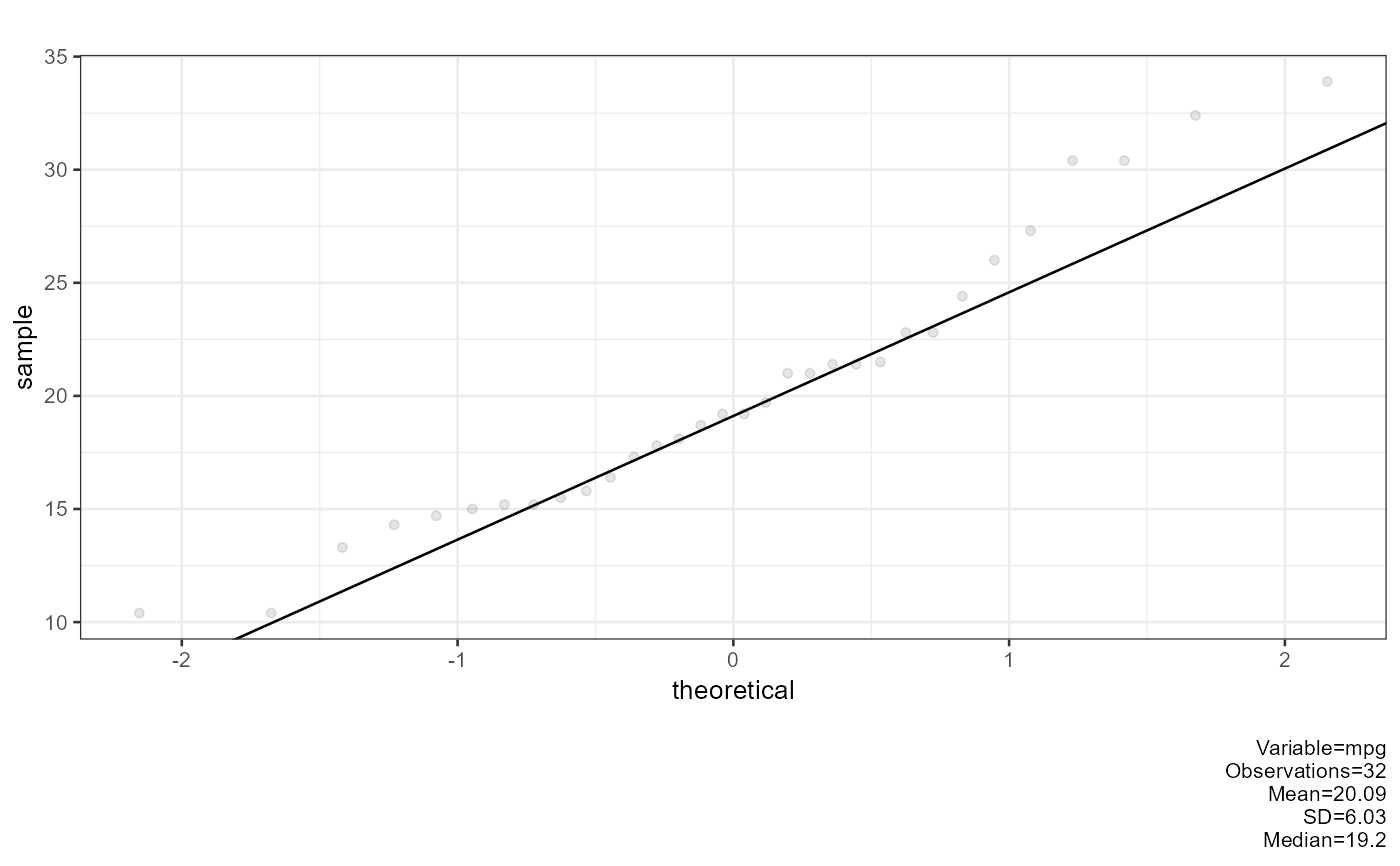
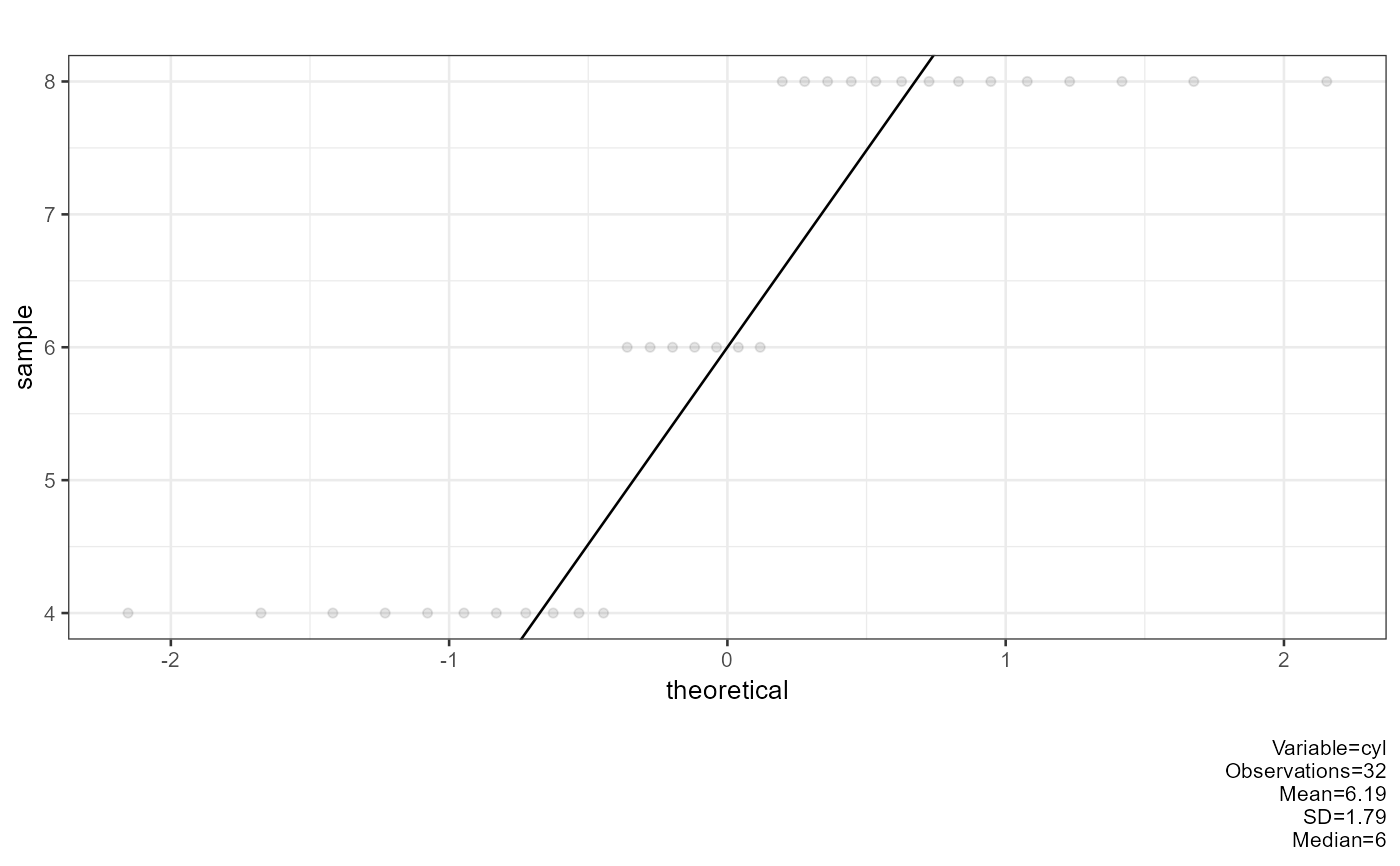
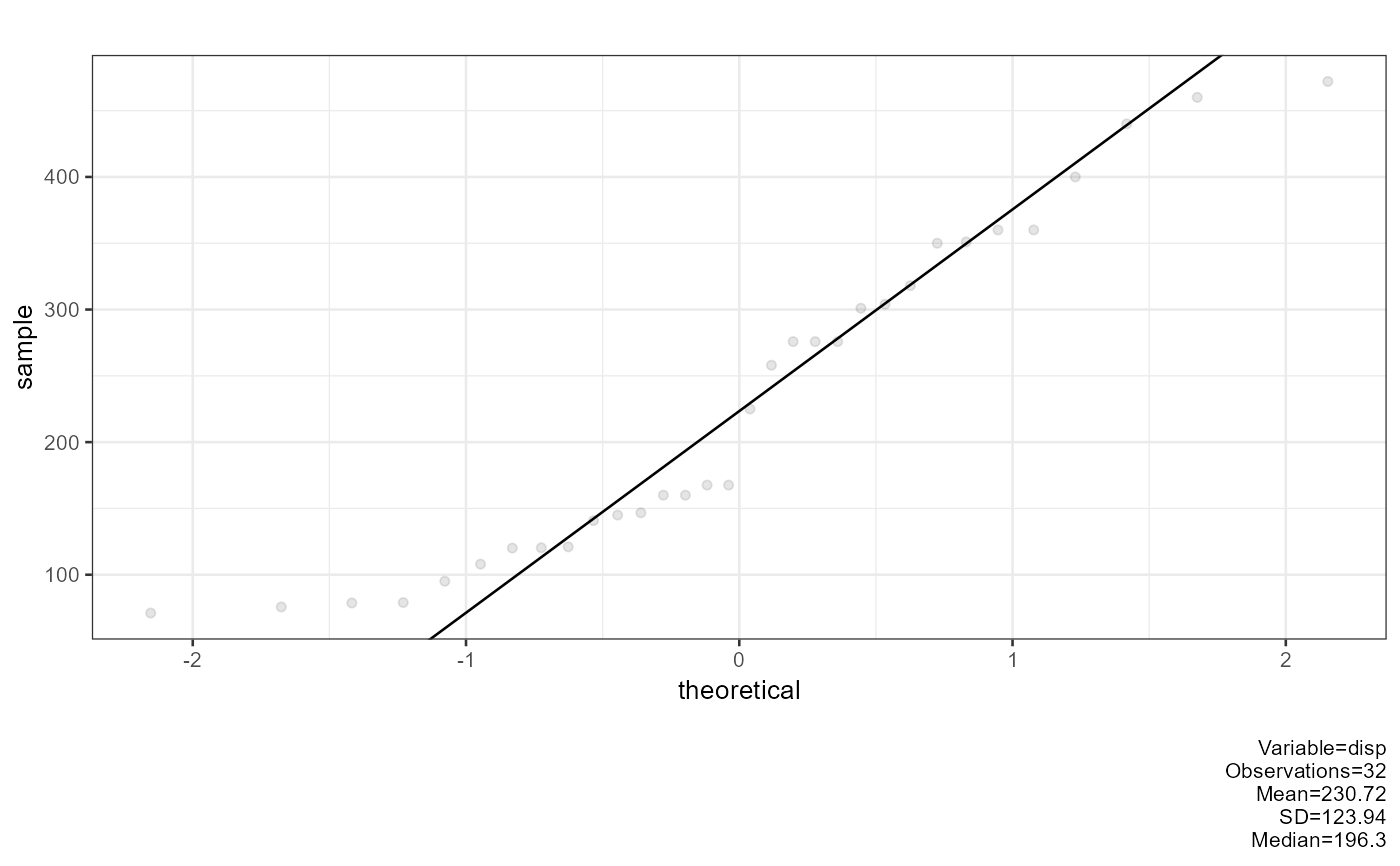
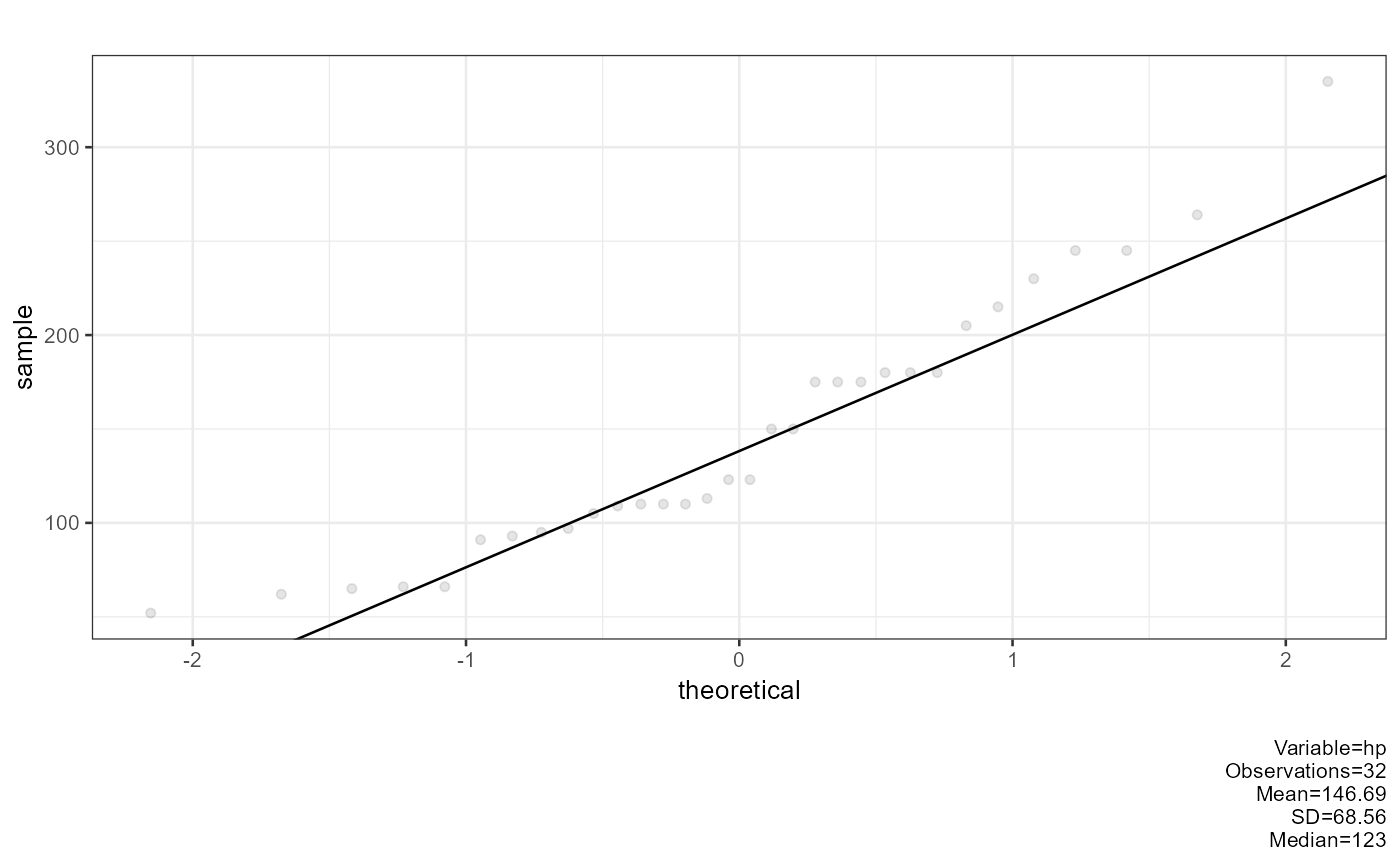
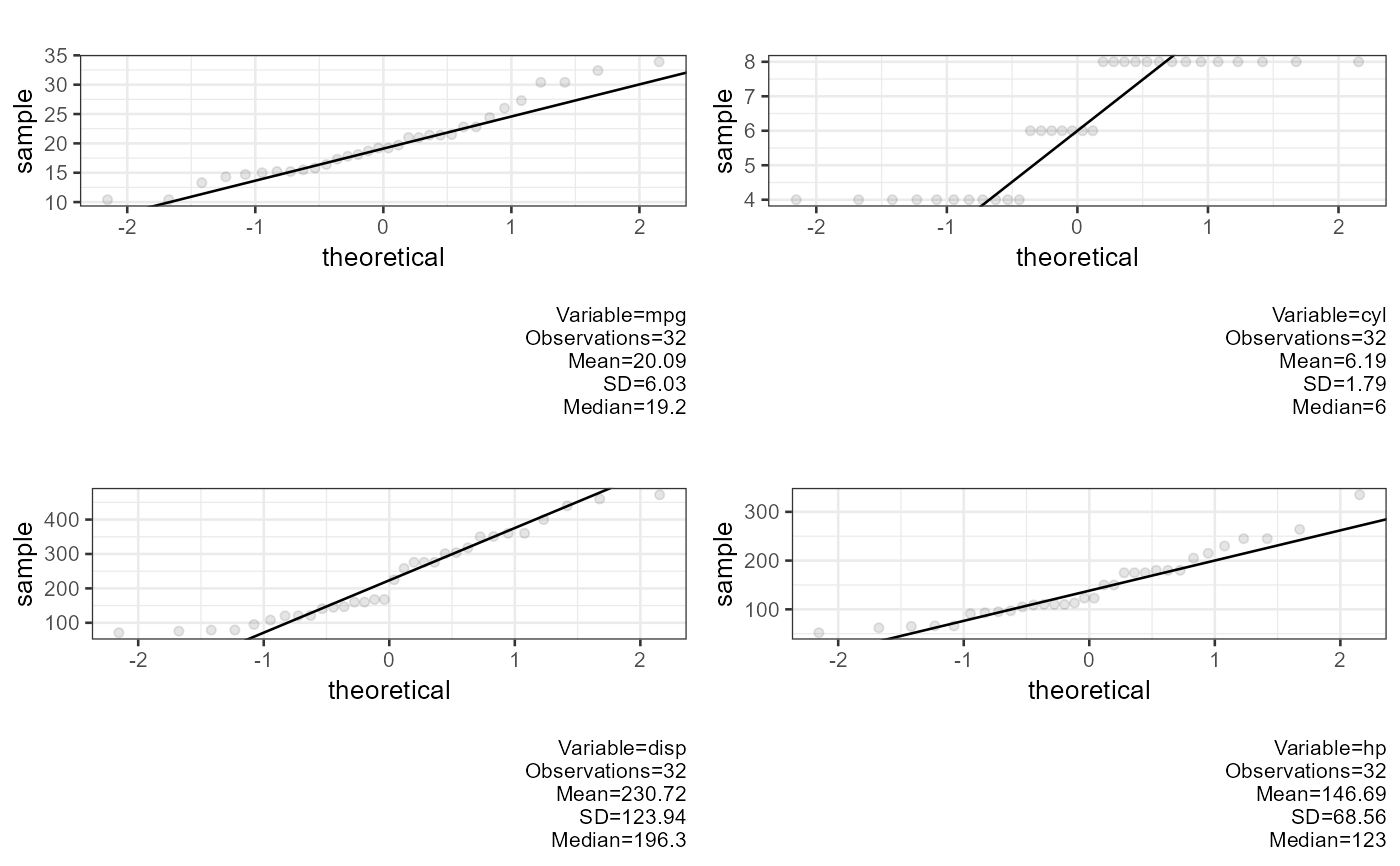
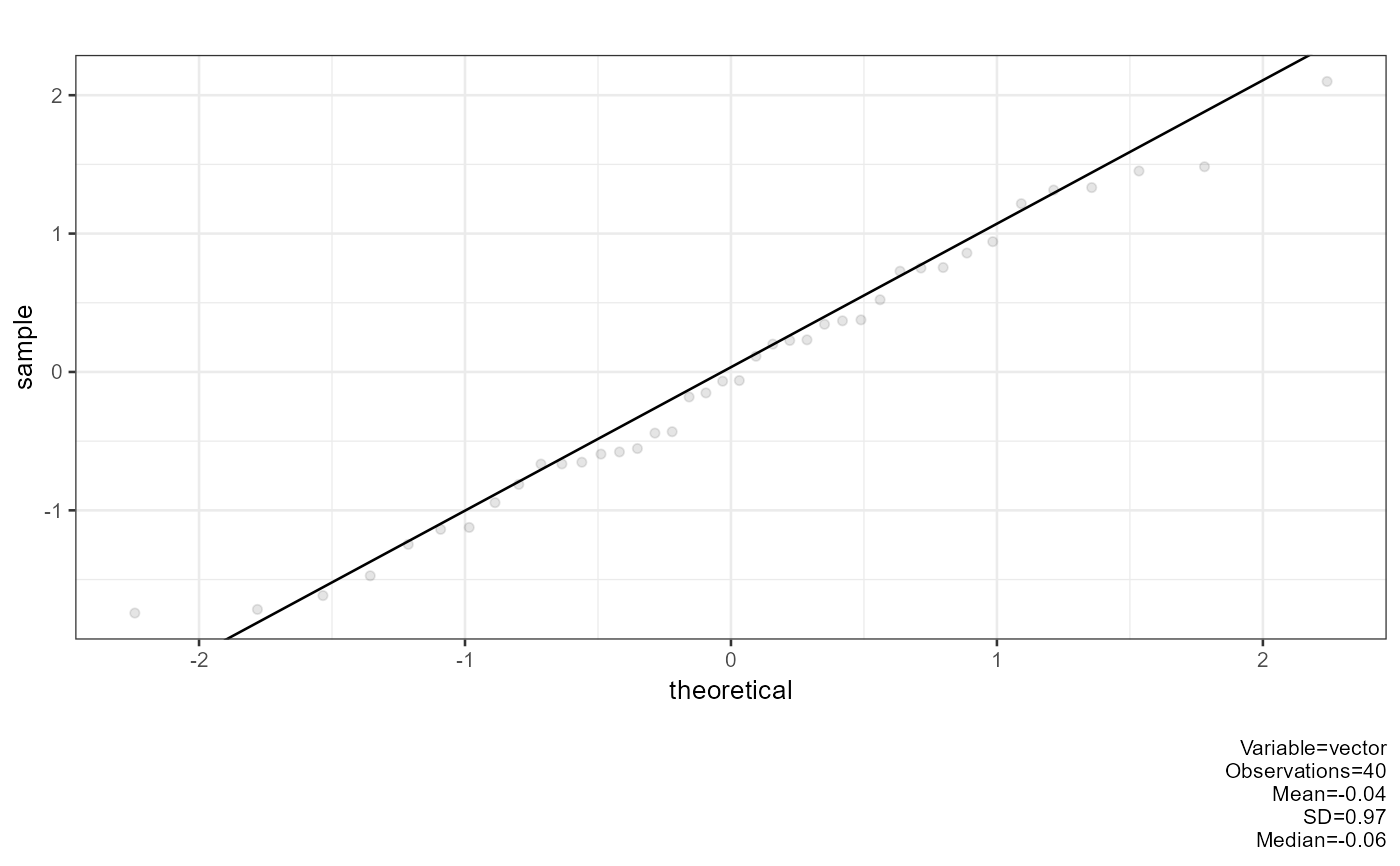
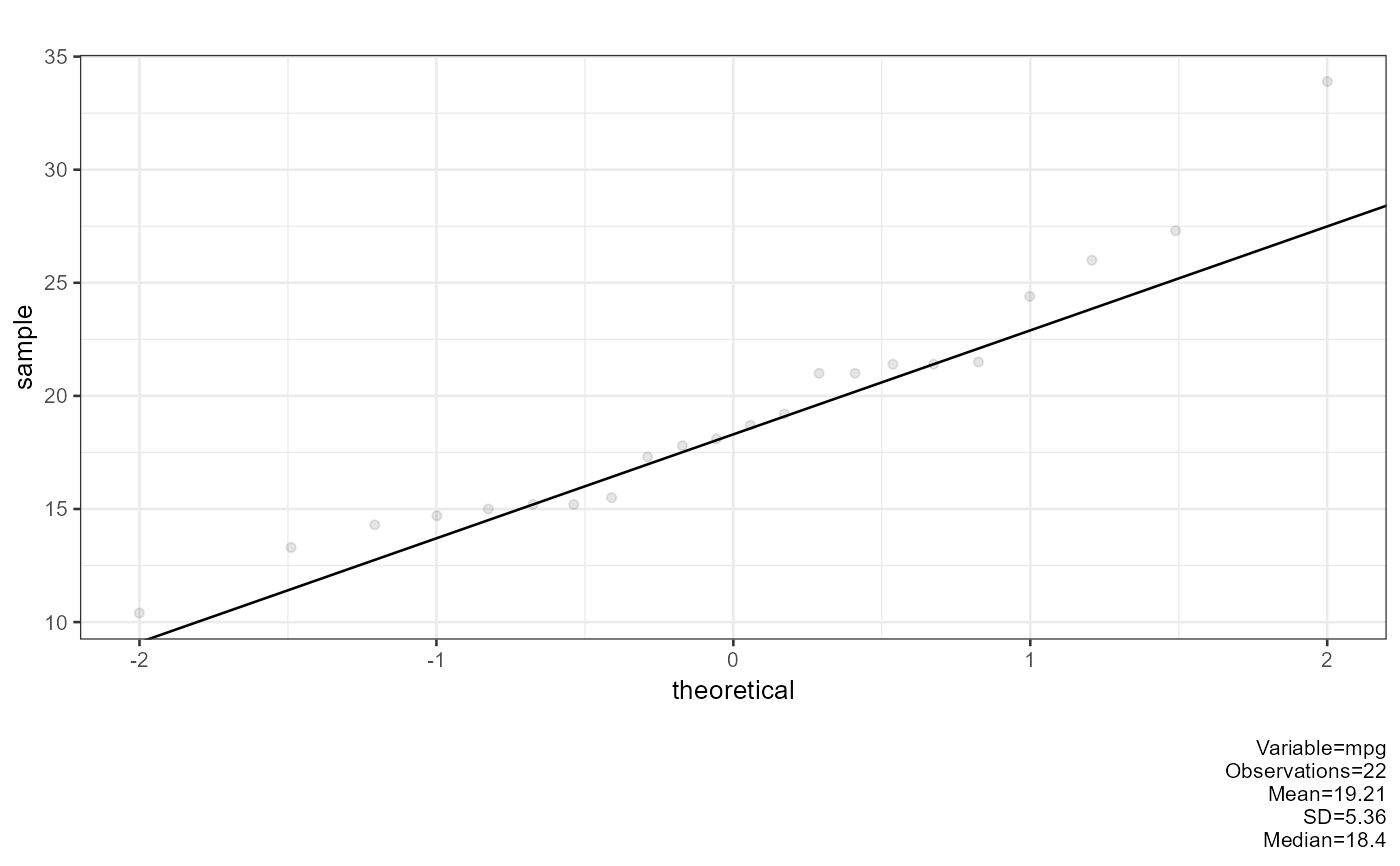
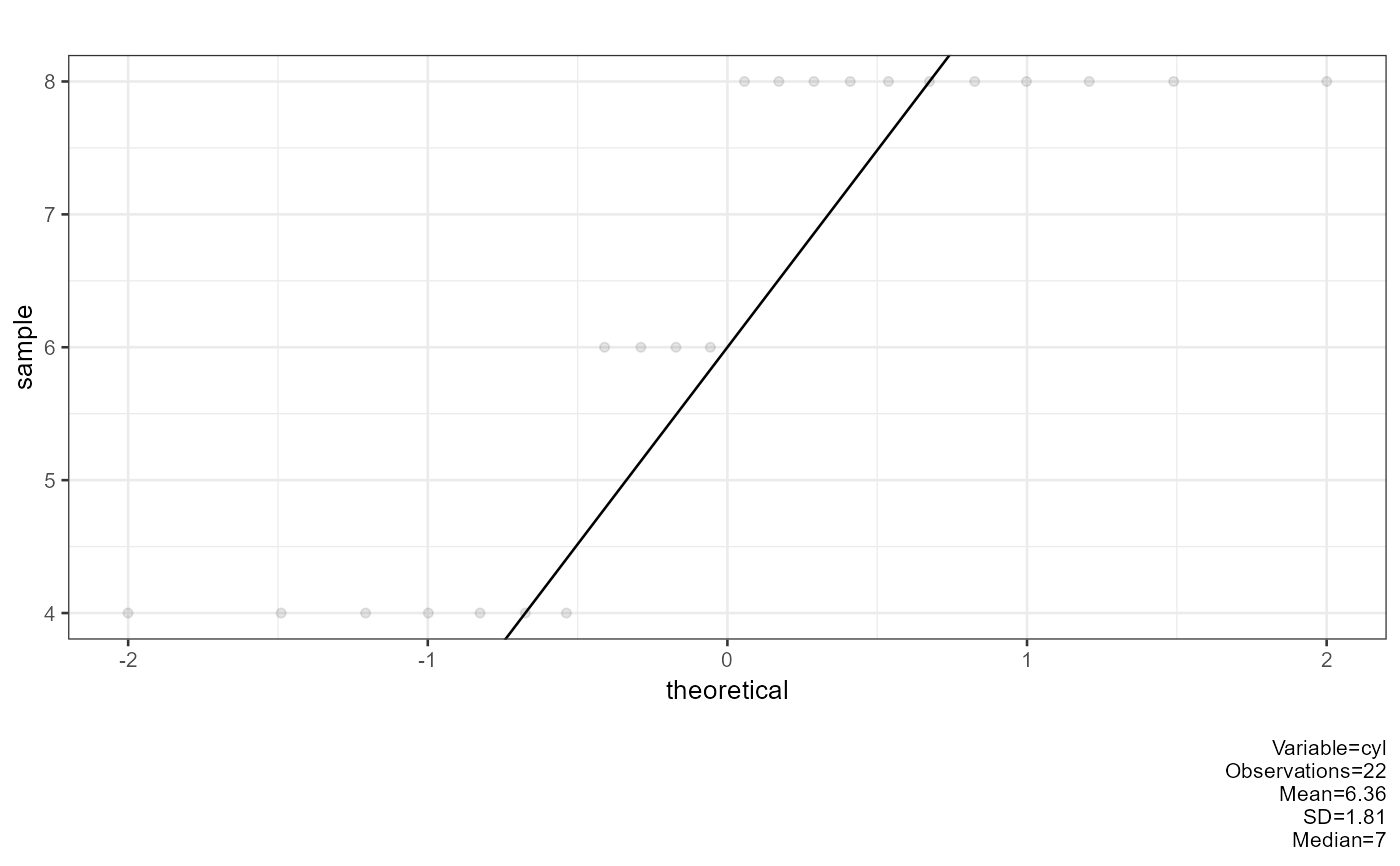
Produces one quantile-quantile plot per numeric column of
df, comparing the empirical distribution to the theoretical normal.
A reference line is fitted through the 25th and 75th percentiles (the same
convention used by stats::qqline()). Non-numeric columns are
skipped silently. A progress bar is printed to the console.
Examples
vector <- generate_missing(rnorm(50), missing = 10)
df <- generate_missing(mtcars[, 1:2], missing = 10)
plot_qq(df = vector)
 plot_qq(df = df)
 plot_multiplot(plotlist = plot_qq(df = mtcars[,1:4]), cols = 2)