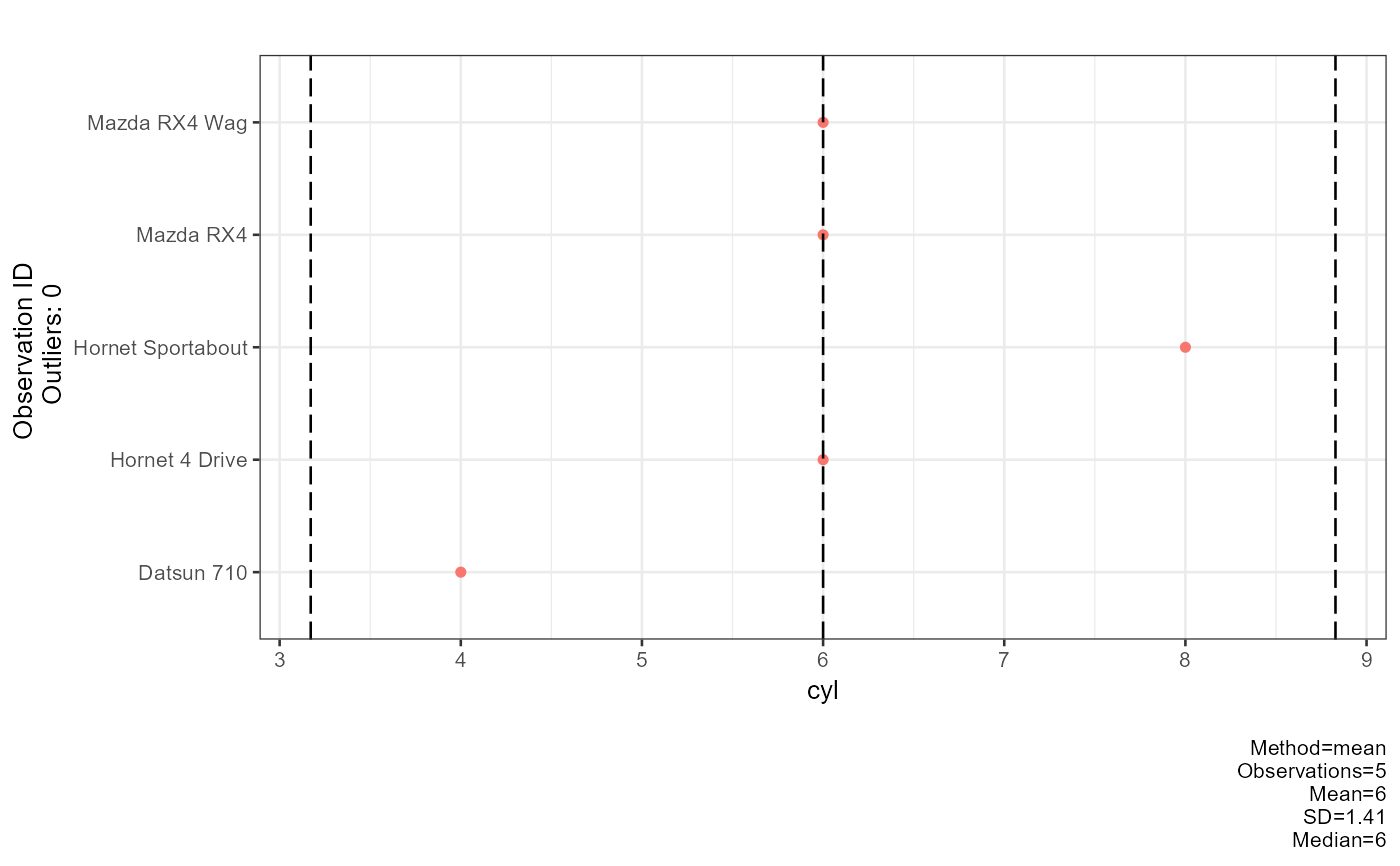
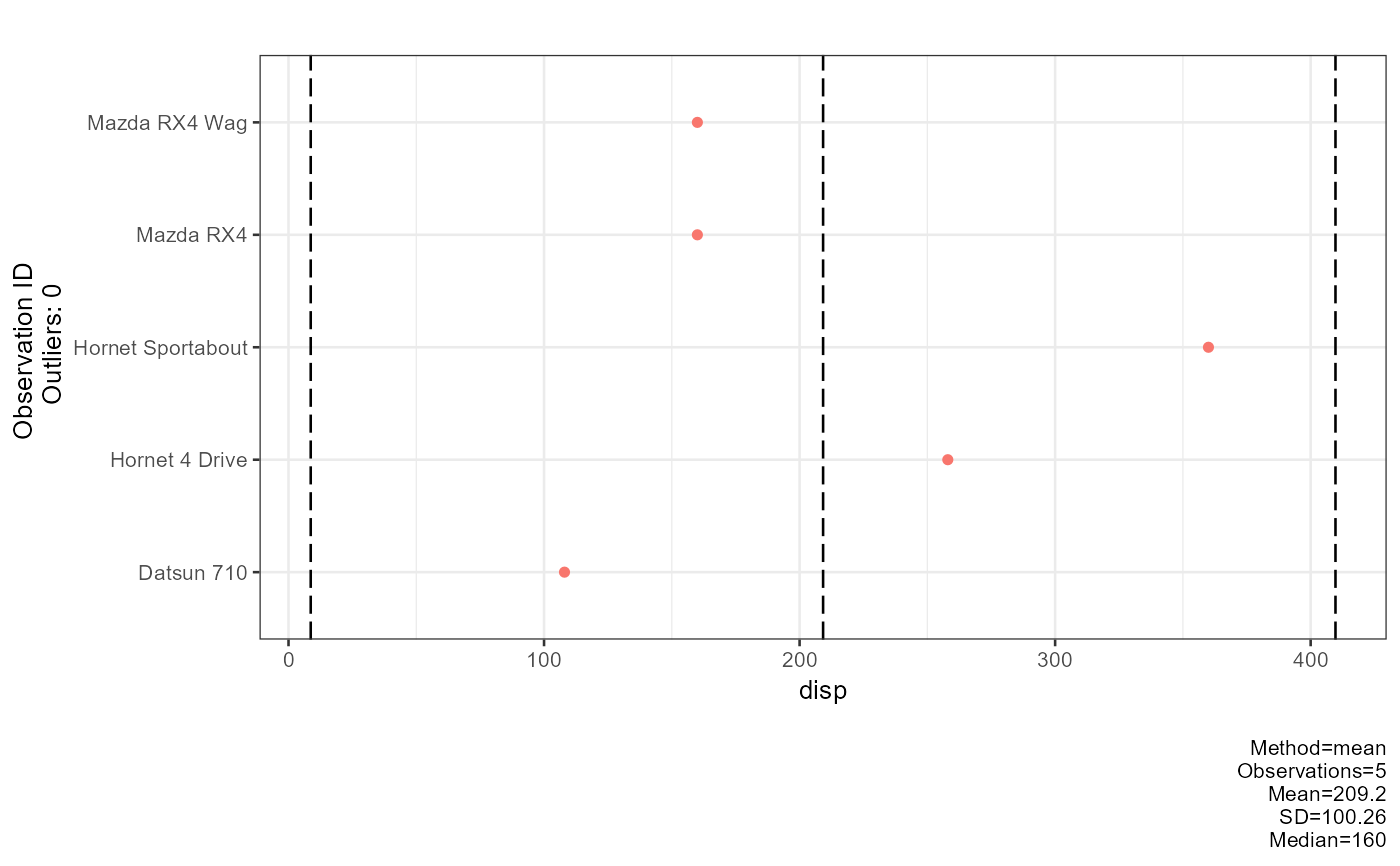
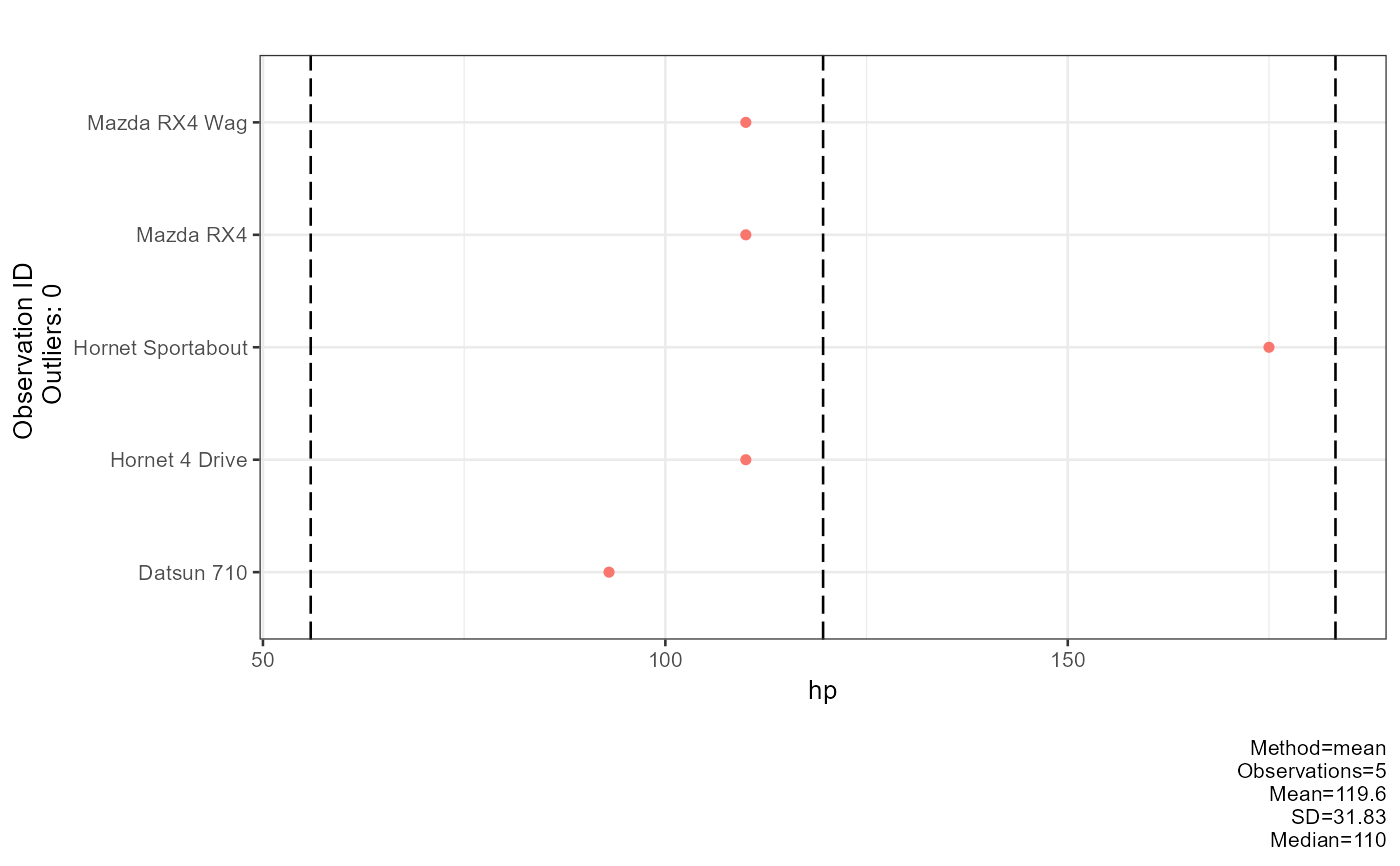
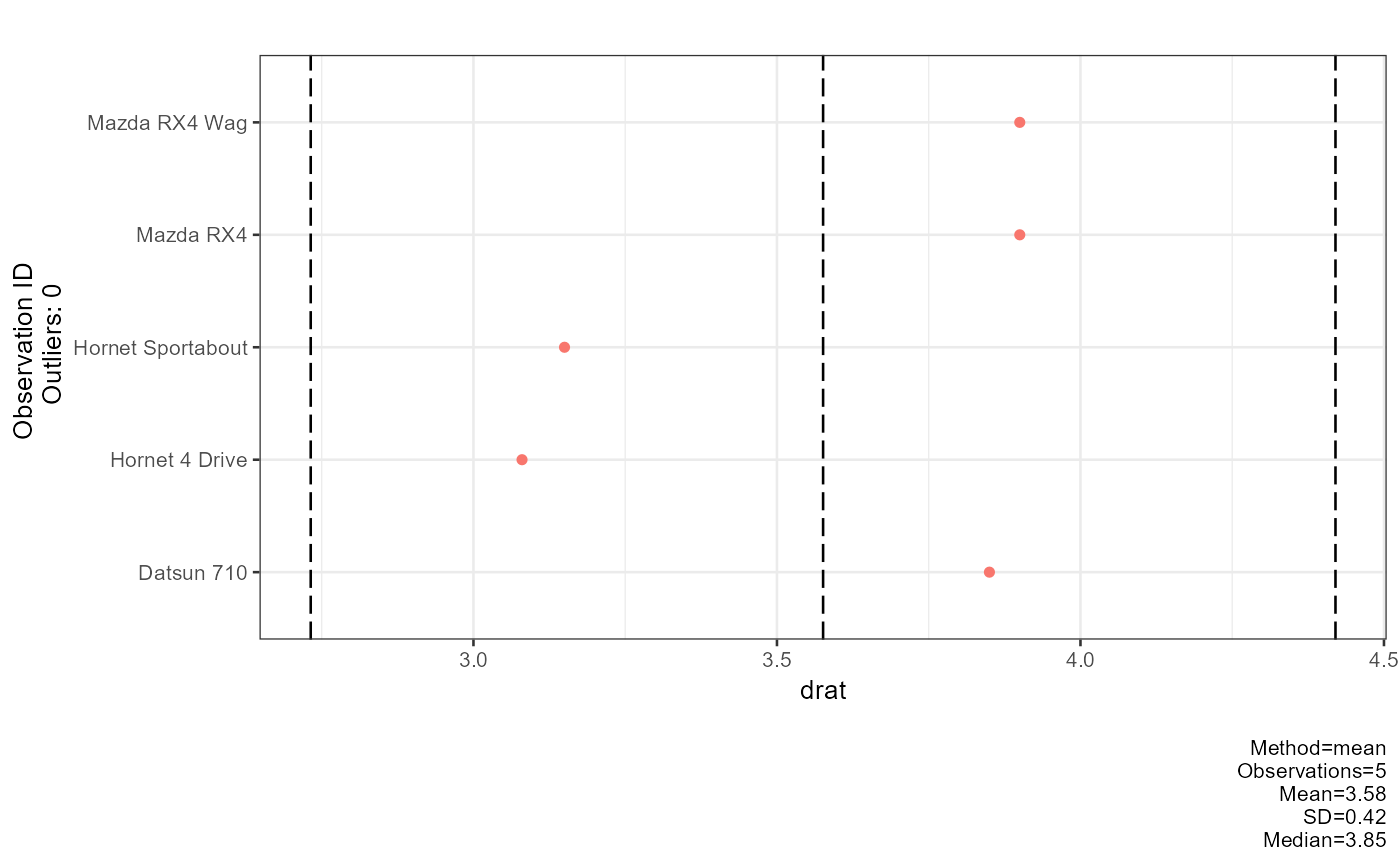
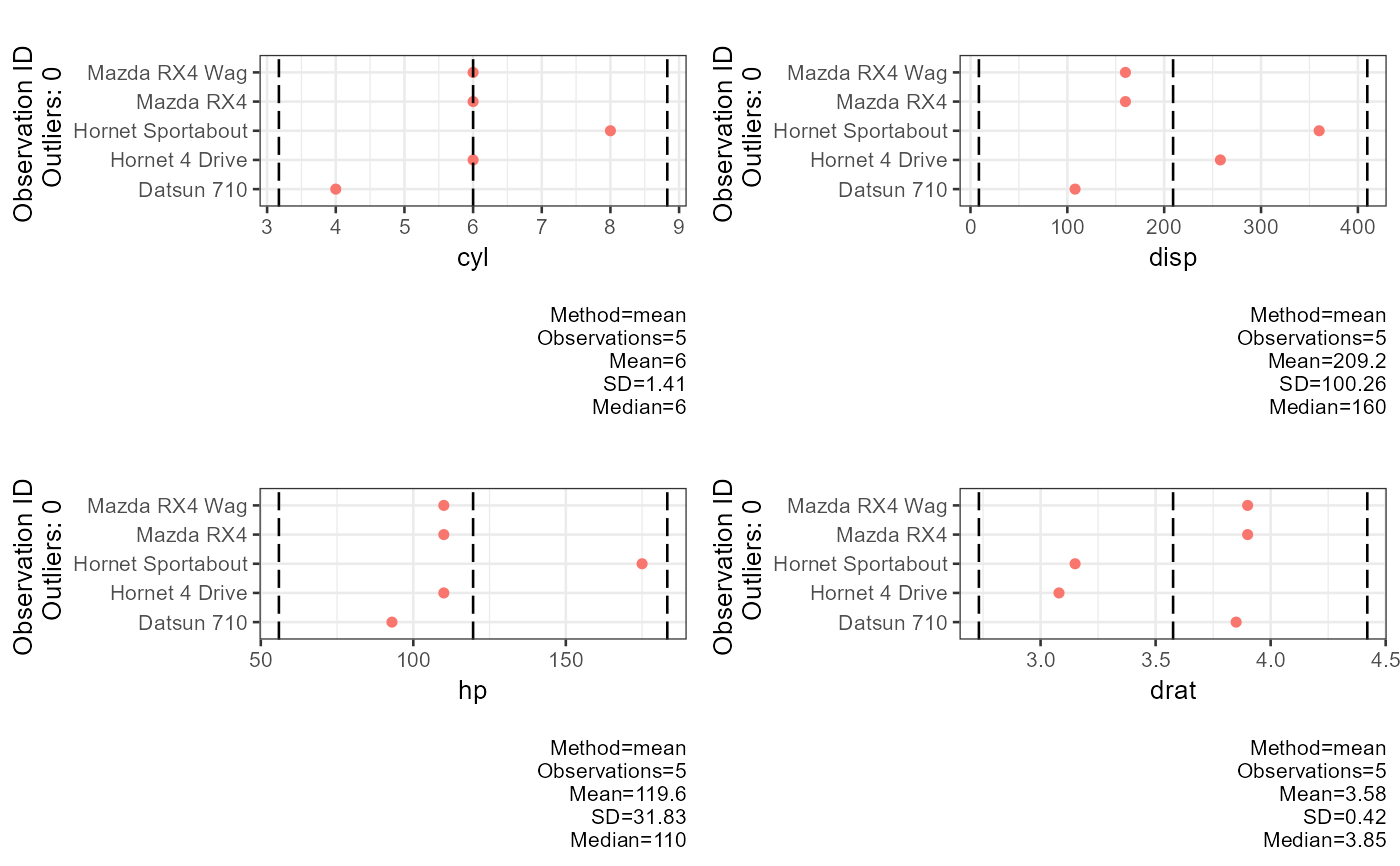
For each numeric column of df, draws a dot plot with
observations coloured by outlier status and row-name labels repelled away
from flagged points. Three outlier-detection rules are available via
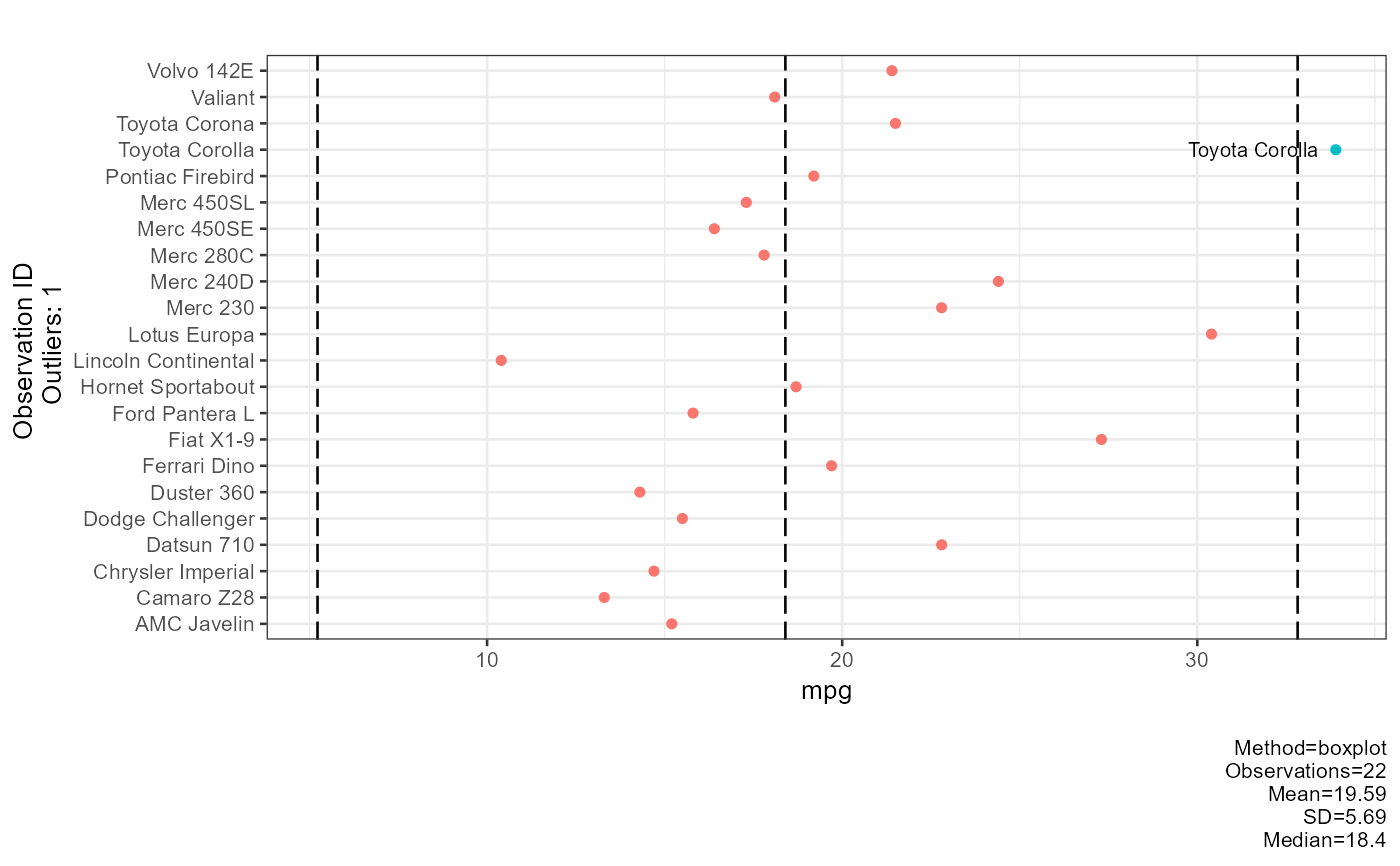
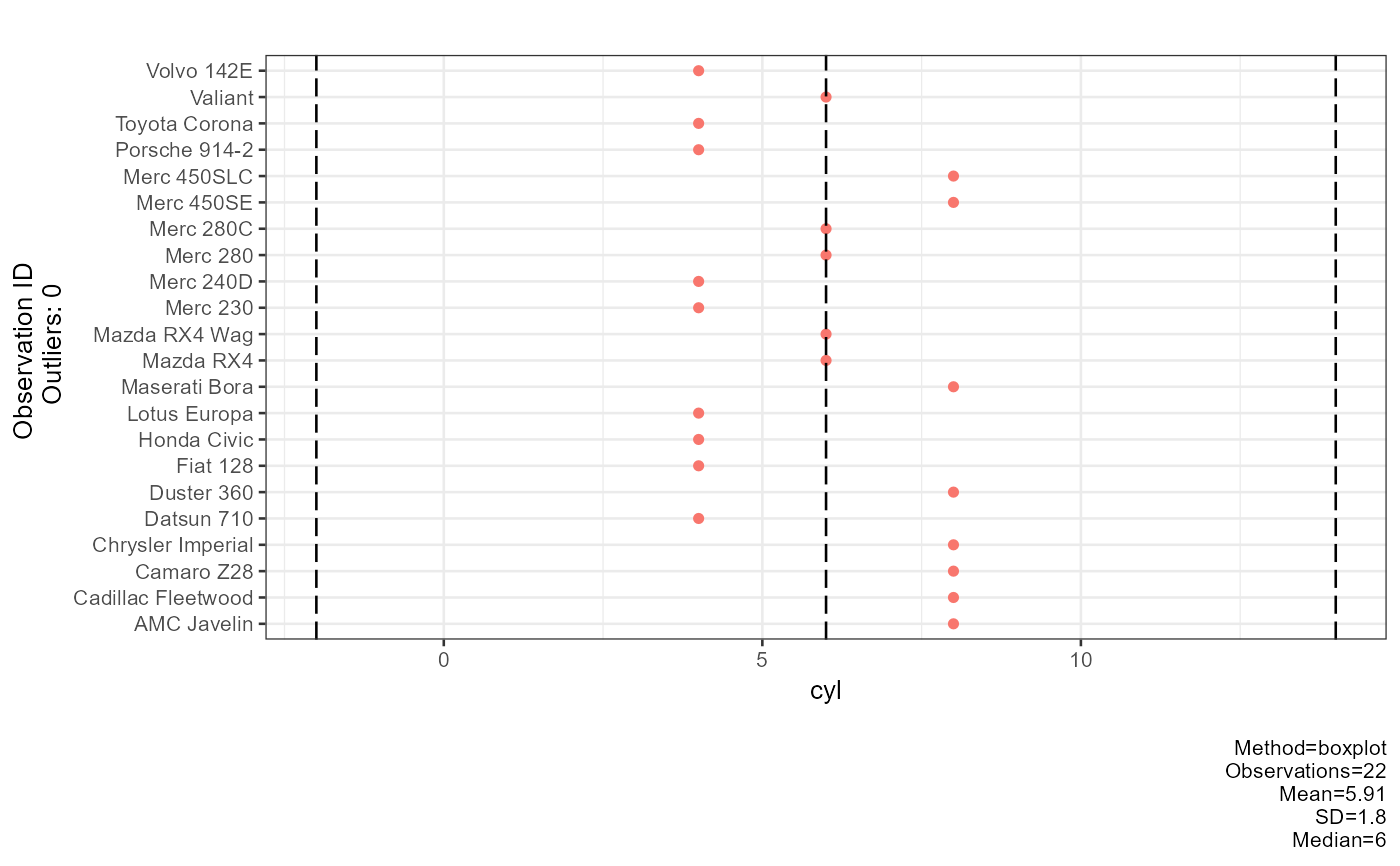
method: mean ± 2 SD, median ± 2 MAD (rescaled), or boxplot IQR
fences. Reference lines for the centre and the upper / lower bounds are
overlaid on each plot.
Arguments
- df
Data frame or numeric vector. Non-numeric columns are silently dropped.
- method
Character string selecting the outlier-detection rule:
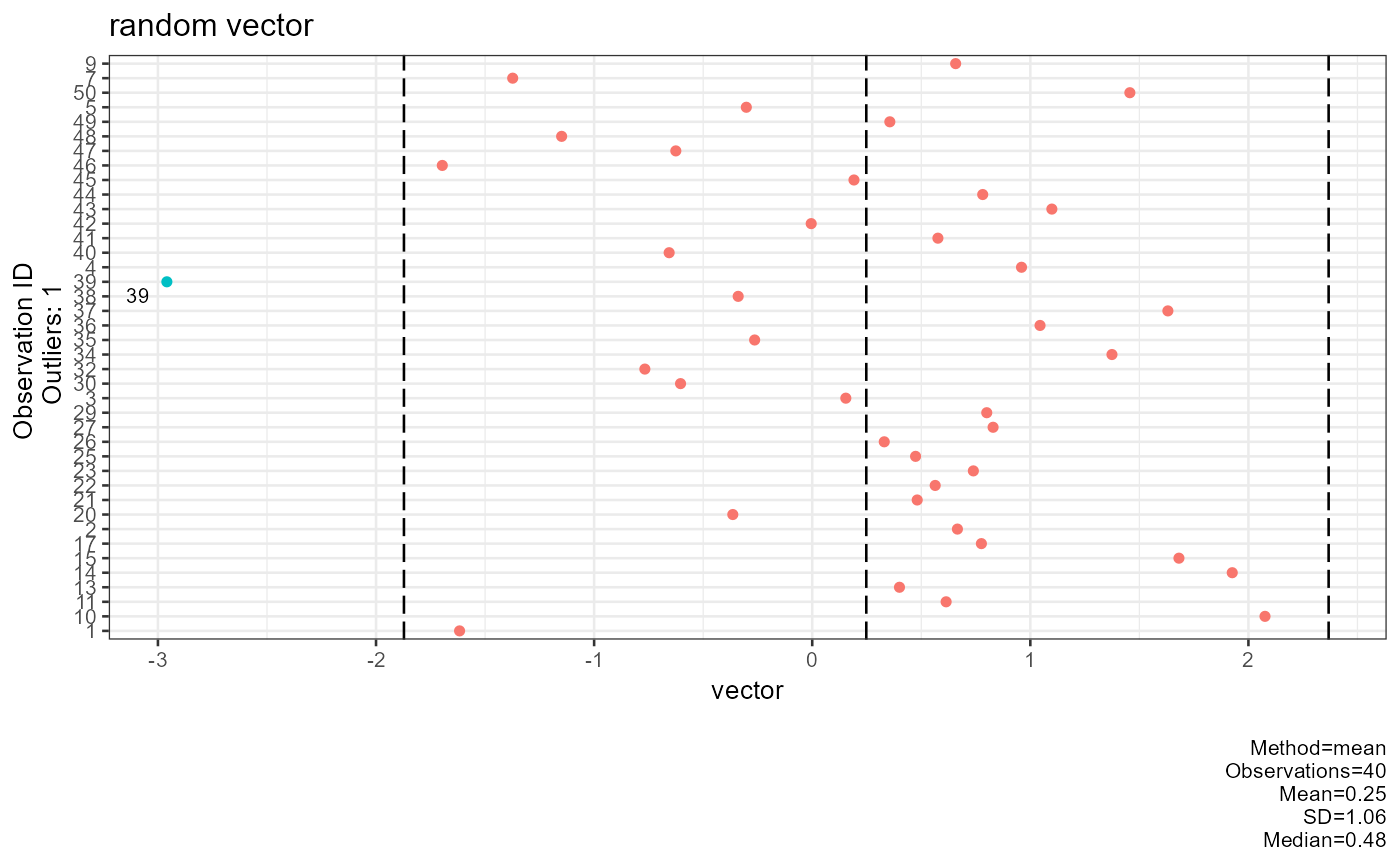
"mean"Flags observations more than 2 standard deviations from the mean.
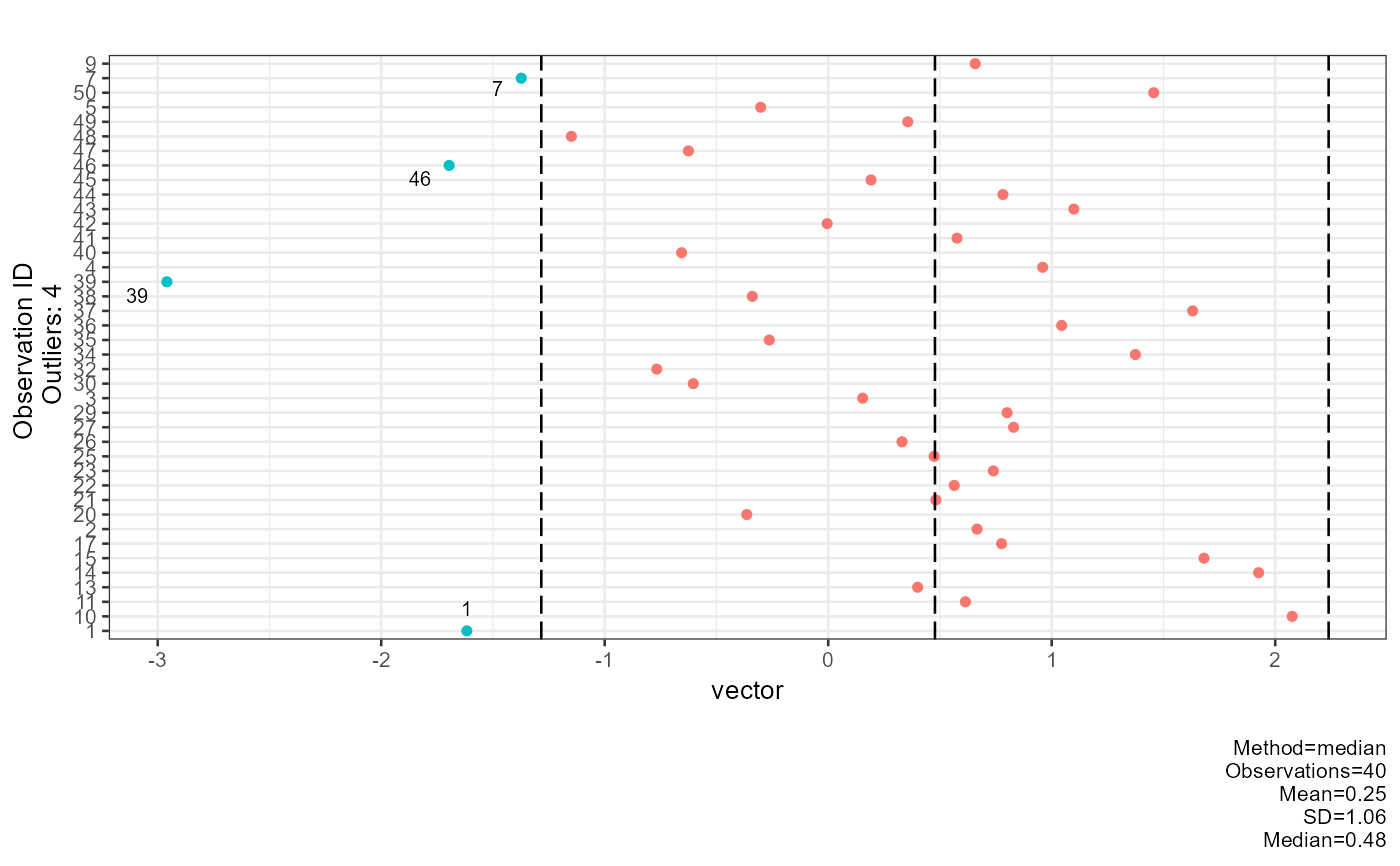
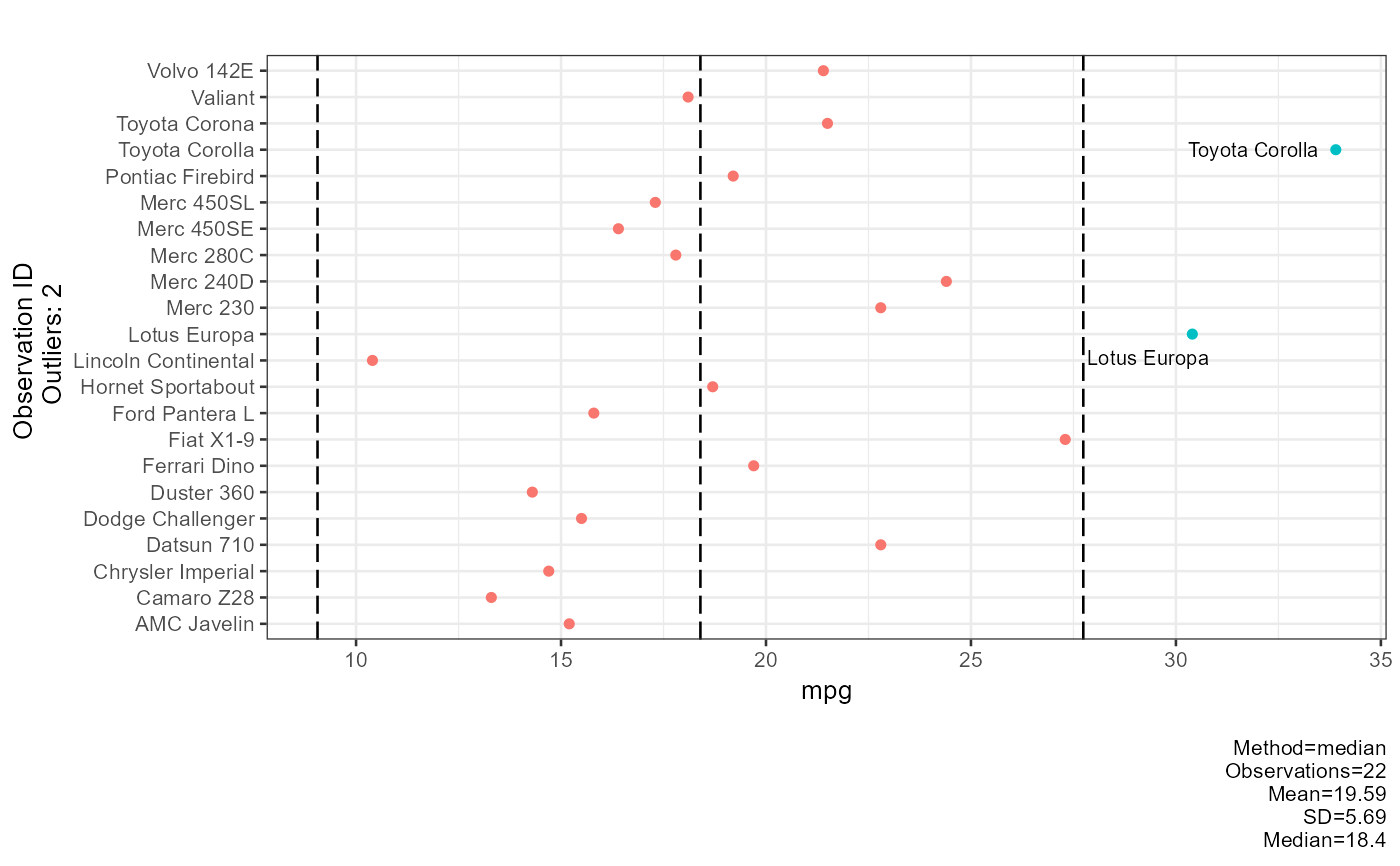
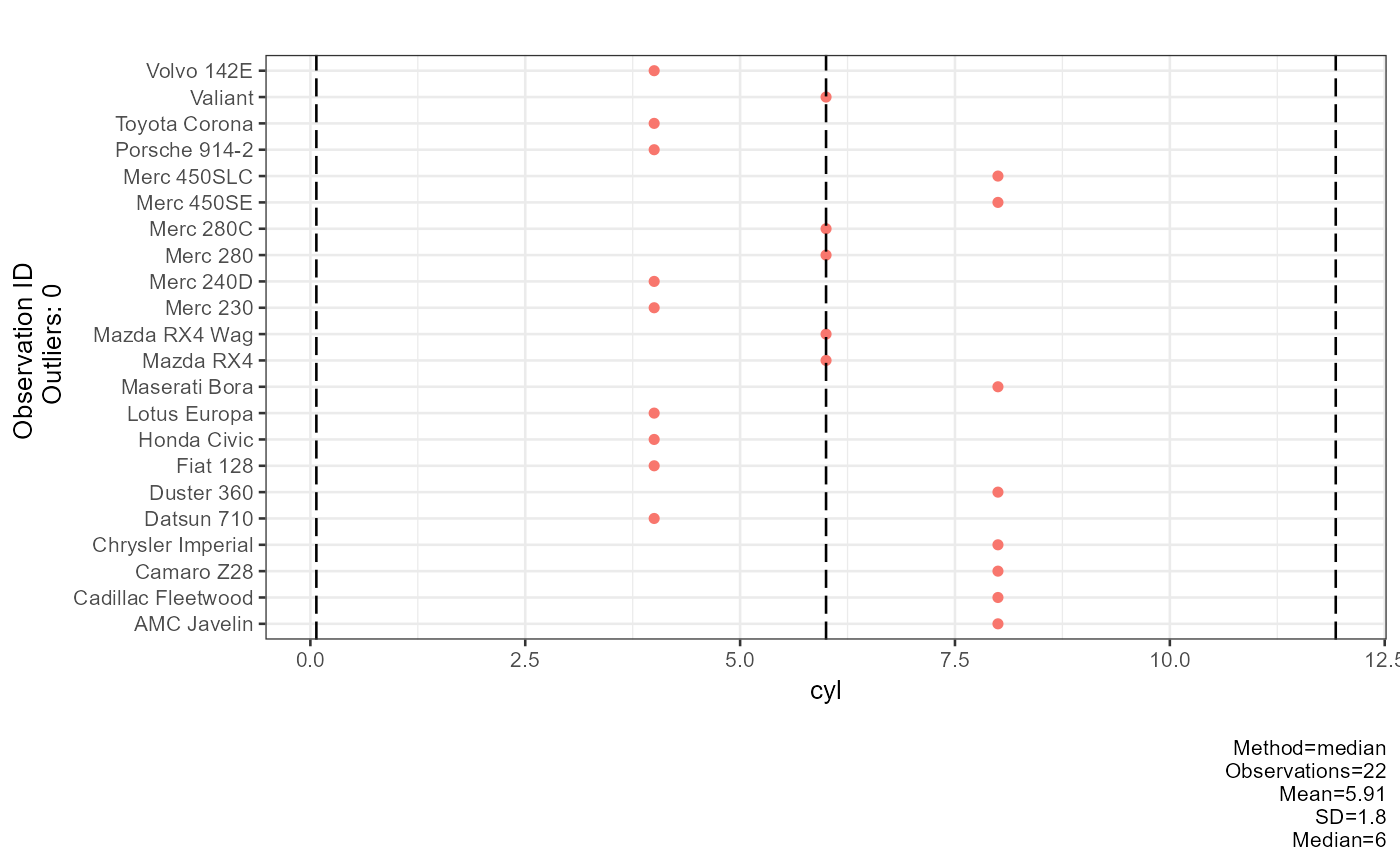
"median"Flags observations more than 2 rescaled MADs (\(2 \times \mathrm{MAD}/0.6745\)) from the median.
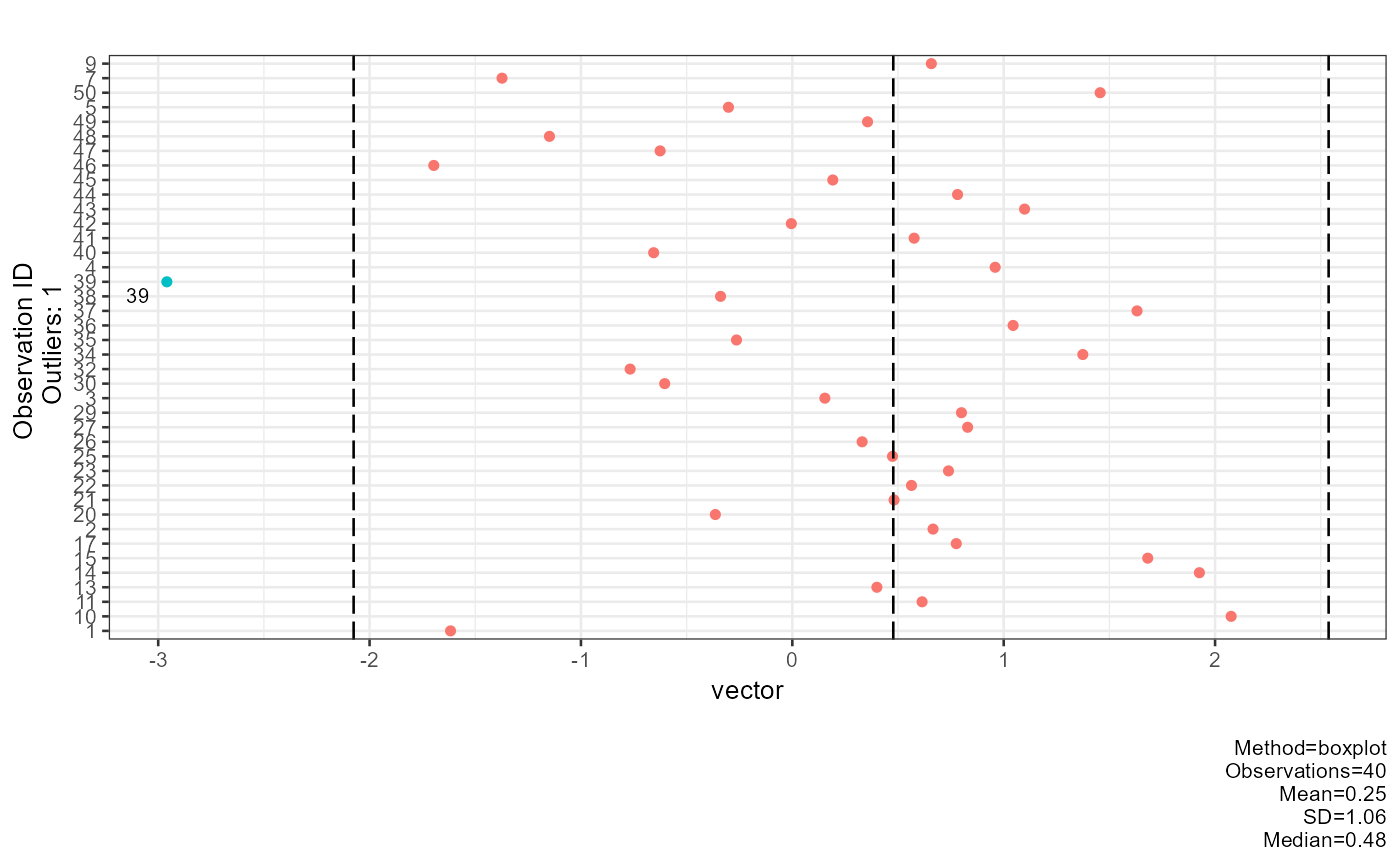
"boxplot"Flags observations outside \(Q1 - 1.5 \times IQR\) or \(Q3 + 1.5 \times IQR\).
Default is
"mean".- title
Character string used as the plot title. Default is
"".- base_size
Base font size passed to
theme_bw(). Default is10.- pb
Logical; whether to display a progress bar in the console. Default is
FALSE.
Examples
vector <- generate_missing(rnorm(50), missing = 10)
df <- generate_missing(mtcars[, 1:2], missing = 10)
plot_outlier(df = vector, method = "mean", title = "random vector")
 plot_outlier(df = vector, method = "median")
 plot_outlier(df = vector, method = "boxplot")
 plot_outlier(df = df, method = "mean", title = "random vector")
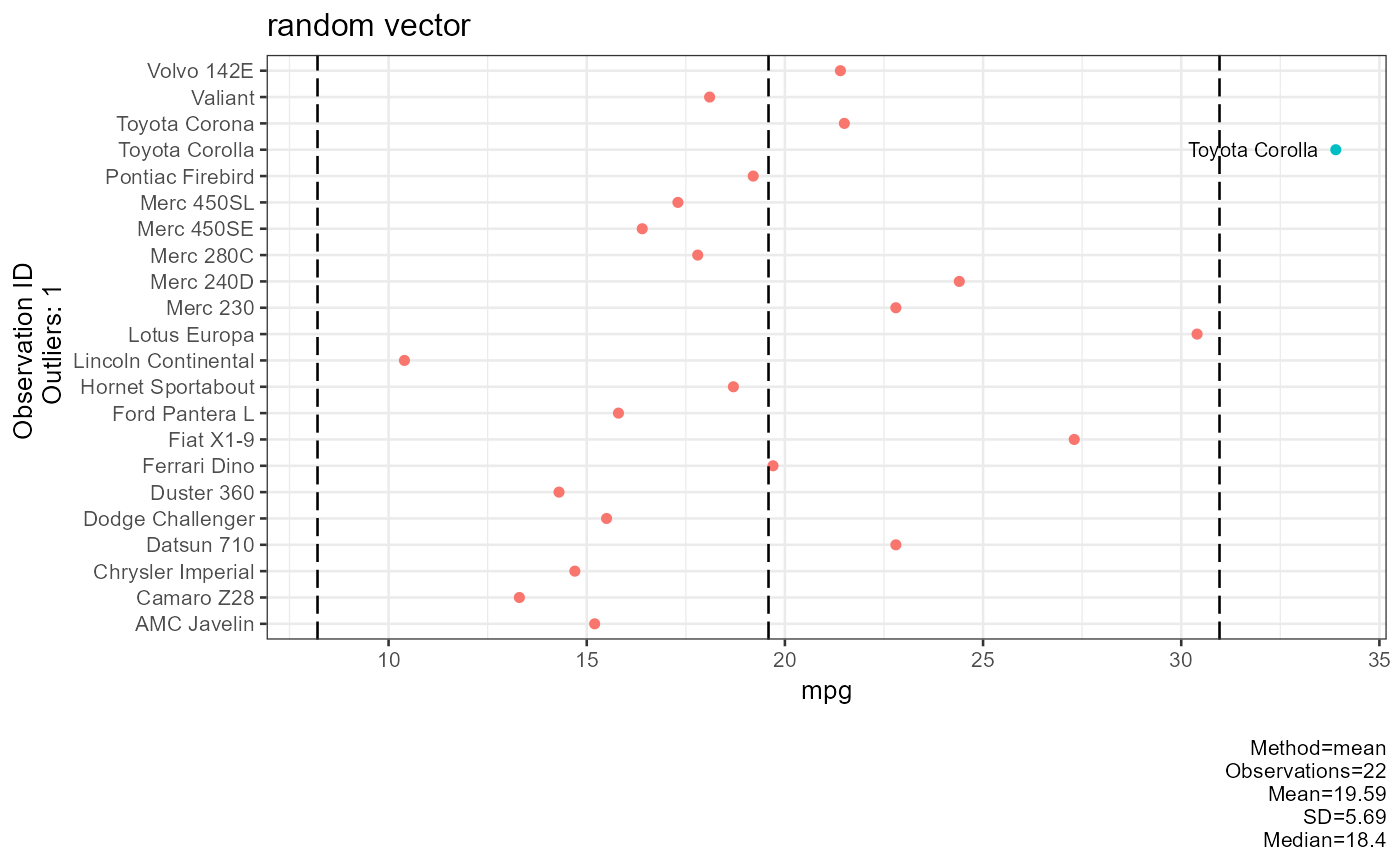
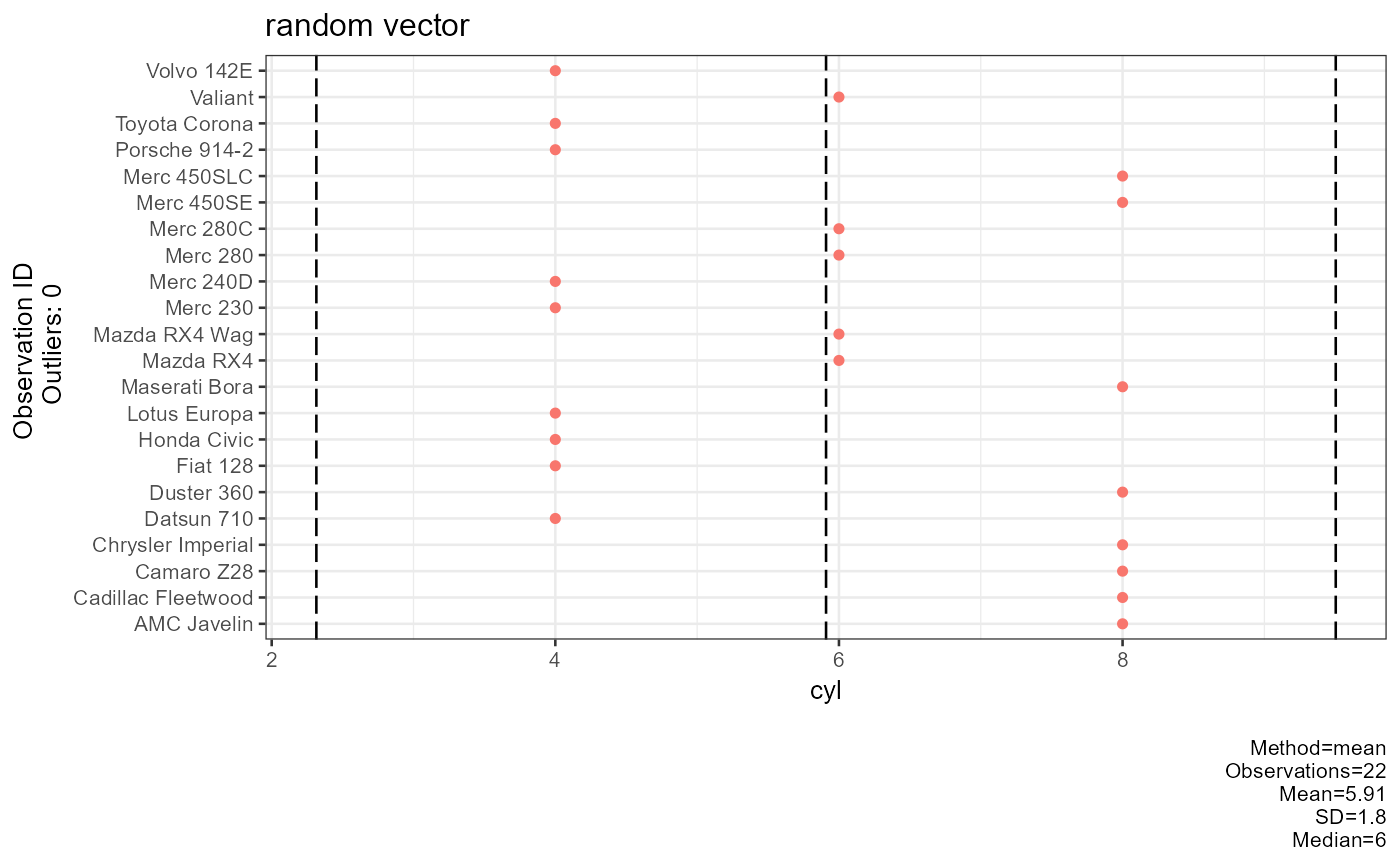 plot_outlier(df = df, method = "median")
 plot_outlier(df = df, method = "boxplot")
 plot_multiplot(plotlist = plot_outlier(df = mtcars[1:5, 2:5], method = "mean"), cols = 2)