Report for xgboost::xgb.train
Usage
report_xgboost(
  model,
  validation_data = NULL,
  label = NULL,
  file = "xgboost",
  w = 10,
  h = 10,
  base_size = 10,
  title = "",
  fast = FALSE
)Value
Invisibly, a list with
- plots
ggplot objects:
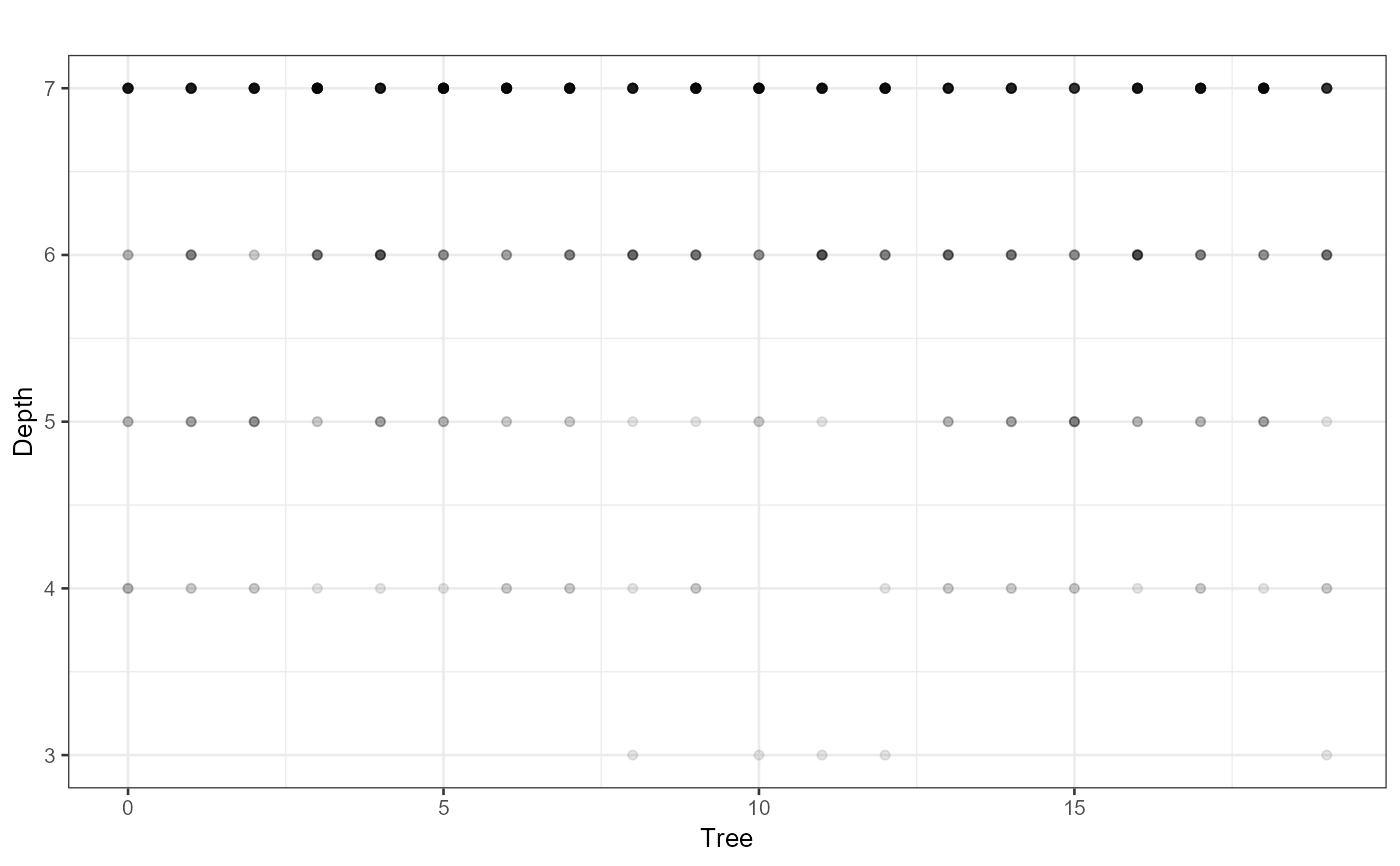
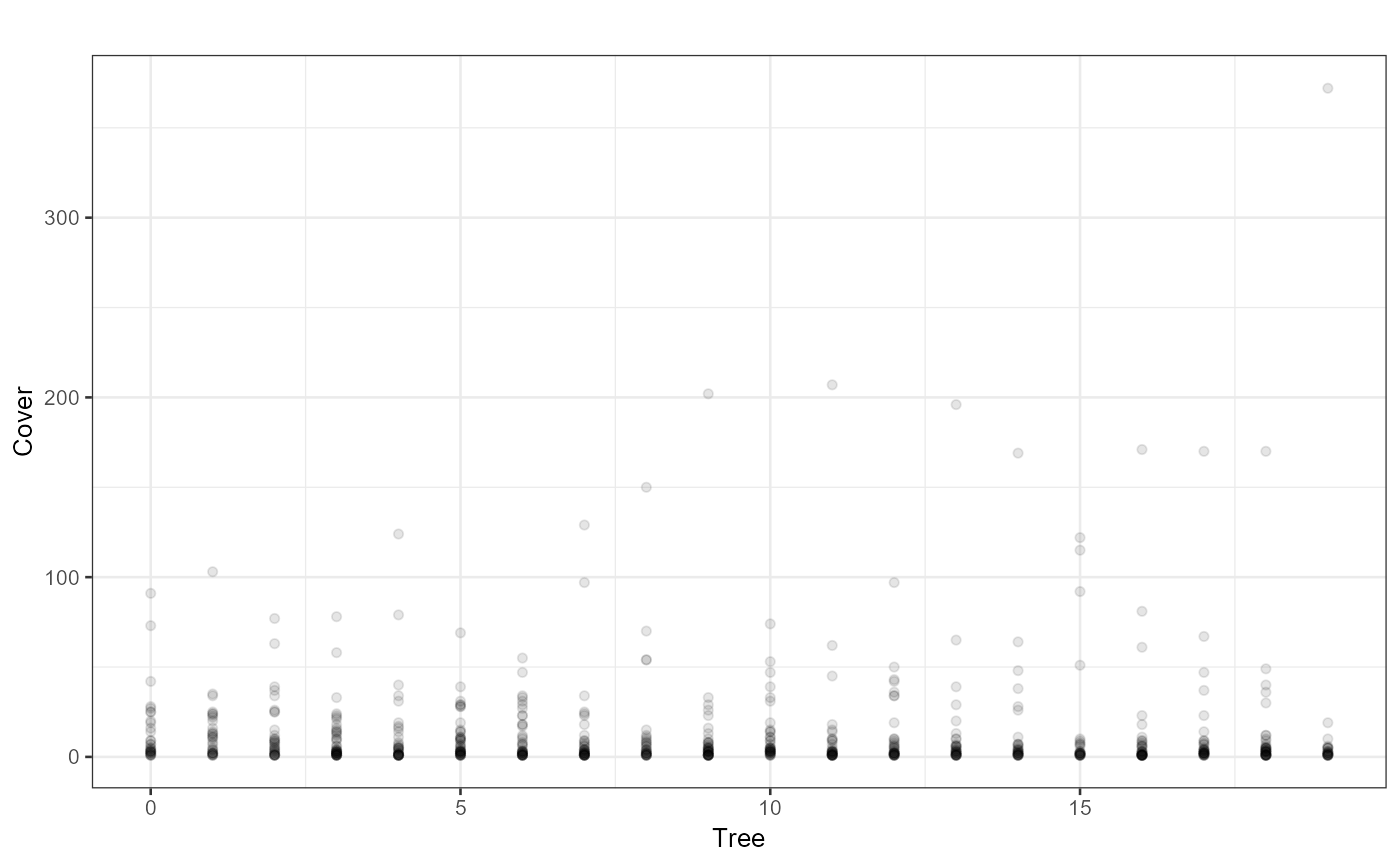
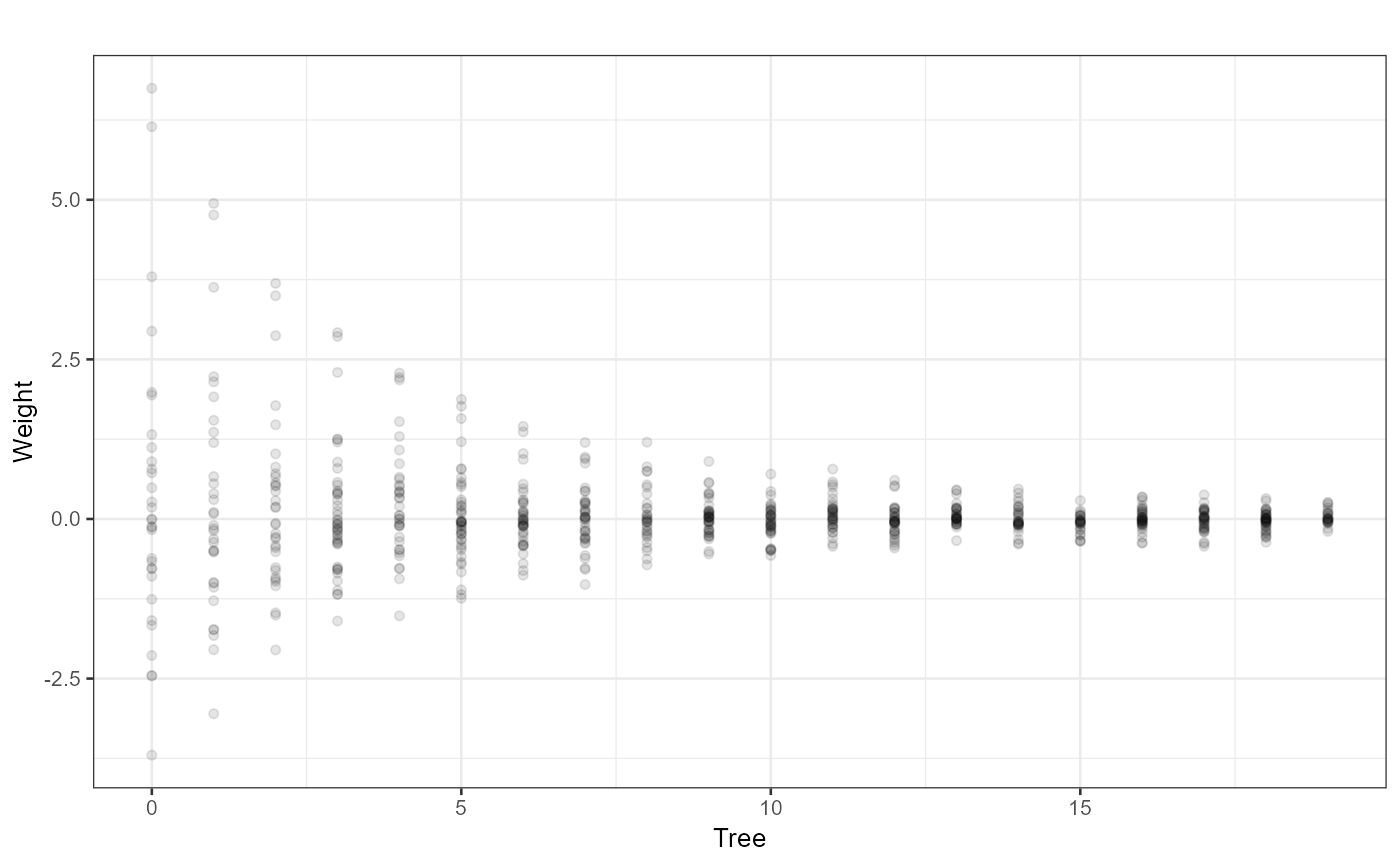
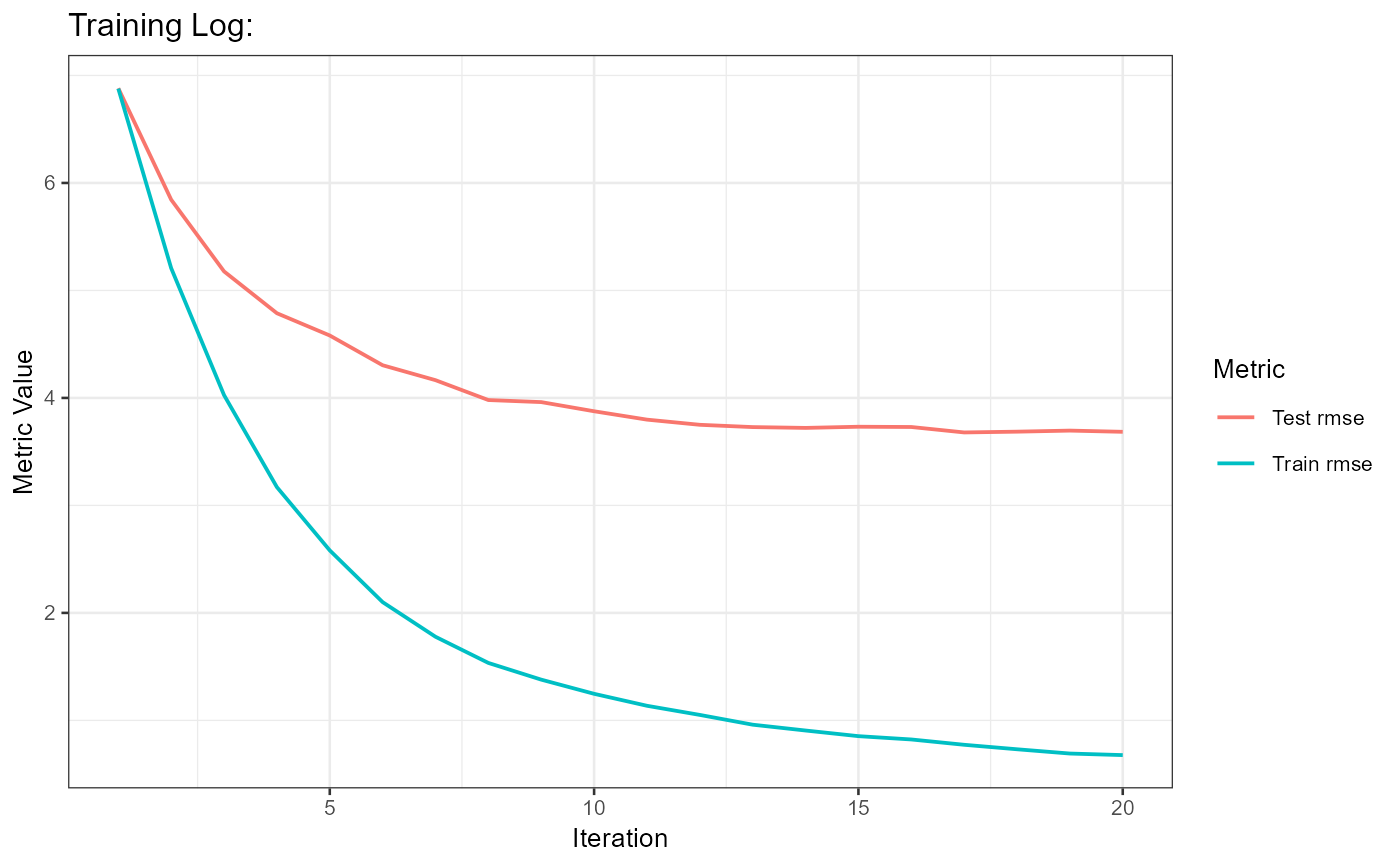
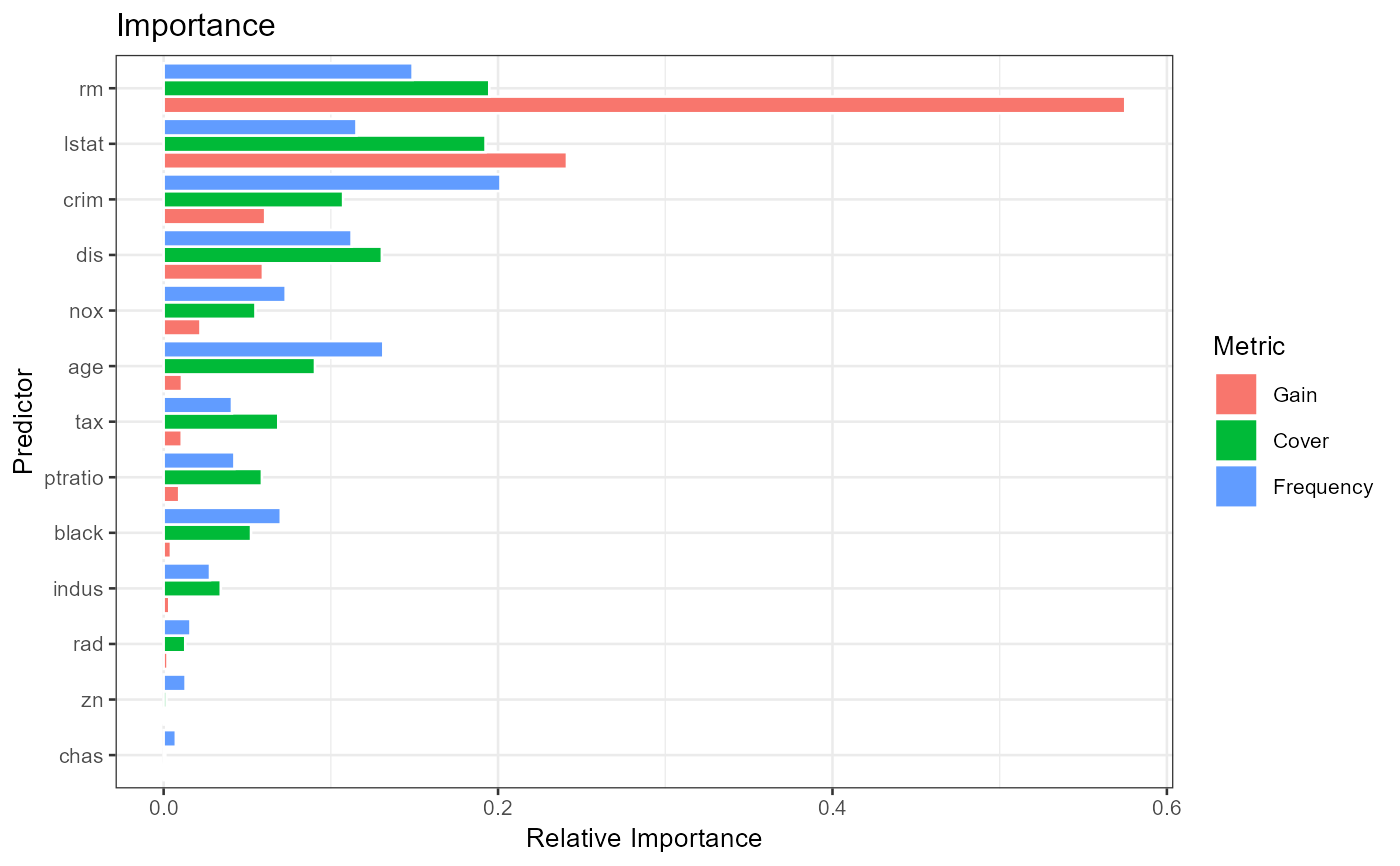
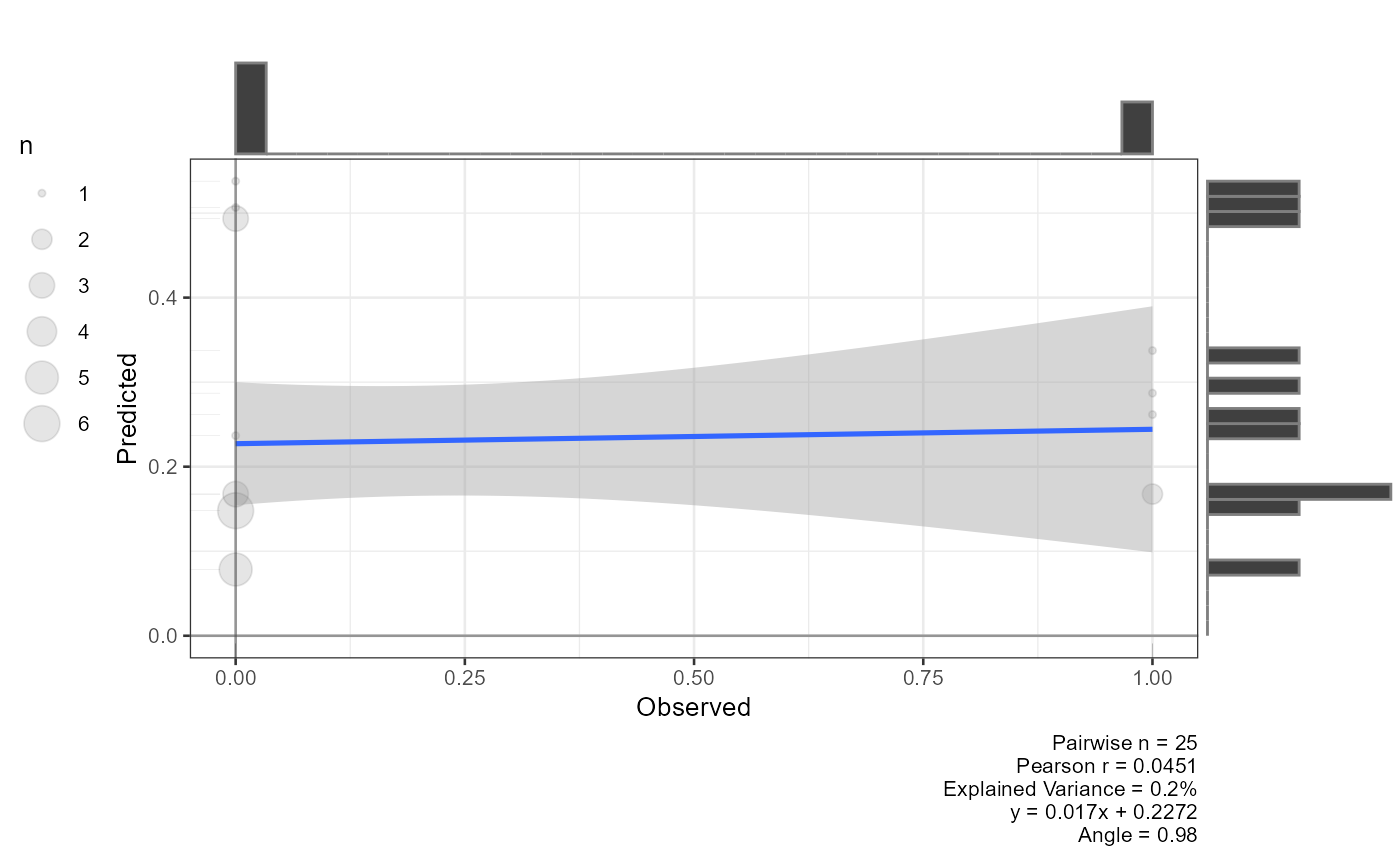
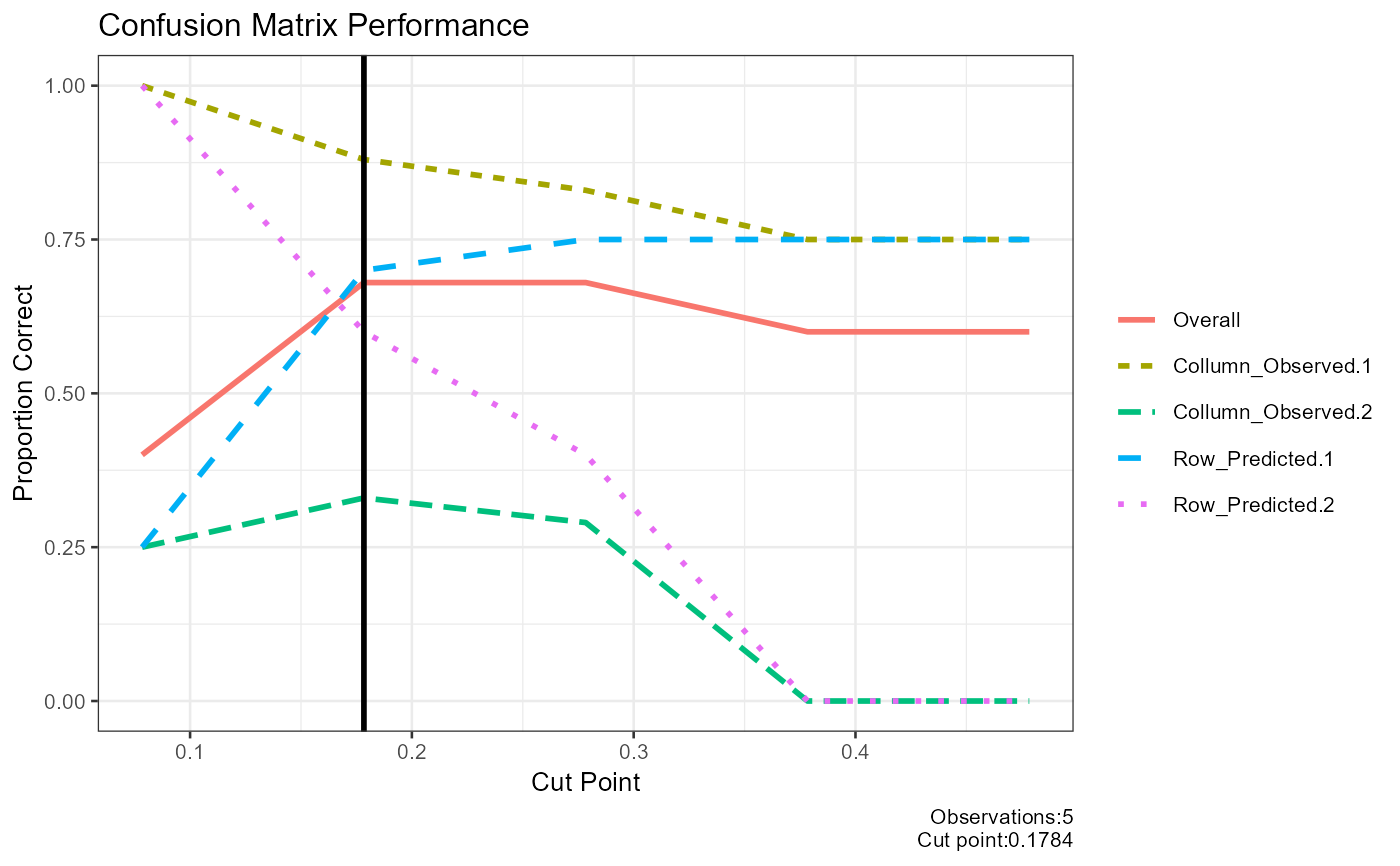
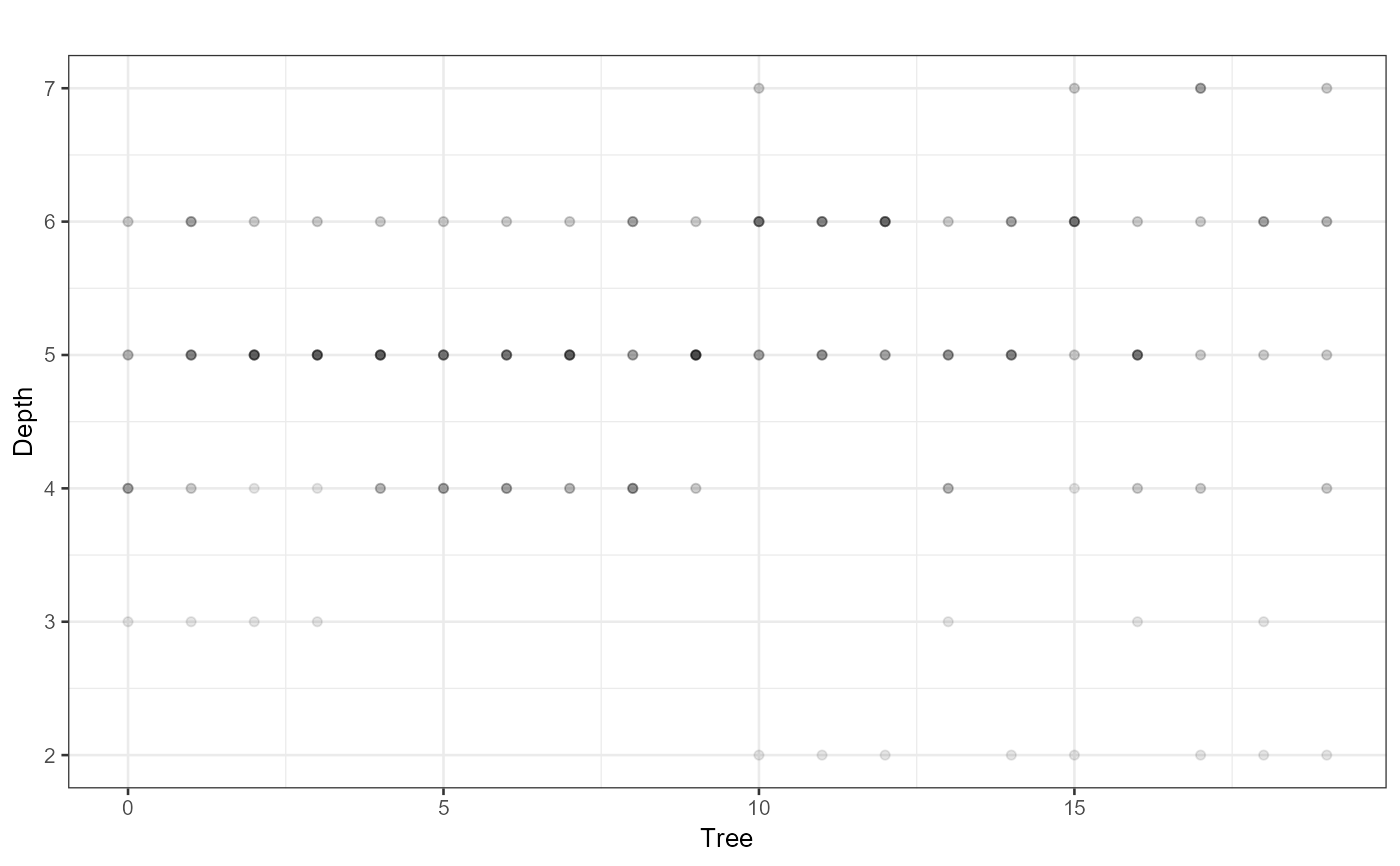
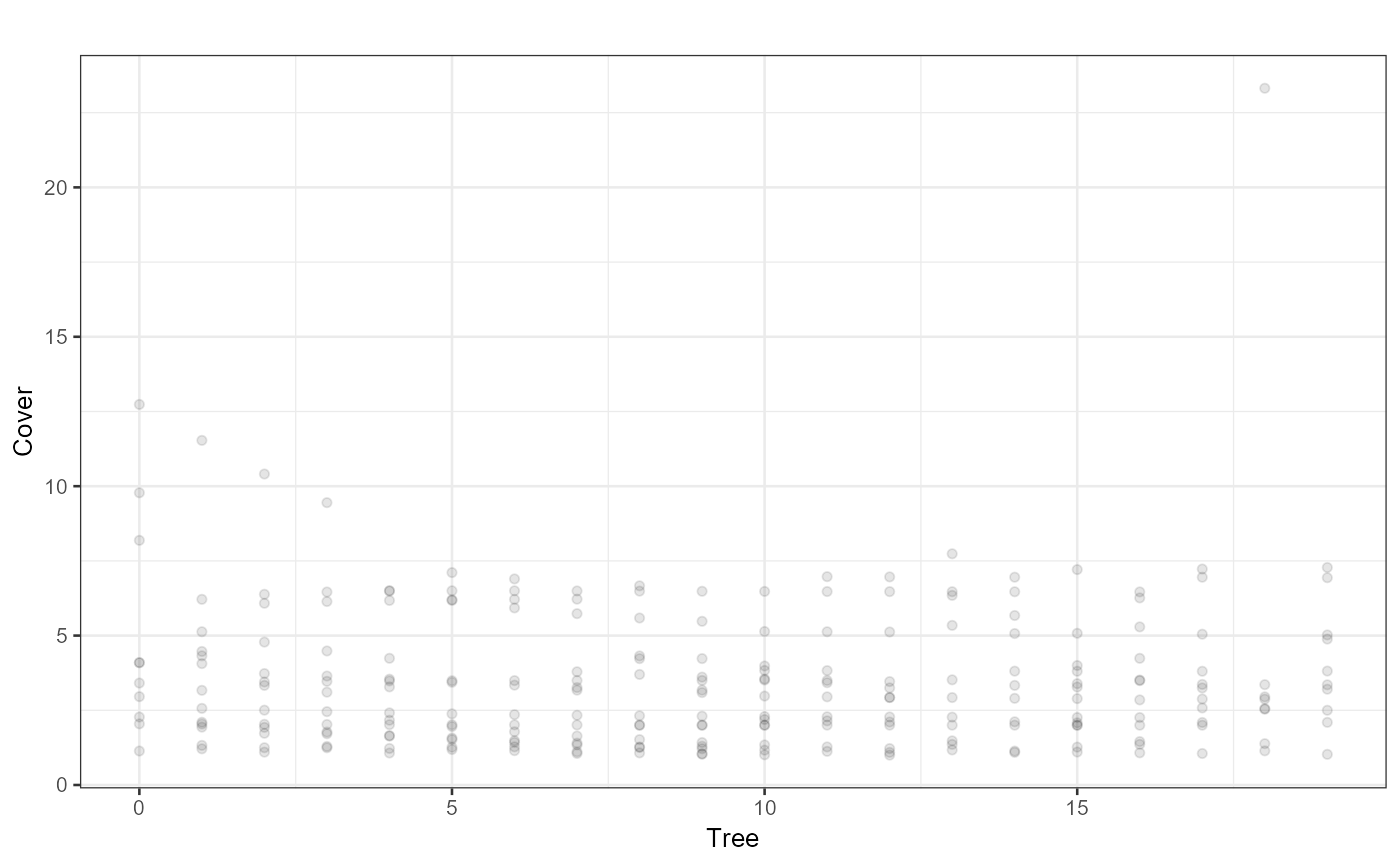
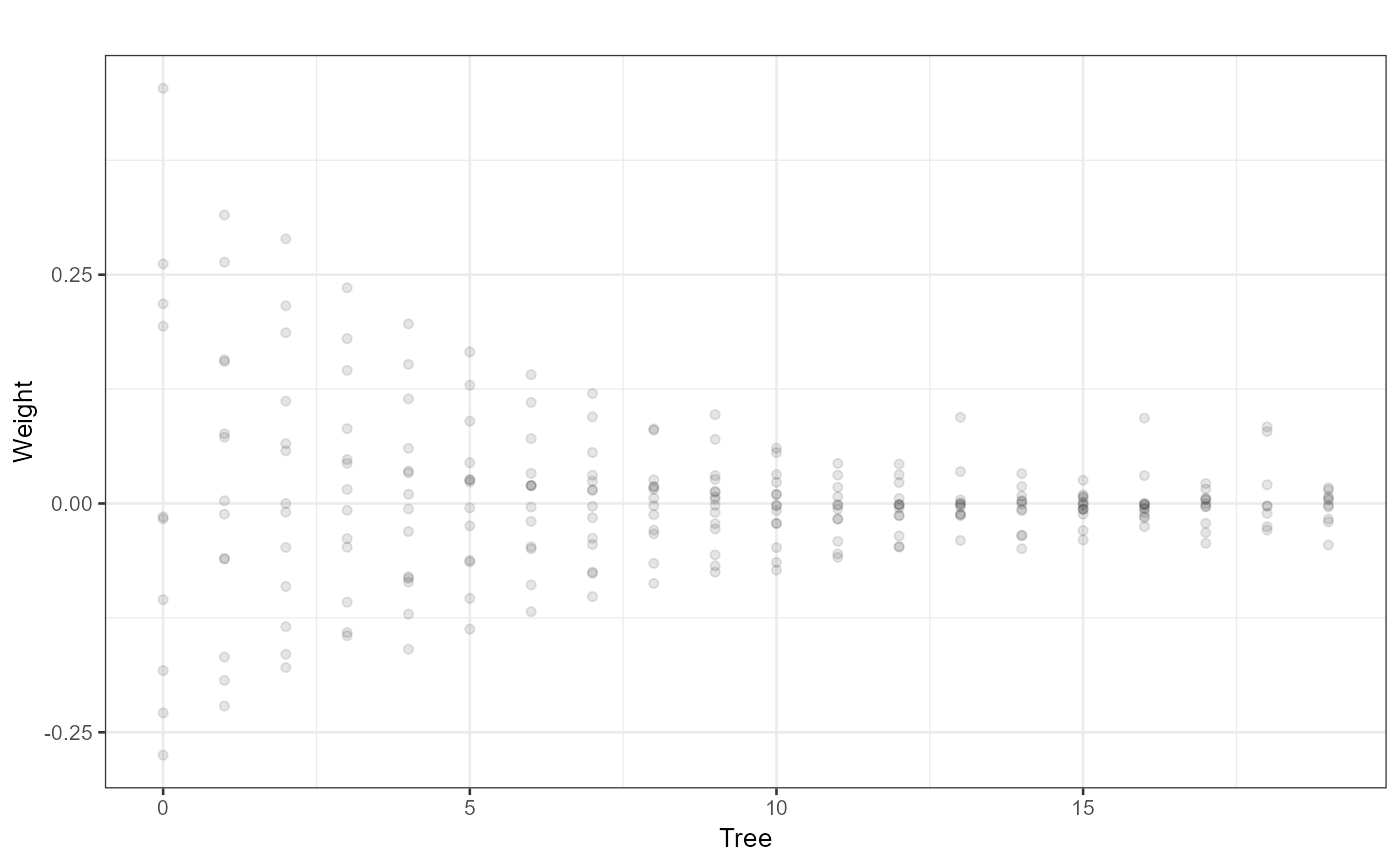
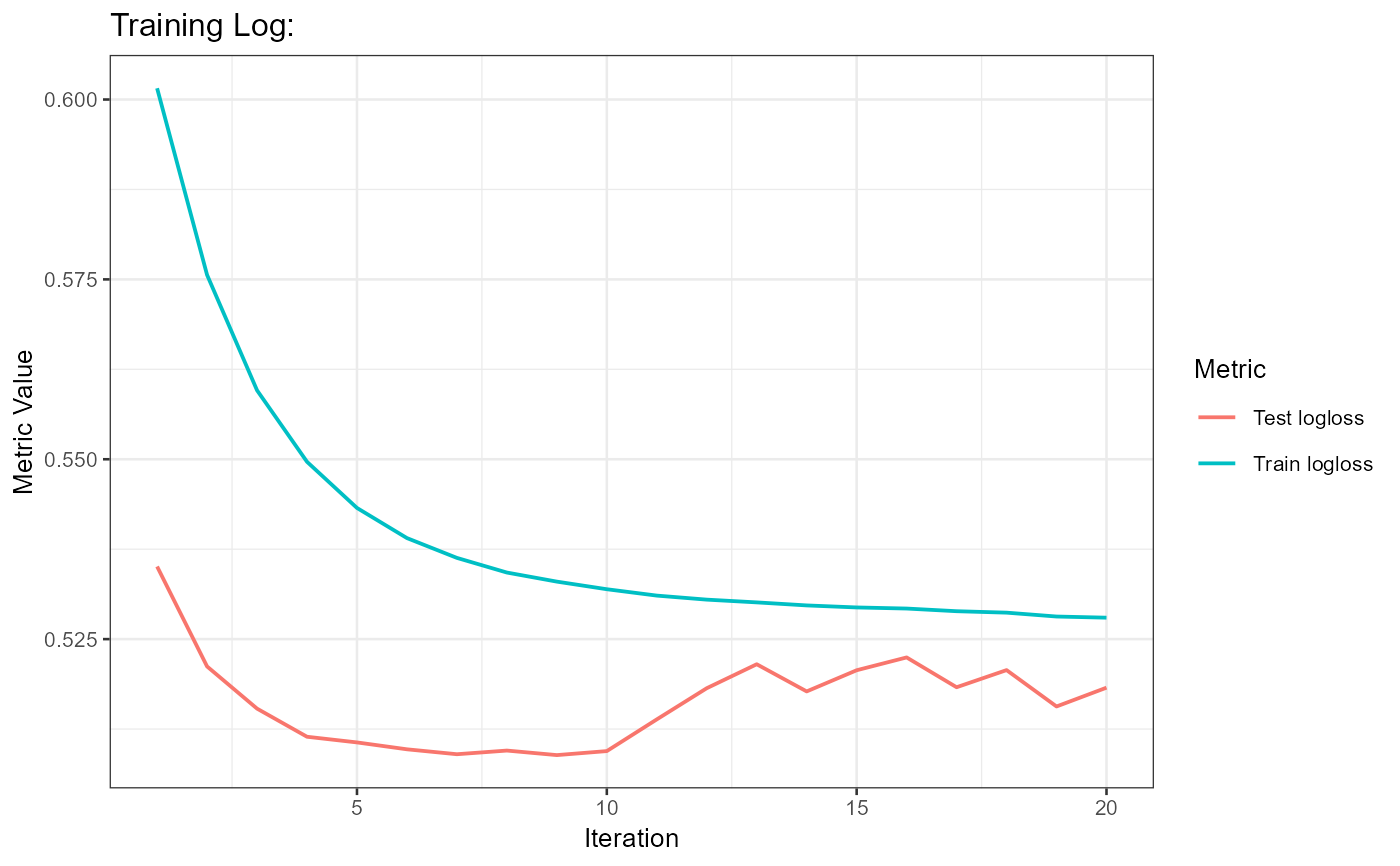
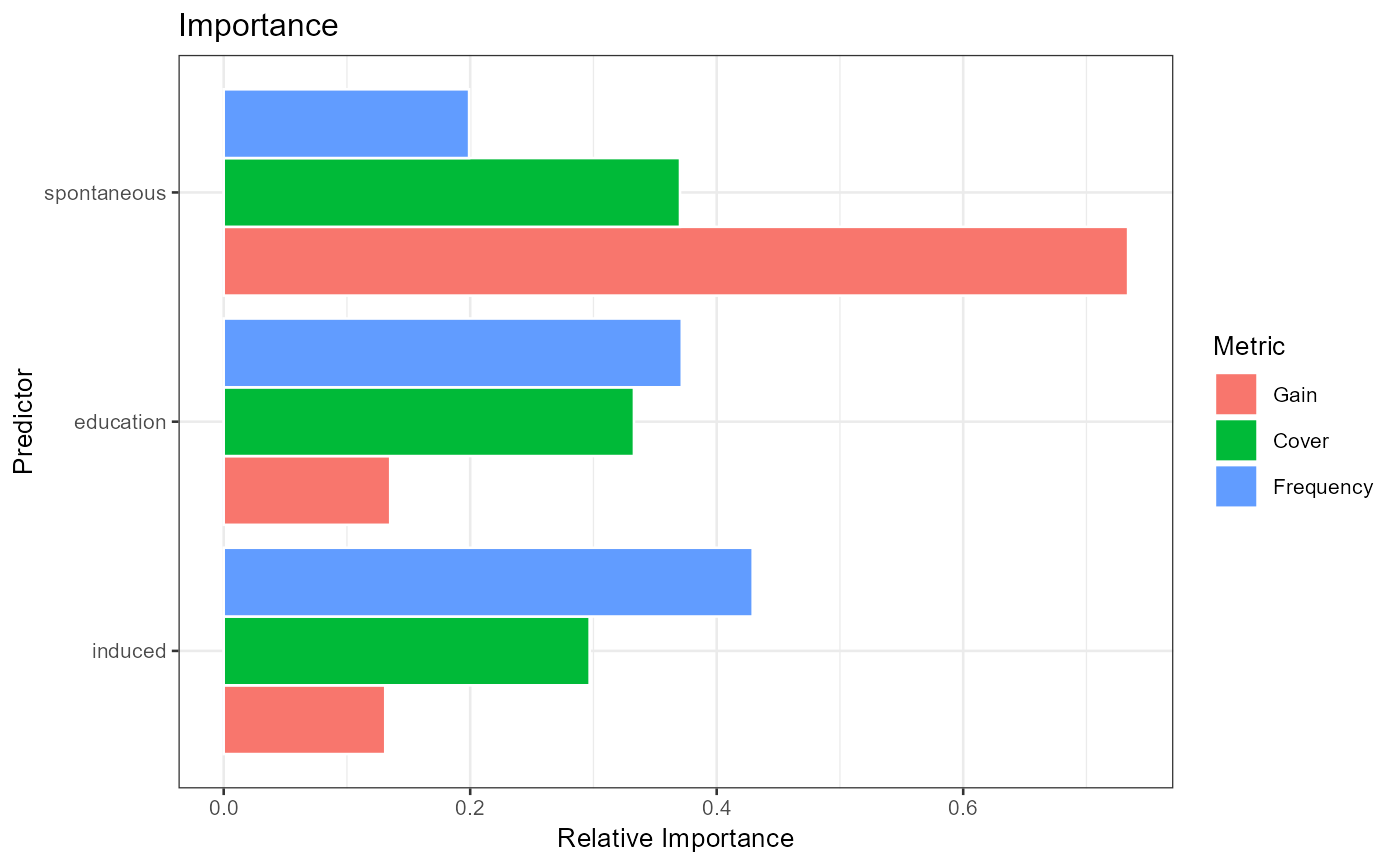
regression(observed vs predicted on the validation data),performance(cut-point diagnostics, not for regression objectives),depth,cover,weight(tree structure),error(training log) andimportance.- result
tables:
importance(fromxgboost::xgb.importance),parameters(hyperparameters),model_call,evaluation_log,model_summary(objective, boosting rounds, number of features, and with early stopping the best iteration and score). With validation data, there is alsovalidation_metrics(regression: N, RMSE, MAE, mean error, R squared; binary classification: N, AUC, log loss and accuracy at a 0.5 cut-off).- observed, predicted
validation outcome and predictions (
NULLwithoutvalidation_data).- feature_names
the model's features, in the model's order.
Details
Works with xgboost 3, which stores the call, parameters and
evaluation log as attributes of the model, and with older versions that
store them as list elements. Validation predictions use the model's own
feature order. When file is given, the plots are written to
<file>.pdf and the tables to <file>.xlsx (sheets: confusion
matrix for classification, Model Summary, Validation Metrics, Feature
Importance, Hyperparameters and, unless fast = TRUE, Evaluation Log).
Examples
infert_formula<-formula(case~education+spontaneous+induced)
boston_formula<-formula(medv~crim+zn+indus+chas+nox+rm+age+
dis+rad+tax+ptratio+black+lstat)
train_test_classification<-k_fold(df=infert,model_formula=infert_formula)
#> Fold Cases: 1 Train: 223 Test: 25 Total: 248 Unique Train: 223 Unique Test: 25
#> Fold Cases: 2 Train: 223 Test: 25 Total: 248 Unique Train: 223 Unique Test: 25
#> Fold Cases: 3 Train: 223 Test: 25 Total: 248 Unique Train: 223 Unique Test: 25
#> Fold Cases: 4 Train: 224 Test: 24 Total: 248 Unique Train: 224 Unique Test: 24
#> Fold Cases: 5 Train: 223 Test: 25 Total: 248 Unique Train: 223 Unique Test: 25
#> Fold Cases: 6 Train: 223 Test: 25 Total: 248 Unique Train: 223 Unique Test: 25
#> Fold Cases: 7 Train: 224 Test: 24 Total: 248 Unique Train: 224 Unique Test: 24
#> Fold Cases: 8 Train: 223 Test: 25 Total: 248 Unique Train: 223 Unique Test: 25
#> Fold Cases: 9 Train: 223 Test: 25 Total: 248 Unique Train: 223 Unique Test: 25
#> Fold Cases: 10 Train: 223 Test: 25 Total: 248 Unique Train: 223 Unique Test: 25
train_test_regression<-k_fold(df=MASS::Boston,model_formula=boston_formula)
#> Fold Cases: 1 Train: 455 Test: 51 Total: 506 Unique Train: 455 Unique Test: 51
#> Fold Cases: 2 Train: 455 Test: 51 Total: 506 Unique Train: 455 Unique Test: 51
#> Fold Cases: 3 Train: 456 Test: 50 Total: 506 Unique Train: 456 Unique Test: 50
#> Fold Cases: 4 Train: 455 Test: 51 Total: 506 Unique Train: 455 Unique Test: 51
#> Fold Cases: 5 Train: 456 Test: 50 Total: 506 Unique Train: 456 Unique Test: 50
#> Fold Cases: 6 Train: 455 Test: 51 Total: 506 Unique Train: 455 Unique Test: 51
#> Fold Cases: 7 Train: 456 Test: 50 Total: 506 Unique Train: 456 Unique Test: 50
#> Fold Cases: 8 Train: 455 Test: 51 Total: 506 Unique Train: 455 Unique Test: 51
#> Fold Cases: 9 Train: 456 Test: 50 Total: 506 Unique Train: 456 Unique Test: 50
#> Fold Cases: 10 Train: 455 Test: 51 Total: 506 Unique Train: 455 Unique Test: 51
xgb_classification<-xgboost::xgb.train(
params=xgboost::xgb.params(objective="binary:logistic"),
data=train_test_classification$xgb$f1$train,
evals=train_test_classification$xgb$f1$watchlist,
nround=20)
#> [1] train-logloss:0.601567 test-logloss:0.535093
#> [2] train-logloss:0.575618 test-logloss:0.521200
#> [3] train-logloss:0.559581 test-logloss:0.515340
#> [4] train-logloss:0.549645 test-logloss:0.511429
#> [5] train-logloss:0.543232 test-logloss:0.510642
#> [6] train-logloss:0.539043 test-logloss:0.509685
#> [7] train-logloss:0.536289 test-logloss:0.509001
#> [8] train-logloss:0.534253 test-logloss:0.509510
#> [9] train-logloss:0.532991 test-logloss:0.508879
#> [10] train-logloss:0.531934 test-logloss:0.509436
#> [11] train-logloss:0.531048 test-logloss:0.513843
#> [12] train-logloss:0.530487 test-logloss:0.518176
#> [13] train-logloss:0.530105 test-logloss:0.521507
#> [14] train-logloss:0.529684 test-logloss:0.517731
#> [15] train-logloss:0.529402 test-logloss:0.520672
#> [16] train-logloss:0.529249 test-logloss:0.522455
#> [17] train-logloss:0.528879 test-logloss:0.518311
#> [18] train-logloss:0.528678 test-logloss:0.520694
#> [19] train-logloss:0.528140 test-logloss:0.515638
#> [20] train-logloss:0.527980 test-logloss:0.518252
xgb_regression<-xgboost::xgb.train(
data=train_test_regression$xgb$f1$train,
evals=train_test_regression$xgb$f1$watchlist,
nround=20)
#> [1] train-rmse:6.877490 test-rmse:6.881132
#> [2] train-rmse:5.207159 test-rmse:5.844378
#> [3] train-rmse:4.026195 test-rmse:5.177089
#> [4] train-rmse:3.169878 test-rmse:4.787926
#> [5] train-rmse:2.581531 test-rmse:4.580796
#> [6] train-rmse:2.100192 test-rmse:4.304045
#> [7] train-rmse:1.777937 test-rmse:4.165161
#> [8] train-rmse:1.534497 test-rmse:3.980251
#> [9] train-rmse:1.379046 test-rmse:3.961146
#> [10] train-rmse:1.247219 test-rmse:3.875961
#> [11] train-rmse:1.135899 test-rmse:3.798032
#> [12] train-rmse:1.050888 test-rmse:3.749944
#> [13] train-rmse:0.959931 test-rmse:3.728645
#> [14] train-rmse:0.905722 test-rmse:3.721090
#> [15] train-rmse:0.853247 test-rmse:3.731942
#> [16] train-rmse:0.822476 test-rmse:3.729514
#> [17] train-rmse:0.772964 test-rmse:3.678861
#> [18] train-rmse:0.731270 test-rmse:3.686072
#> [19] train-rmse:0.691505 test-rmse:3.695998
#> [20] train-rmse:0.676991 test-rmse:3.684742
report_xgboost(model=xgb_classification,
validation_data=train_test_classification$f$test$f1,
label=train_test_classification$outcome,
file="Classification")
#> $observed_predicted
#>
#> $plot_performance
#>
#> $cut_performance
#> cut_point Overall Collumn_Observed.1 Collumn_Observed.2 Row_Predicted.1 Row_Predicted.2 Mean_proportion
#> 1 0.07838 0.40 1.00 0.25 0.25 1.0 0.6250
#> 2 0.17838 0.68 0.88 0.33 0.70 0.6 0.6275
#> 3 0.27838 0.68 0.83 0.29 0.75 0.4 0.5675
#> 4 0.37838 0.60 0.75 0.00 0.75 0.0 0.3750
#> 5 0.47838 0.60 0.75 0.00 0.75 0.0 0.3750
#>
#> $cut
#> [1] 0.1784
#>
#> $confusion_matrix
#> 0 1 sum p
#> 0 14.00 2.00 16.00 0.88
#> 1 6.00 3.00 9.00 0.33
#> sum 20.00 5.00 25.00 1.00
#> p 0.70 0.60 1.00 0.68
#>
#> $observed_predicted
 #>
#> $plot_performance
 #>
#> $cut_performance
#> cut_point Overall Collumn_Observed.1 Collumn_Observed.2 Row_Predicted.1 Row_Predicted.2 Mean_proportion
#> 1 0.07838 0.40 1.00 0.25 0.25 1.0 0.6250
#> 2 0.17838 0.68 0.88 0.33 0.70 0.6 0.6275
#> 3 0.27838 0.68 0.83 0.29 0.75 0.4 0.5675
#> 4 0.37838 0.60 0.75 0.00 0.75 0.0 0.3750
#> 5 0.47838 0.60 0.75 0.00 0.75 0.0 0.3750
#>
#> $cut
#> [1] 0.1784
#>
#> $confusion_matrix
#> 0 1 sum p
#> 0 14.00 2.00 16.00 0.88
#> 1 6.00 3.00 9.00 0.33
#> sum 20.00 5.00 25.00 1.00
#> p 0.70 0.60 1.00 0.68
#>
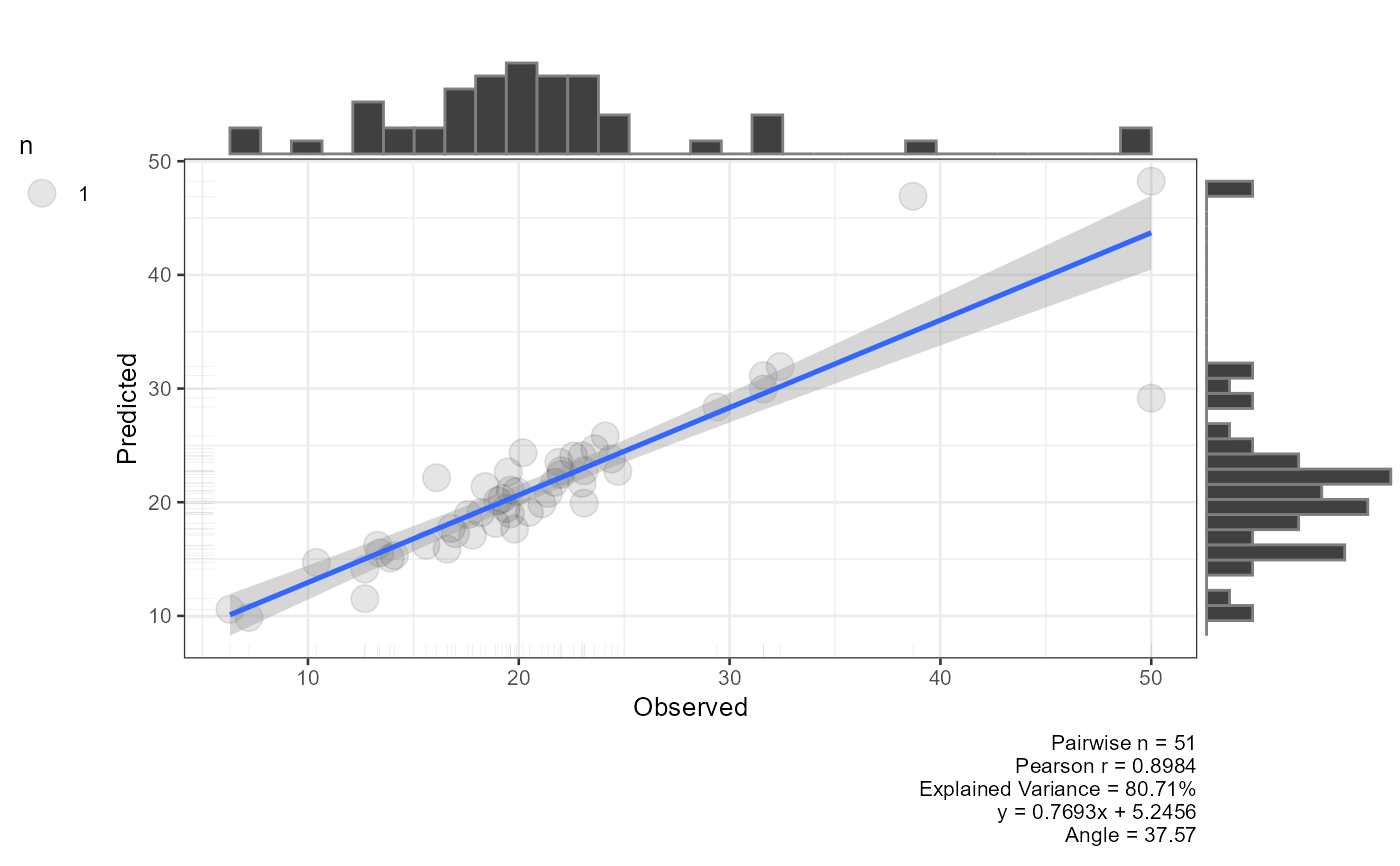
 report_xgboost(model=xgb_regression,
validation_data=train_test_regression$f$test$f1,
label=train_test_regression$outcome,
file="Regression")
#> $observed_predicted
#>
#> $observed_predicted
 #>