Report correlation matrix
Usage
report_correlation(
  x,
  y = NULL,
  use = "pairwise",
  method = "pearson",
  adjust = "holm",
  alpha = 0.05,
  ci = TRUE,
  file = NULL,
  w = 10,
  h = 10,
  base_size = 20,
  scatterplot = TRUE
)
Arguments
- x
matrix or dataframe
- y
a second matrix or dataframe with the same number of rows as x
- use
"pairwise" is the default value and will do pairwise deletion of cases. "complete" will select just complete cases
- method
"pearson" "spearman" "kendall"
- adjust
"holm", "hochberg", "hommel", "bonferroni", "BH", "BY", "fdr", "none"
- alpha
alpha level of confidence intervals
- ci
By default, confidence intervals are found. However, this leads to a great slowdown of speed. So, for just the rs, ts and ps, set ci=FALSE
- file
output filename
- w
width of pdf file
- h
height of pdf file
- base_size
base font size
- scatterplot
if TRUE it will output scatterplots
Examples
report_correlation(x=generate_missing(mtcars[,1:3],10))
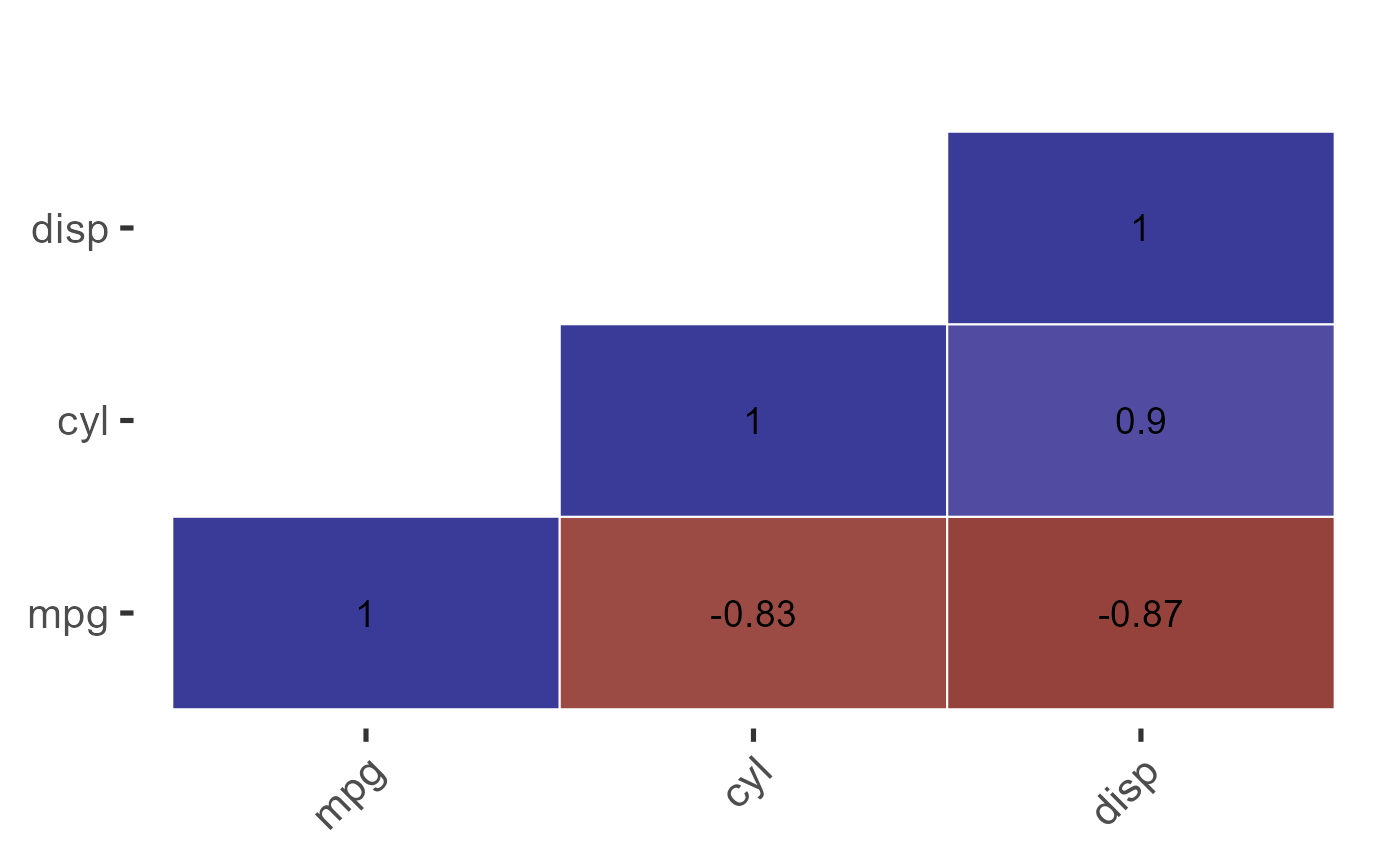
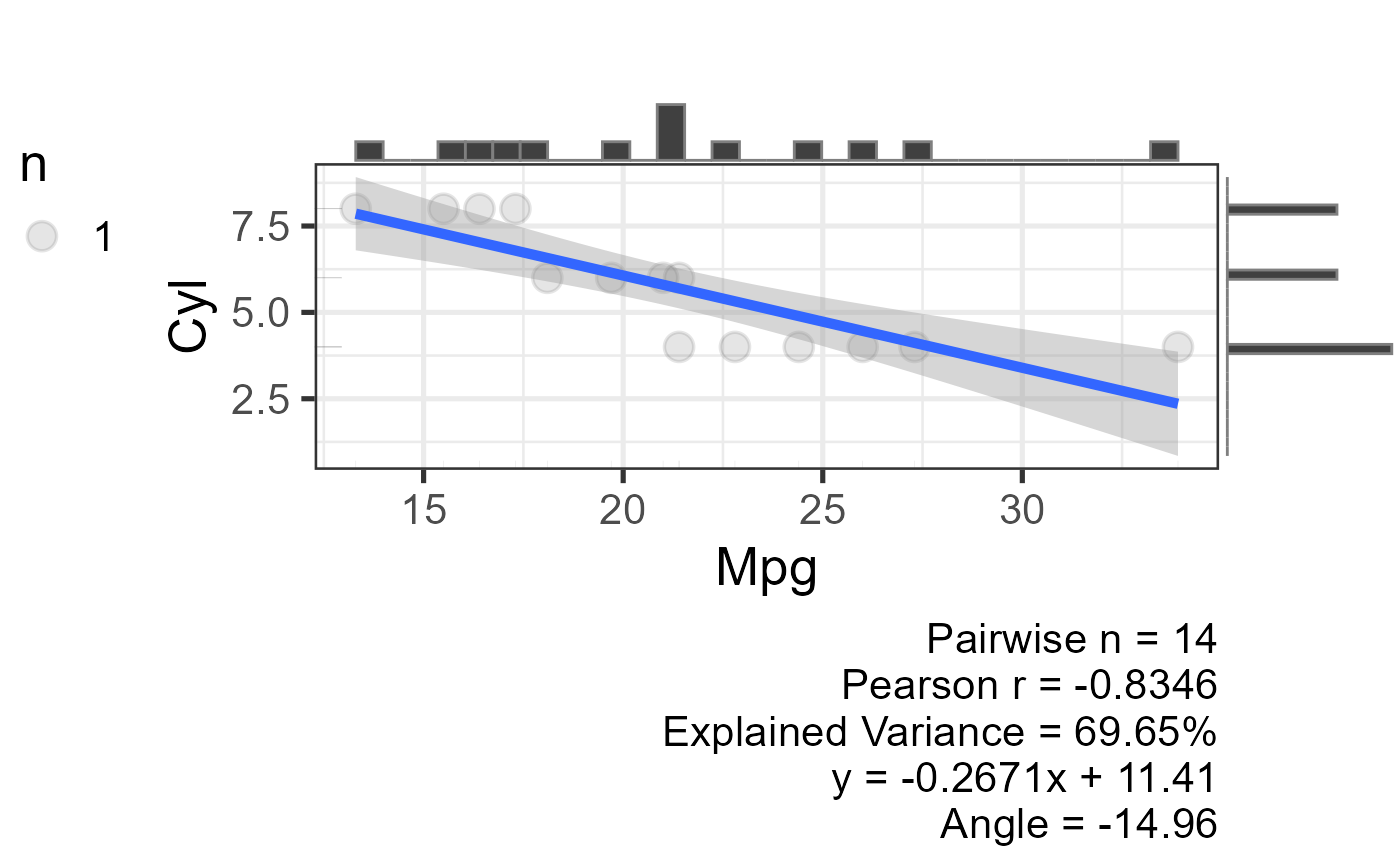
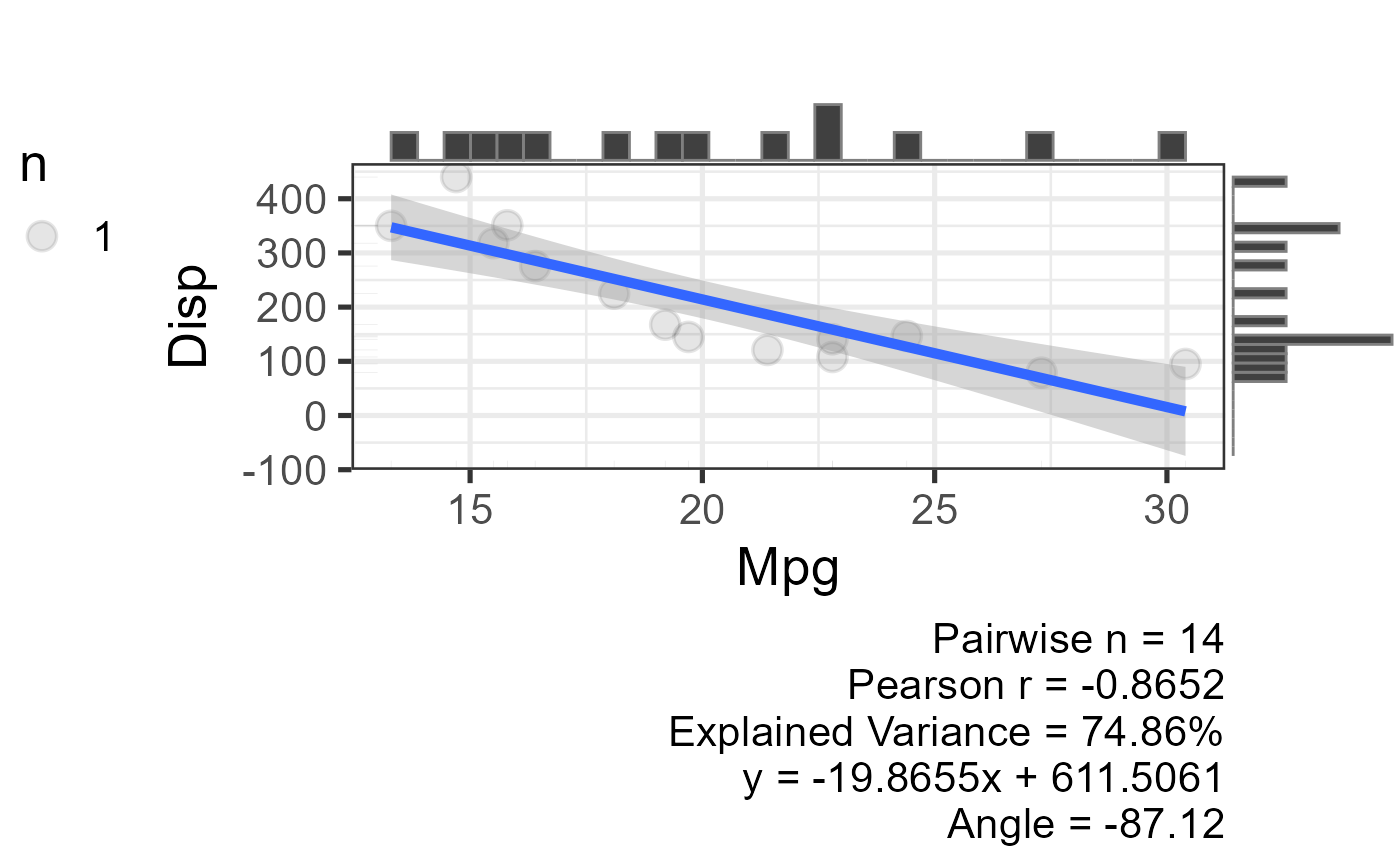
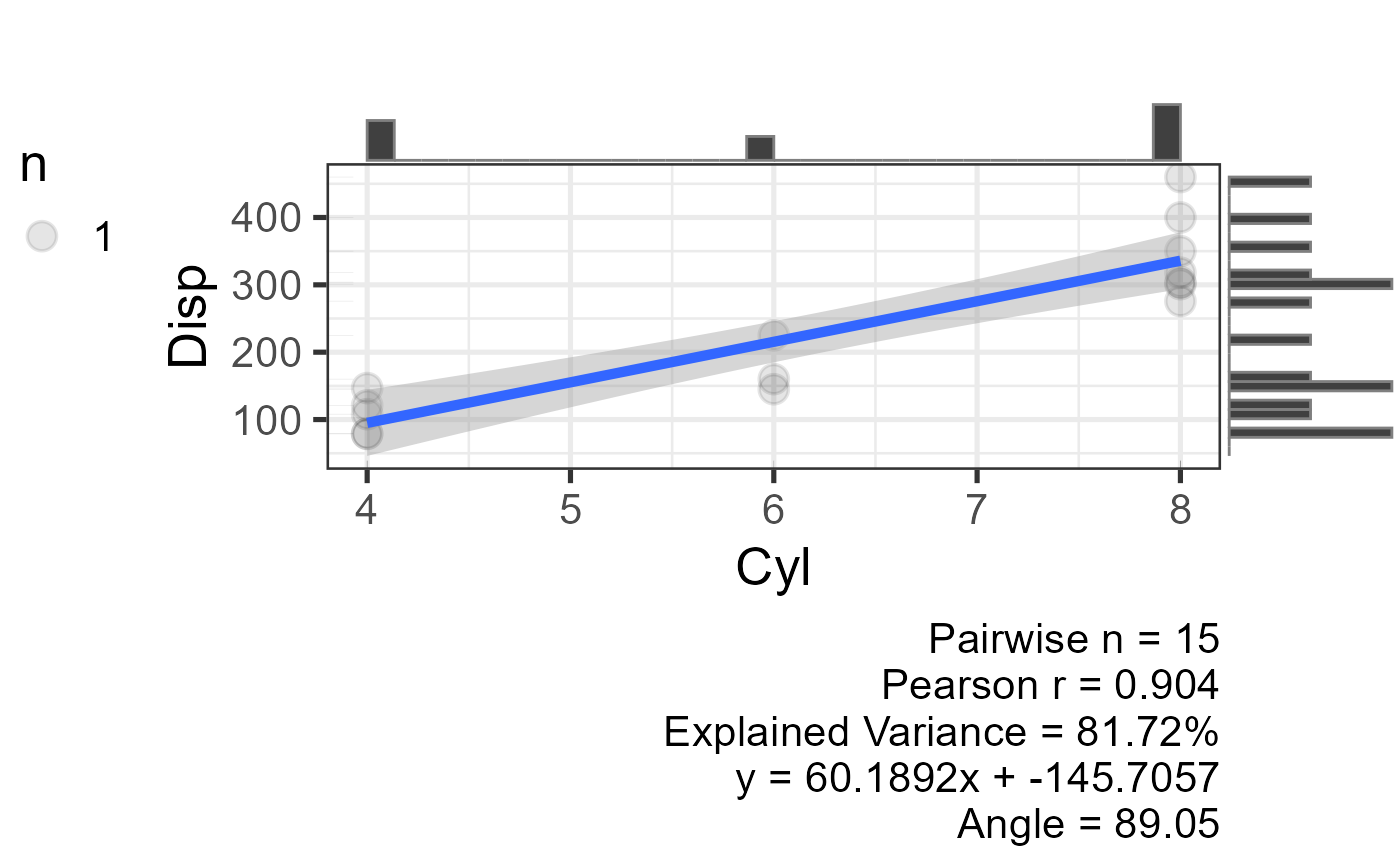 #> $r_lower
#> mpg cyl disp
#> mpg NA NA NA
#> cyl -0.8346 NA NA
#> disp -0.8652 0.904 NA
#>
#> $r_squared_lower
#> mpg cyl disp
#> mpg NA NA NA
#> cyl 0.6965 NA NA
#> disp 0.7486 0.8172 NA
#>
#> $p_lower
#> mpg cyl disp
#> mpg NA NA NA
#> cyl 0.00020510 NA NA
#> disp 0.00006439 0.000003782 NA
#>
#> $p_lower_adjusted
#> mpg cyl disp
#> mpg NA NA NA
#> cyl 0.0002051 NA NA
#> disp 0.0001288 0.00001135 NA
#>
#> $t_lower
#> mpg cyl disp
#> mpg NA NA NA
#> cyl -5.248 NA NA
#> disp -5.977 7.622 NA
#>
#> $n_lower
#> mpg cyl disp
#> mpg NA NA NA
#> cyl 14 NA NA
#> disp 14 15 NA
#>
#> $se_lower
#> mpg cyl disp
#> mpg NA NA NA
#> cyl 0.1590 NA NA
#> disp 0.1448 0.1186 NA
#>
#> $ci
#> lower r upper p lower.adj upper.adj
#> mpg-cyl -0.9462 -0.8346 -0.5456 0.000205103 -0.9462 -0.5456
#> mpg-disp -0.9566 -0.8652 -0.6186 0.000064385 -0.9633 -0.5634
#> cyl-disp 0.7295 0.9040 0.9680 0.000003782 0.6654 0.9750
#>
#> $call
#> function_arguments function_values
#> 1 Use pairwise
#> 2 Method pearson
#> 3 Adjustment for Probability values holm
#> 4 Alpha 0.05
#> 5 Confidence Interval TRUE
#>
report_correlation(x=generate_missing(mtcars[,1:3],10),
file="correlation",scatterplot=TRUE)
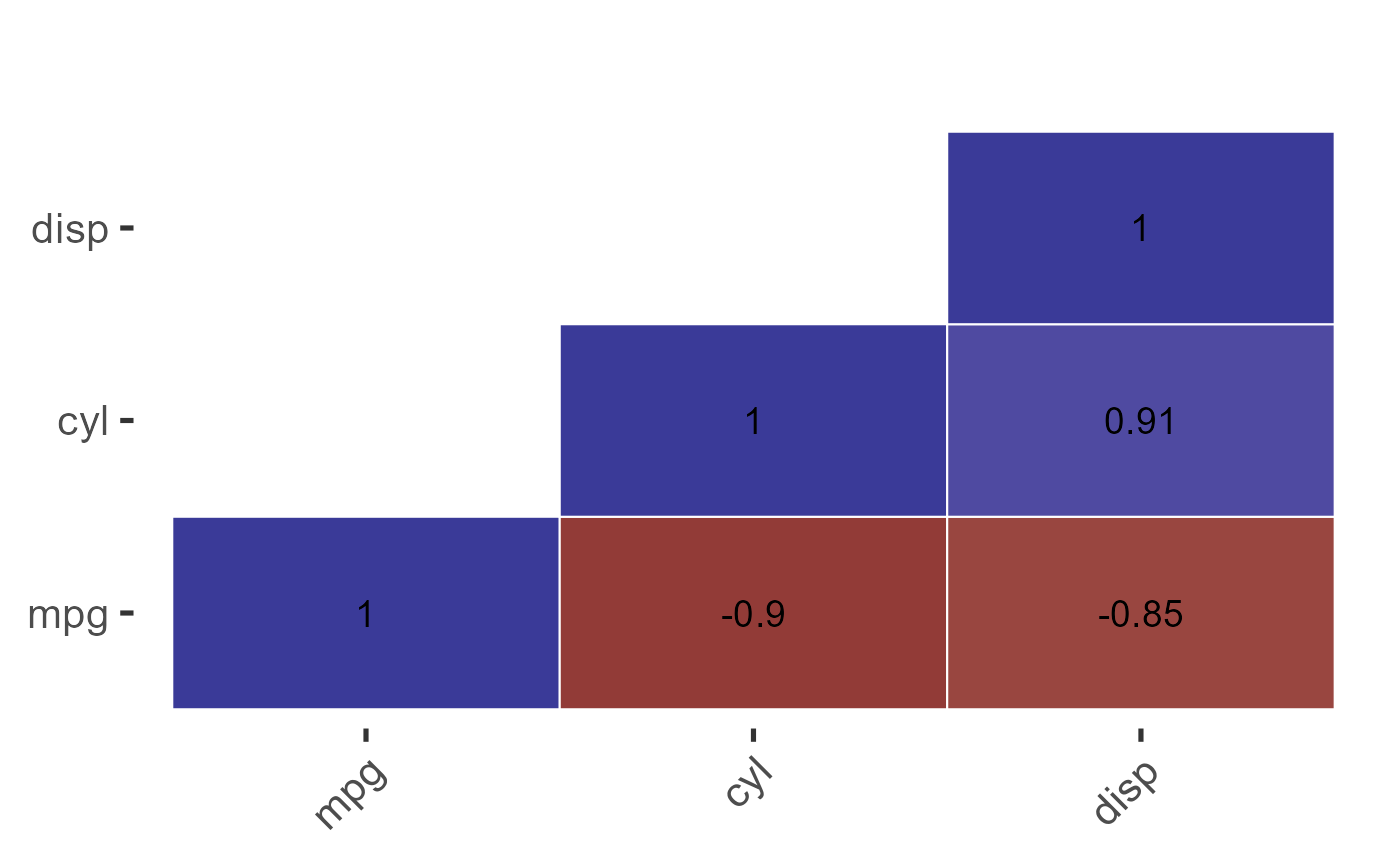
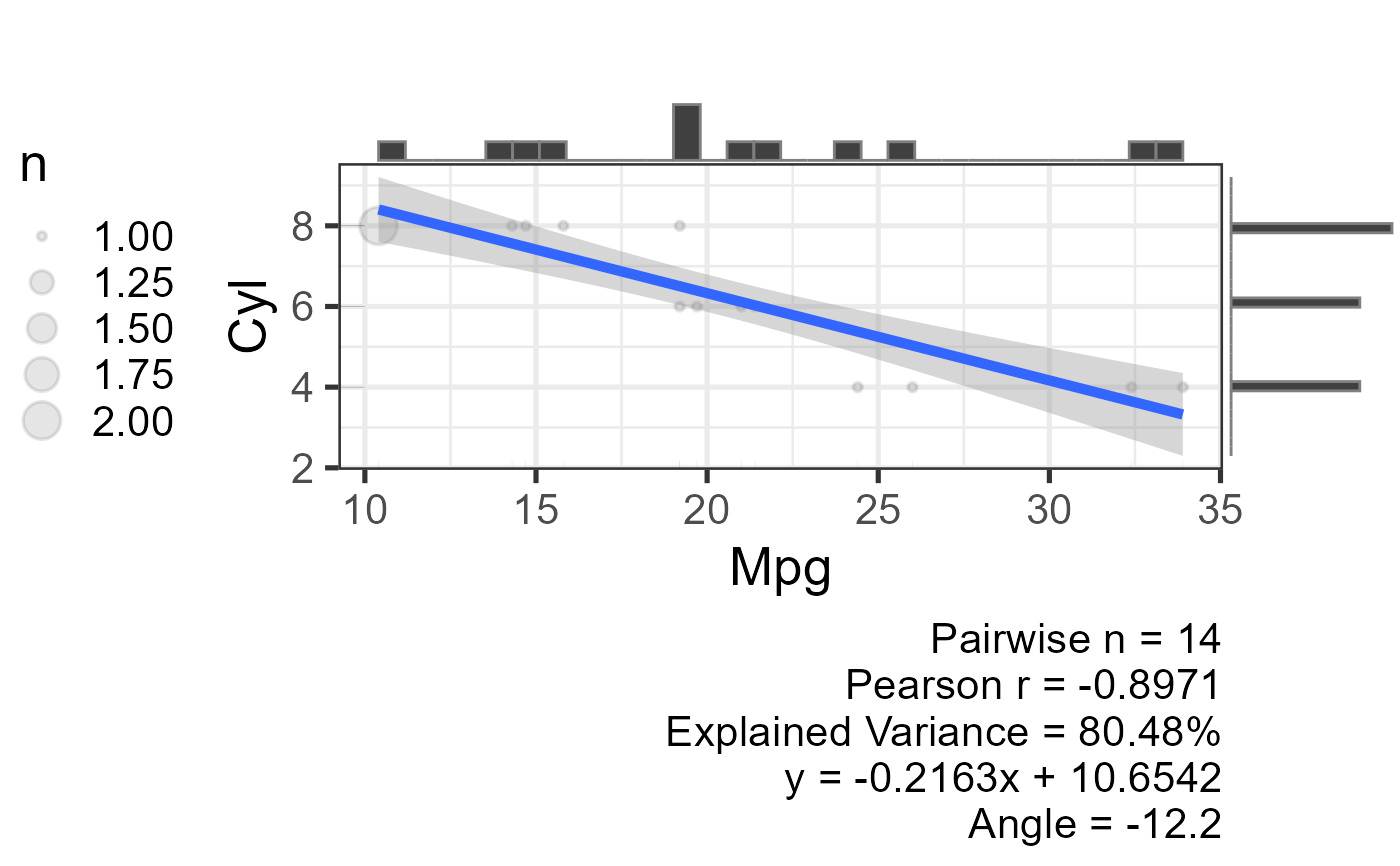
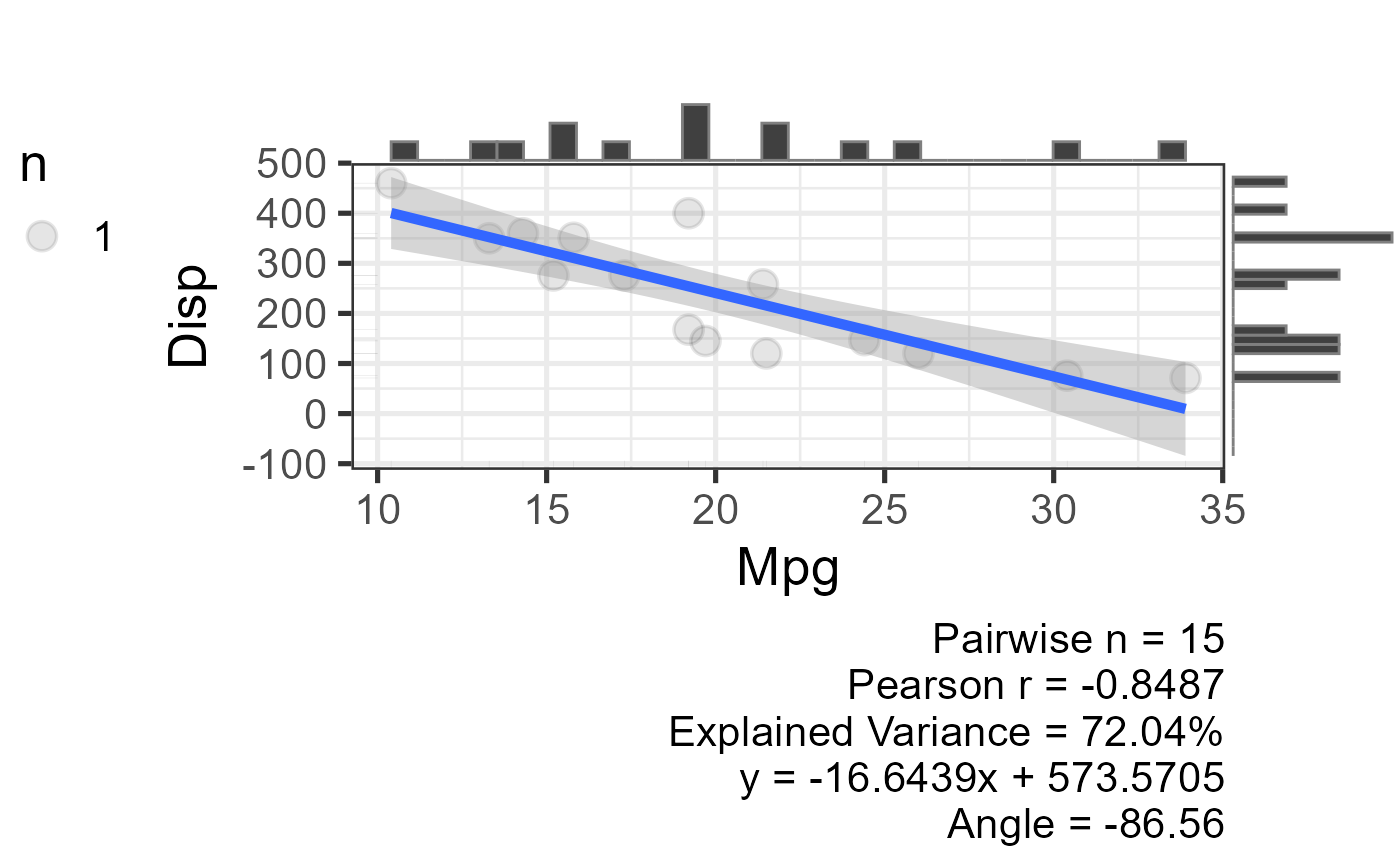
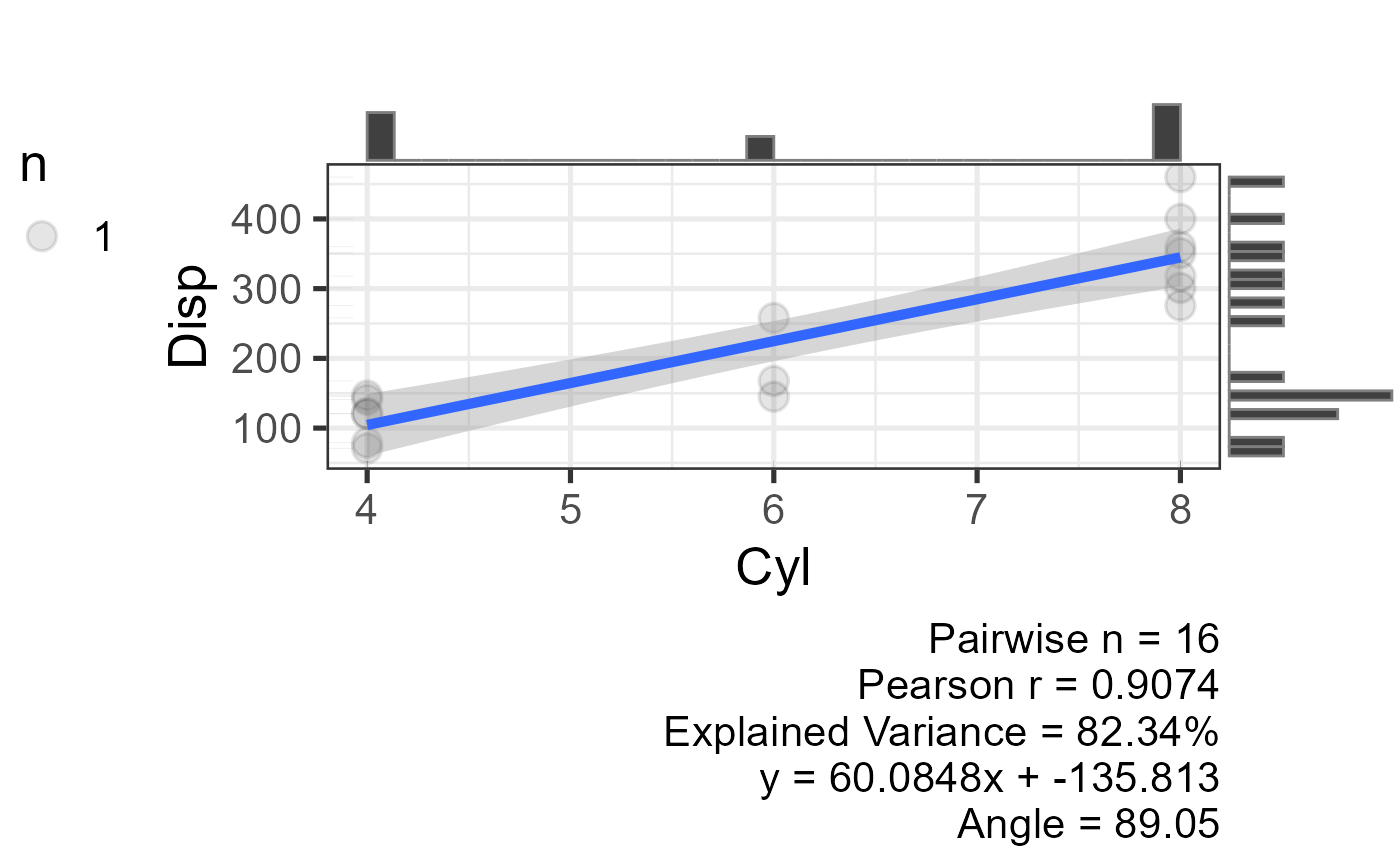 #> $r_lower
#> mpg cyl disp
#> mpg NA NA NA
#> cyl -0.8971 NA NA
#> disp -0.8487 0.9074 NA
#>
#> $r_squared_lower
#> mpg cyl disp
#> mpg NA NA NA
#> cyl 0.8048 NA NA
#> disp 0.7204 0.8234 NA
#>
#> $p_lower
#> mpg cyl disp
#> mpg NA NA NA
#> cyl 0.00001369 NA NA
#> disp 0.00006310 0.000001223 NA
#>
#> $p_lower_adjusted
#> mpg cyl disp
#> mpg NA NA NA
#> cyl 0.00002738 NA NA
#> disp 0.00006310 0.000003669 NA
#>
#> $t_lower
#> mpg cyl disp
#> mpg NA NA NA
#> cyl -7.033 NA NA
#> disp -5.787 8.078 NA
#>
#> $n_lower
#> mpg cyl disp
#> mpg NA NA NA
#> cyl 14 NA NA
#> disp 15 16 NA
#>
#> $se_lower
#> mpg cyl disp
#> mpg NA NA NA
#> cyl 0.1275 NA NA
#> disp 0.1467 0.1123 NA
#>
#> $ci
#> lower r upper p lower.adj upper.adj
#> mpg-cyl -0.9673 -0.8971 -0.6994 0.000013691 -0.9723 -0.6535
#> mpg-disp -0.9486 -0.8487 -0.5953 0.000063105 -0.9486 -0.5953
#> cyl-disp 0.7482 0.9074 0.9678 0.000001223 0.6903 0.9746
#>
#> $call
#> function_arguments function_values
#> 1 Use pairwise
#> 2 Method pearson
#> 3 Adjustment for Probability values holm
#> 4 Alpha 0.05
#> 5 Confidence Interval TRUE
#>
report_correlation(x=mtcars[,1:3],file="correlation")
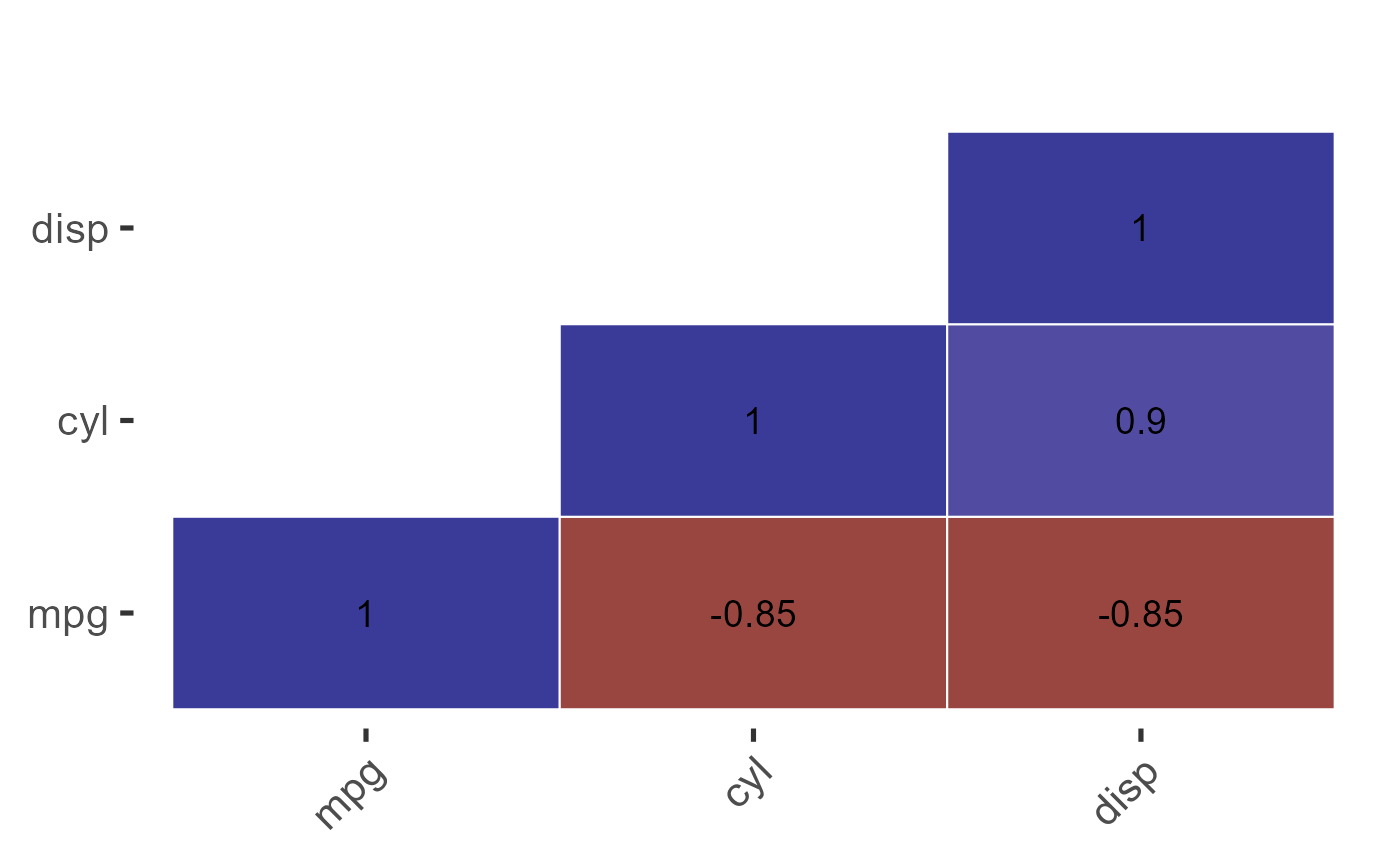
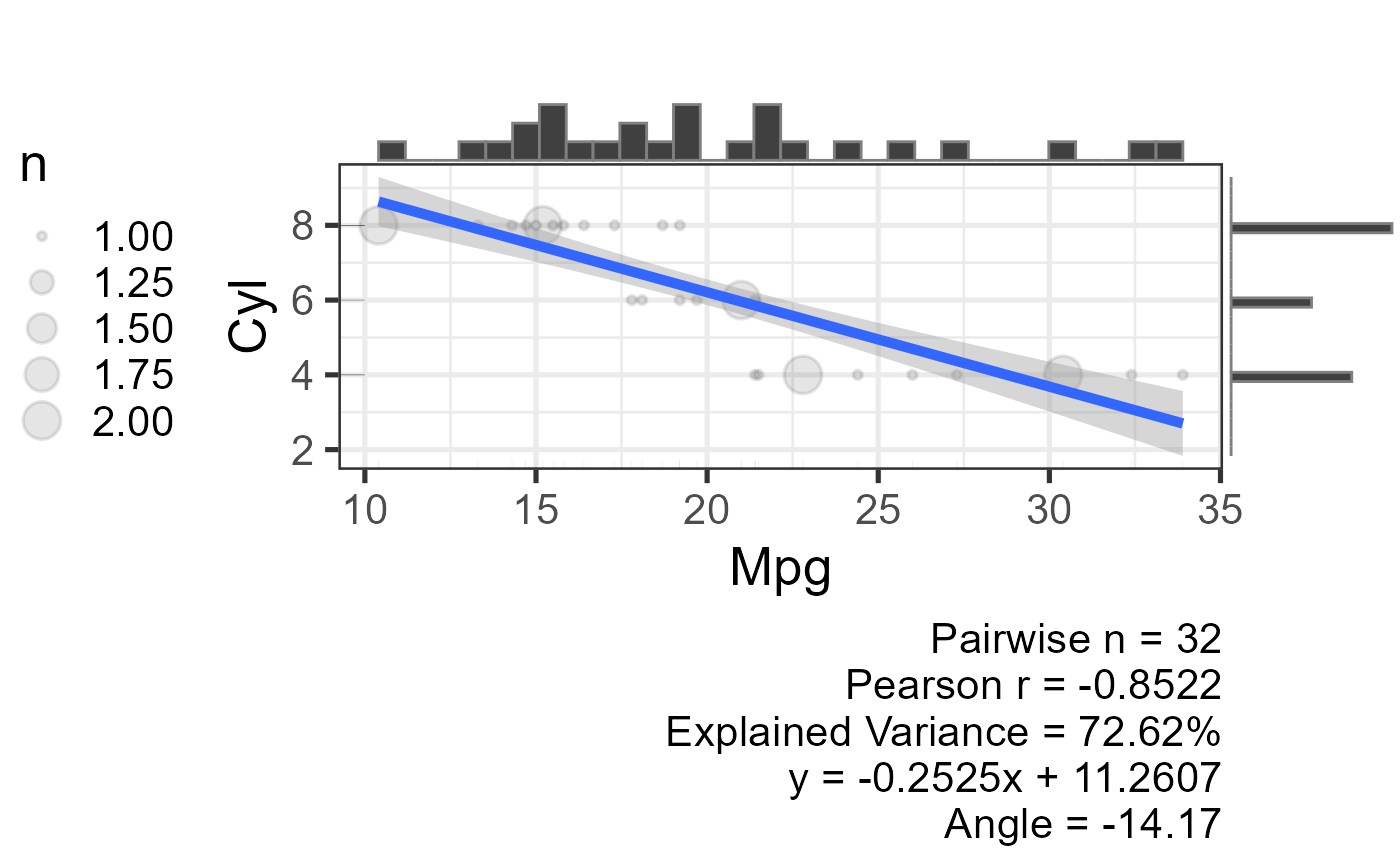
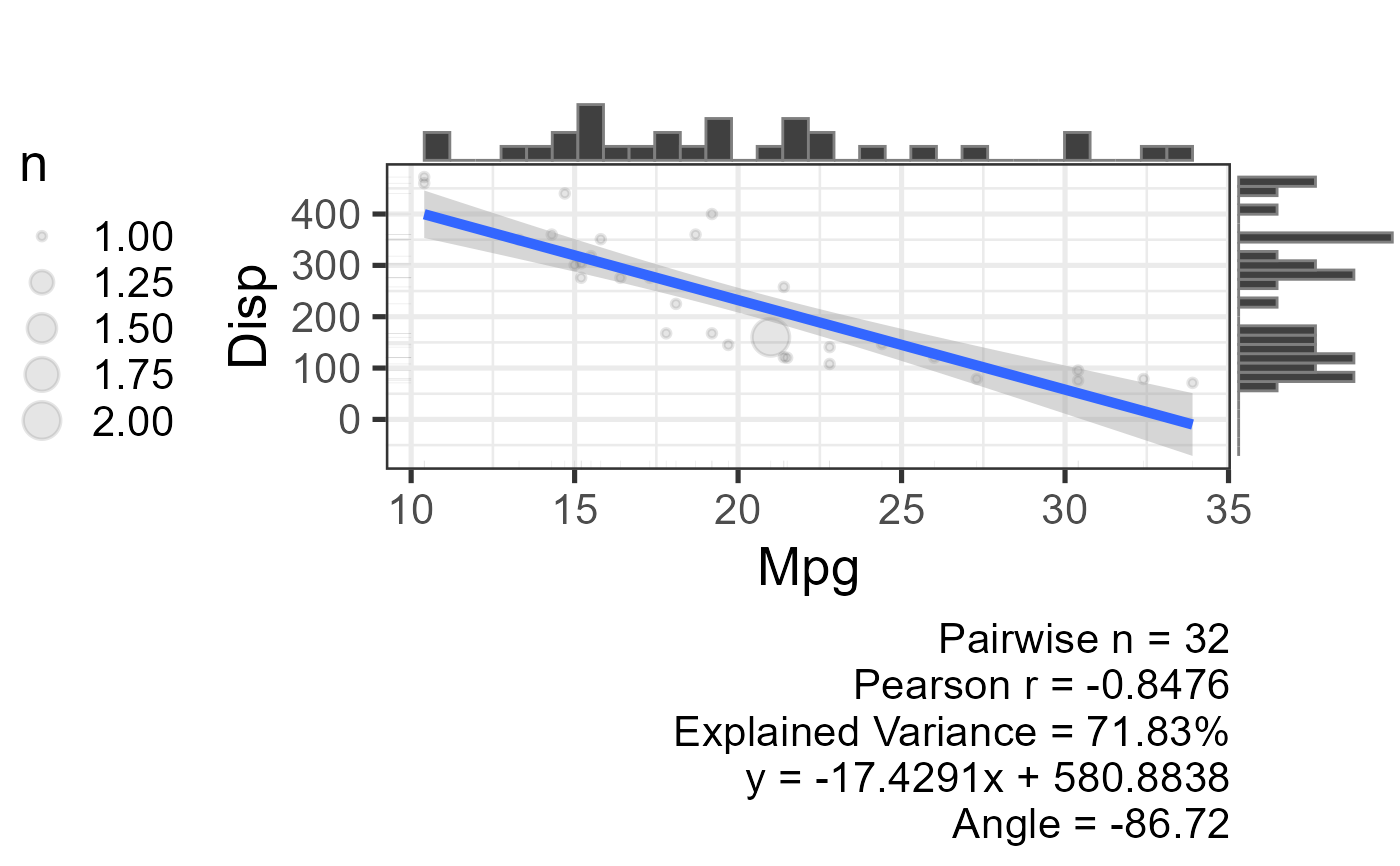
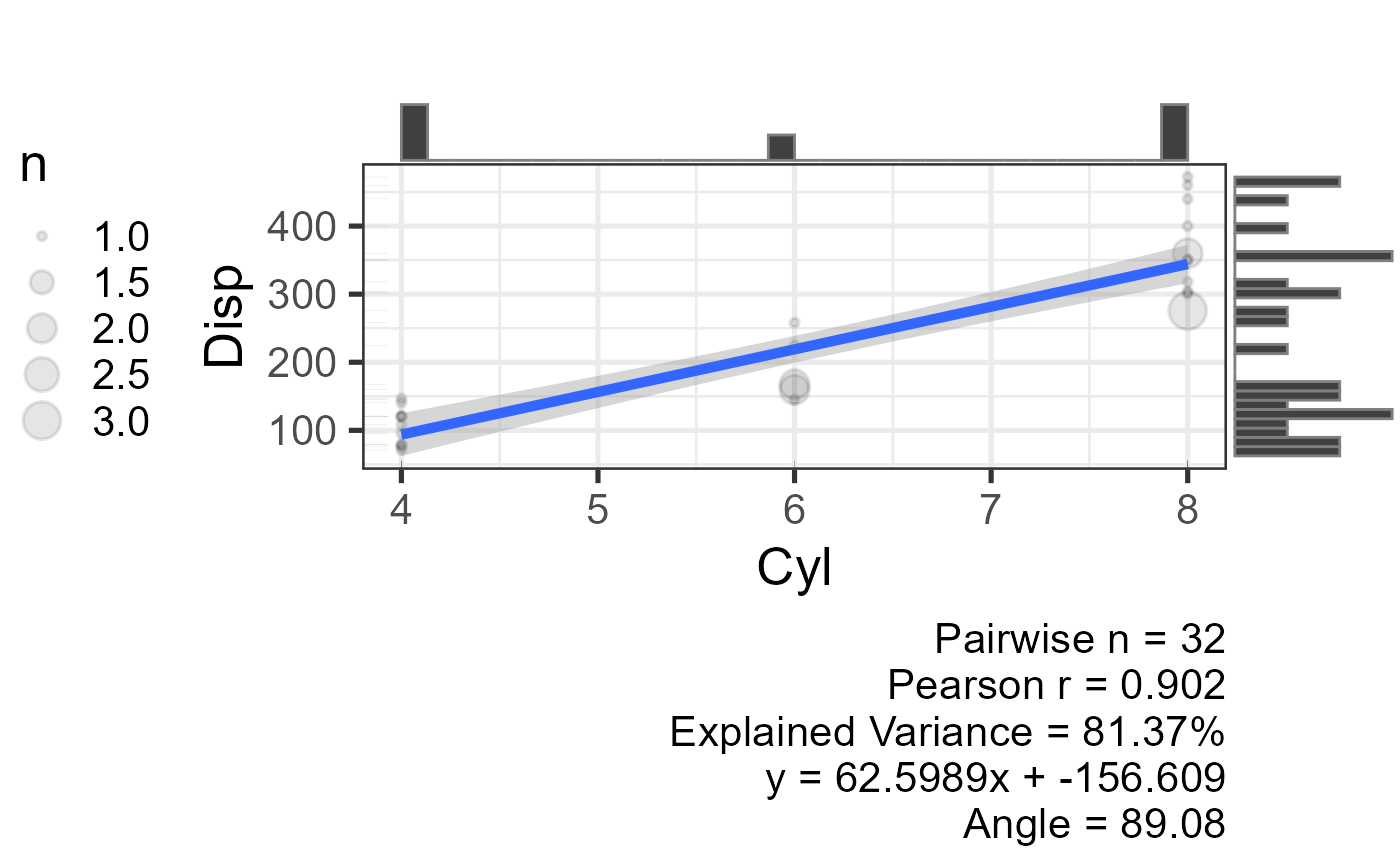 #> $r_lower
#> mpg cyl disp
#> mpg NA NA NA
#> cyl -0.8522 NA NA
#> disp -0.8476 0.902 NA
#>
#> $r_squared_lower
#> mpg cyl disp
#> mpg NA NA NA
#> cyl 0.7262 NA NA
#> disp 0.7183 0.8137 NA
#>
#> $p_lower
#> mpg cyl disp
#> mpg NA NA NA
#> cyl 0.0000000006113 NA NA
#> disp 0.0000000009380 0.000000000001803 NA
#>
#> $p_lower_adjusted
#> mpg cyl disp
#> mpg NA NA NA
#> cyl 0.000000001223 NA NA
#> disp 0.000000001223 0.000000000005409 NA
#>
#> $t_lower
#> mpg cyl disp
#> mpg NA NA NA
#> cyl -8.920 NA NA
#> disp -8.747 11.45 NA
#>
#> $n_lower
#> n
#> 1 32
#>
#> $se_lower
#> mpg cyl disp
#> mpg NA NA NA
#> cyl 0.09554 NA NA
#> disp 0.09689 0.07881 NA
#>
#> $ci
#> lower r upper p lower.adj upper.adj
#> mpg-cyl -0.9258 -0.8522 -0.7163 0.000000000611269 -0.9329 -0.6899
#> mpg-disp -0.9234 -0.8476 -0.7081 0.000000000938033 -0.9234 -0.7081
#> cyl-disp 0.8072 0.9020 0.9515 0.000000000001803 0.7773 0.9585
#>
#> $call
#> function_arguments function_values
#> 1 Use pairwise
#> 2 Method pearson
#> 3 Adjustment for Probability values holm
#> 4 Alpha 0.05
#> 5 Confidence Interval TRUE
#>