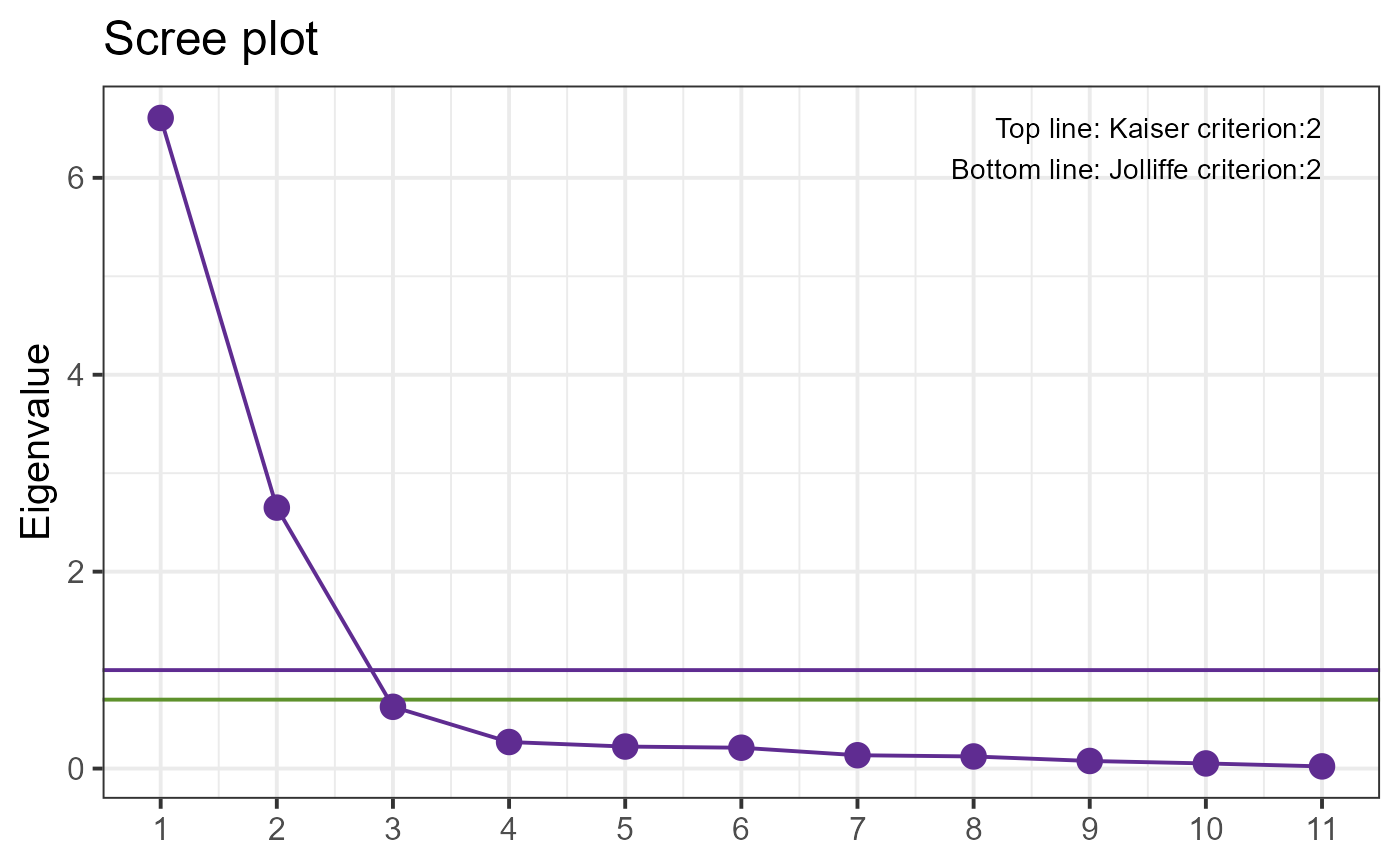
Scree plot displaying the Kaiser and Jolife criteria for factor extraction
Source:R/GLM_EFA.R
plot_scree.RdScree plot displaying the Kaiser and Jolife criteria for factor extraction
Usage
plot_scree(df, base_size = 15, title = "", color = c("#5F2C91", "#5E912C"))