Generates a ROC curve from observed outcomes and predicted probabilities.
Arguments
- observed
Vector of observed outcomes. These are the true class labels.
- predicted
Vector of predicted outcome probabilities. These are the predicted probabilities for the positive class.
- base_size
Integer value representing the base font size for the plot. Defaults to 10.
- title
String representing the title of the plot. Defaults to an empty string.
Details
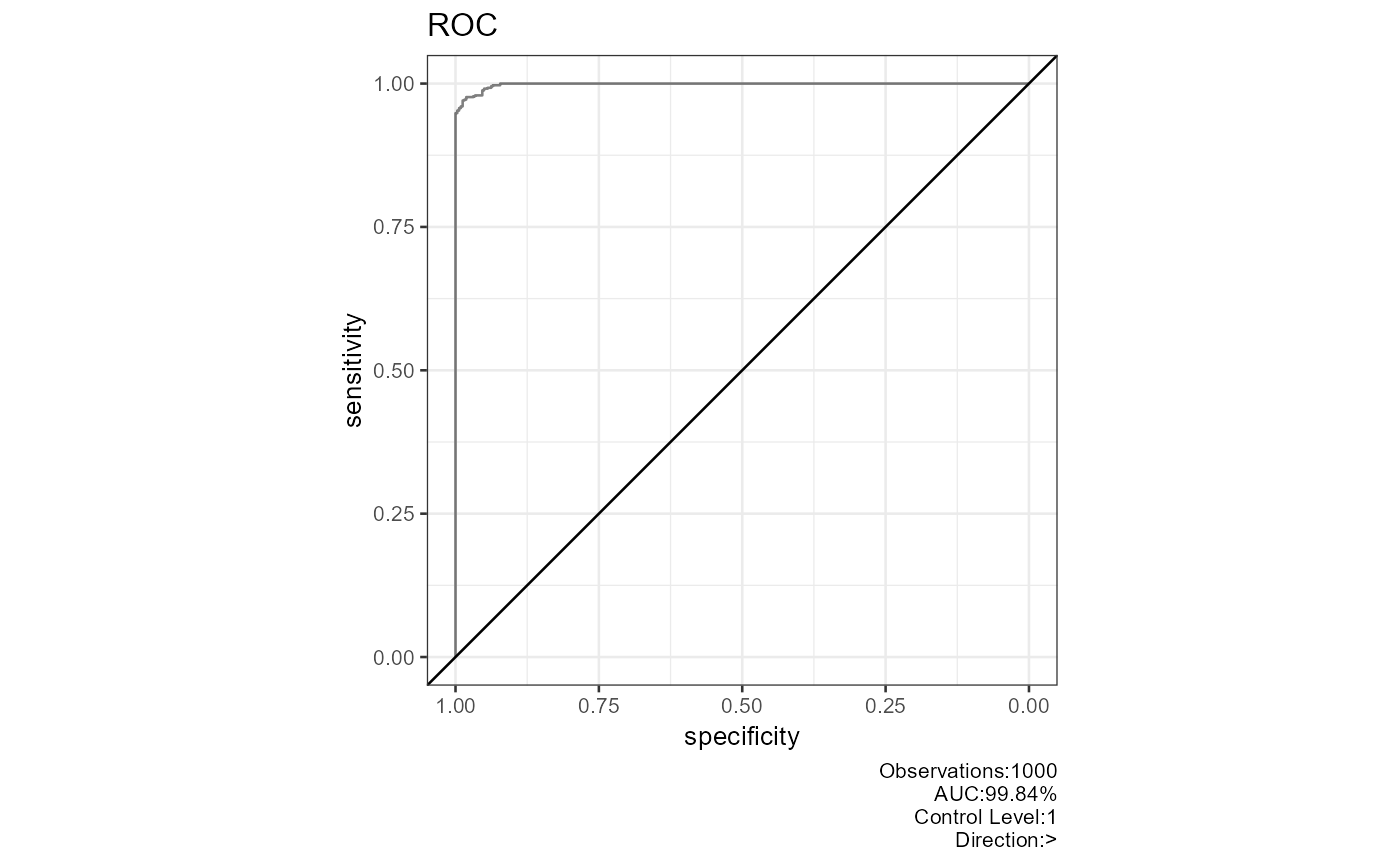
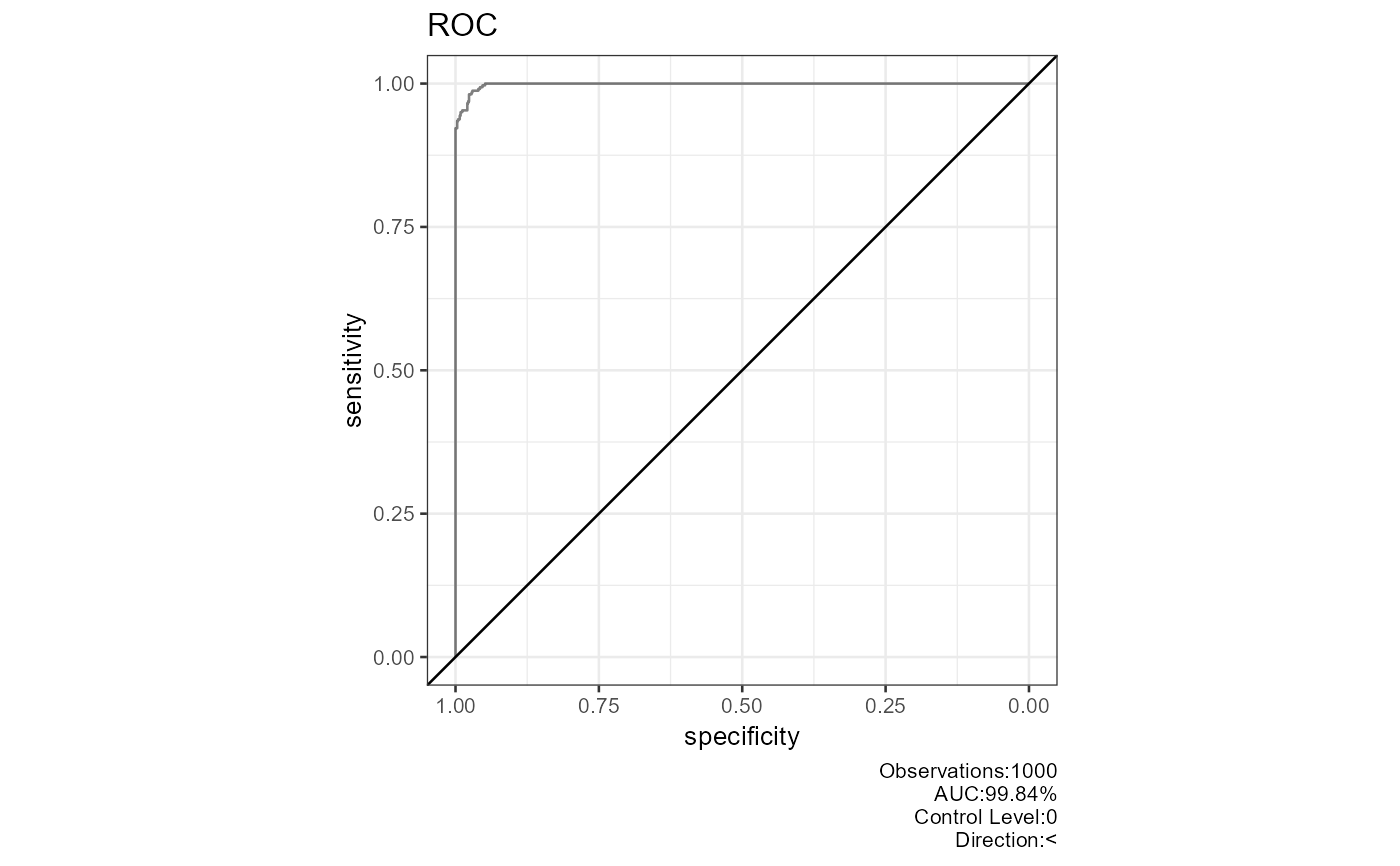
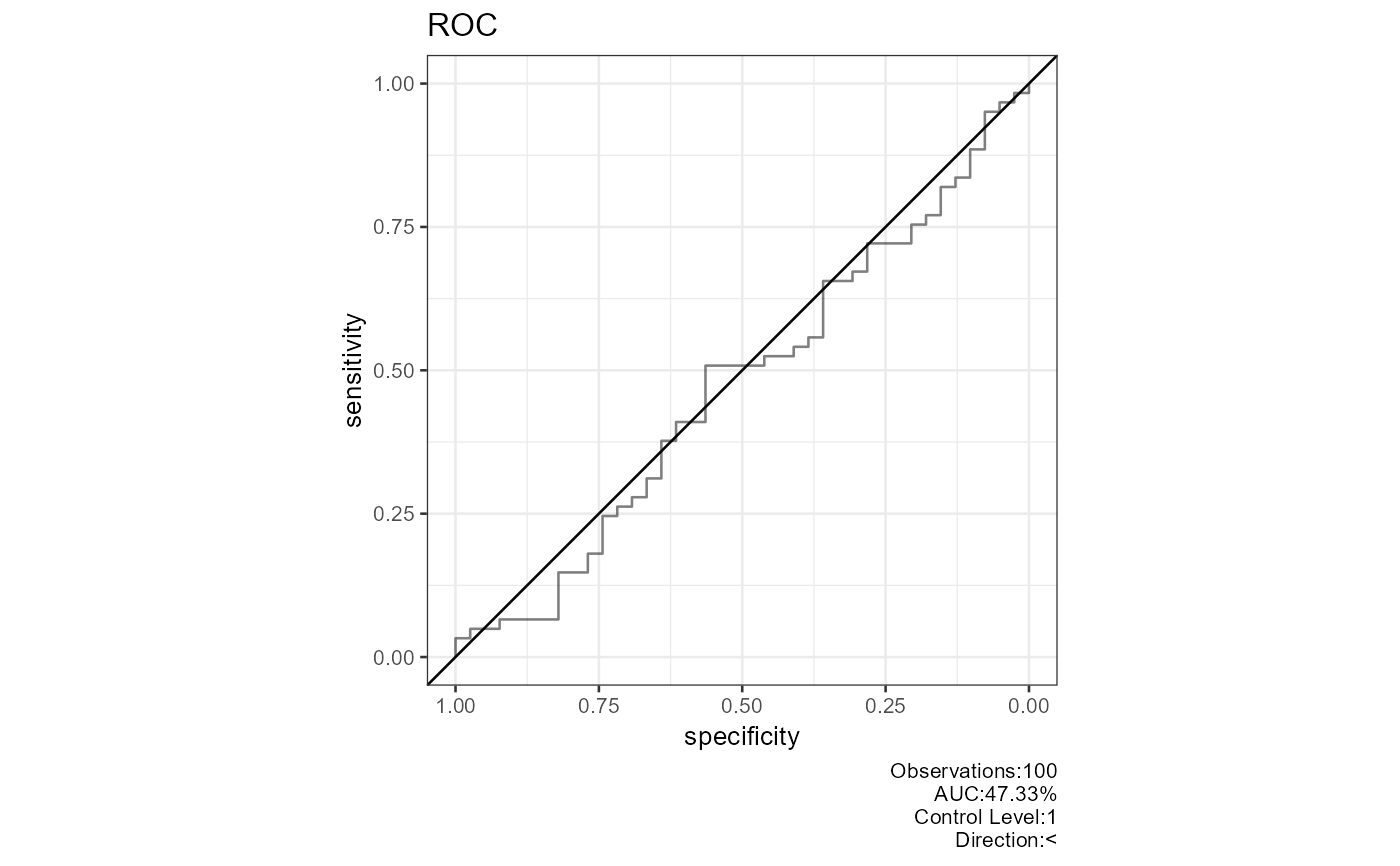
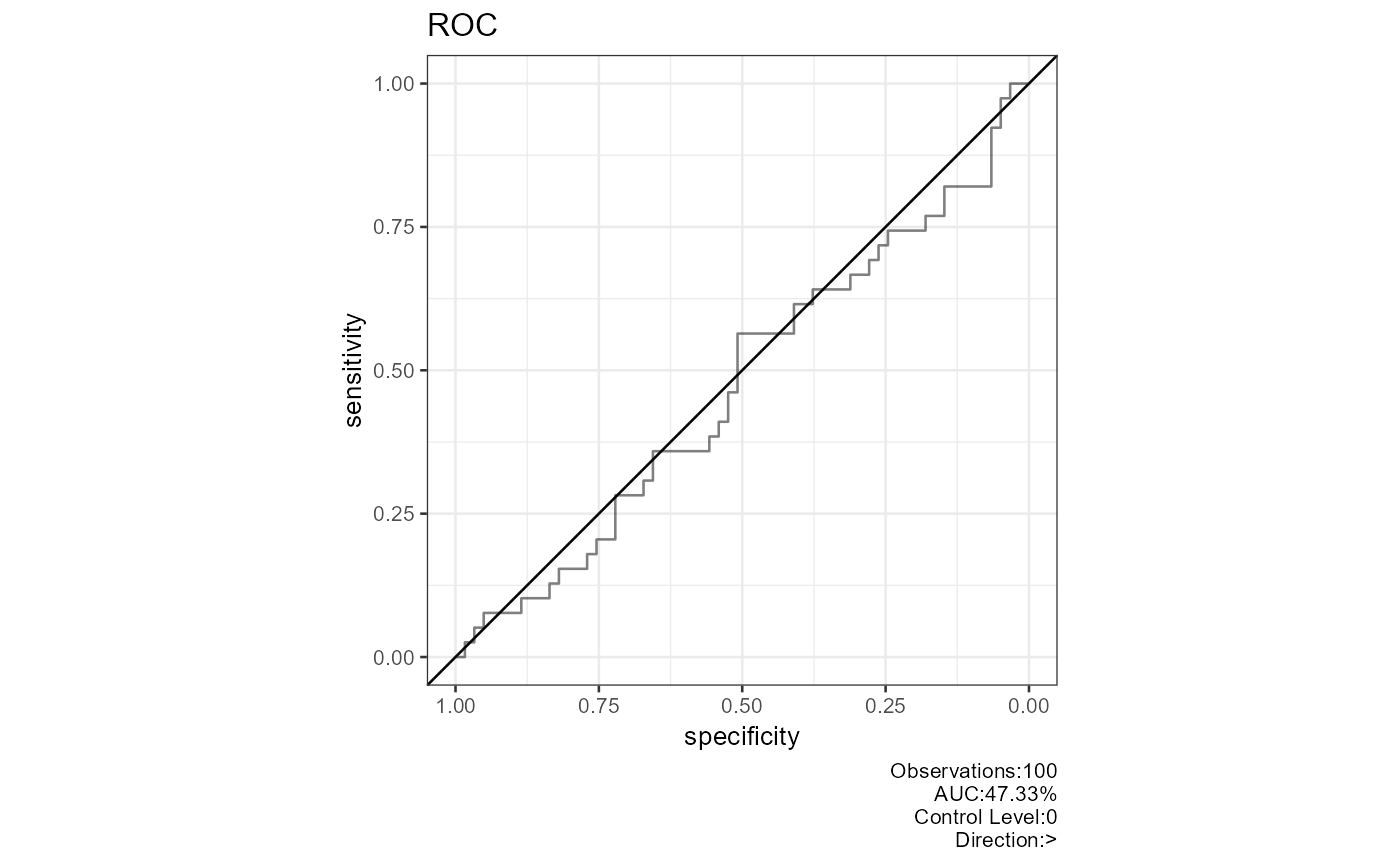
This function generates a ROC curve to evaluate the performance of a binary classification model. The ROC curve is a plot of the true positive rate (TPR) against the false positive rate (FPR) at various threshold settings.
The function performs the following steps: 1. Computes the ROC curve and its confidence interval using `pROC::roc`. 2. Generates ROC plots for both reversed and non-reversed order of class levels. 3. Creates a list of ROC plots,each with an AUC value,control level,and direction.
The output is a list of ggplot objects representing the ROC curves for different class level orders.
Examples
# Example with random observed and predicted values
observed<-round(abs(rnorm(100,m=0,sd=0.5)))
predicted<-abs(rnorm(100,m=0,sd=0.5))
plot_roc(observed=observed,predicted=predicted)
 # Example with generated correlation matrix
df1<-data.frame(matrix(0.999,ncol=2,nrow=2))
correlation_matrix<-as.matrix(df1)
diag(correlation_matrix)<-1
df1<-generate_correlation_matrix(correlation_matrix,nrows=1000)
df1$X1<-ifelse(abs(df1$X1) < 1,0,1)
df1$X2<-abs(df1$X2)
df1$X2<-(df1$X2-min(df1$X2))/(max(df1$X2)-min(df1$X2))
plot_roc(observed=round(abs(df1$X1),0),predicted=abs(df1$X2))