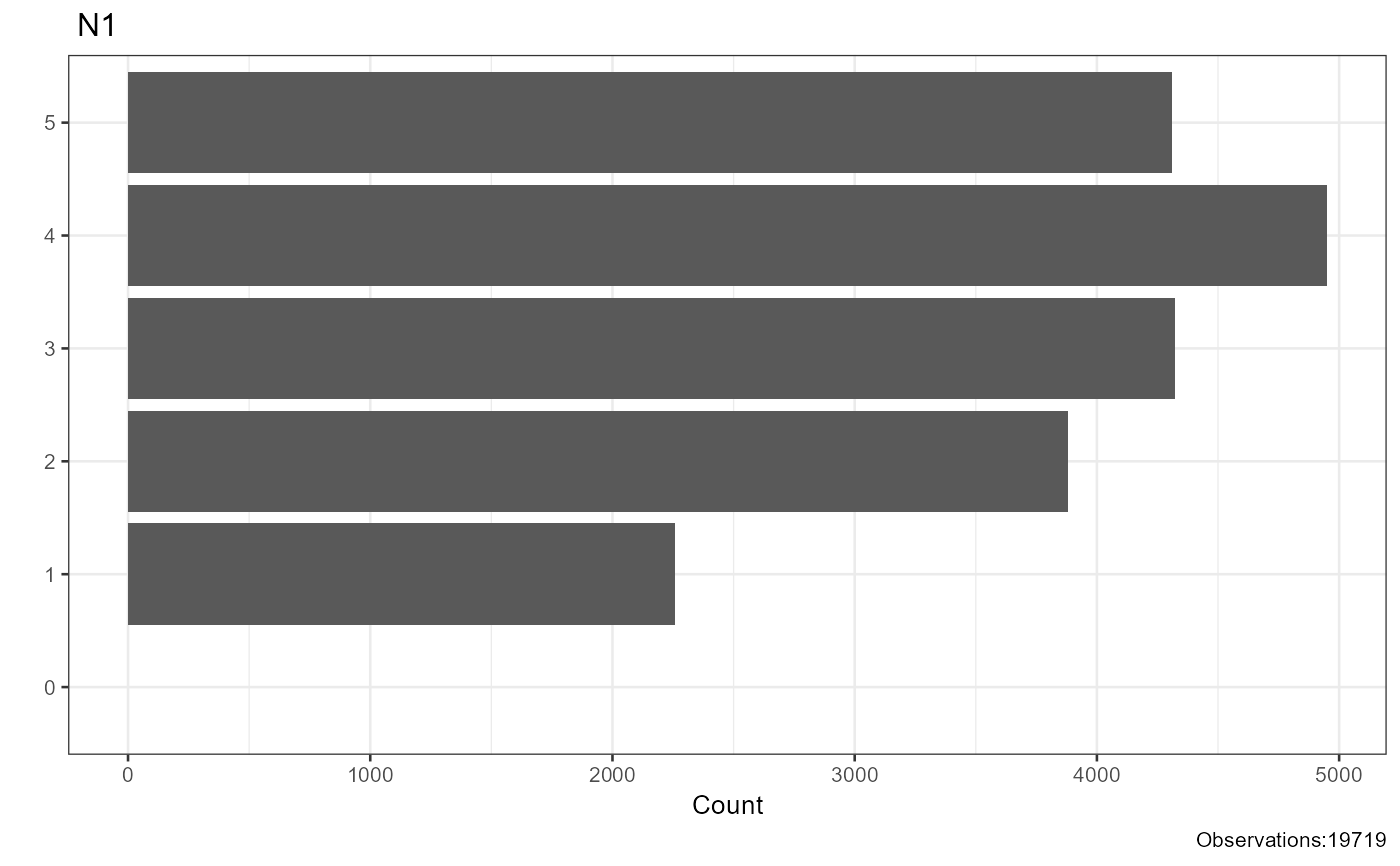
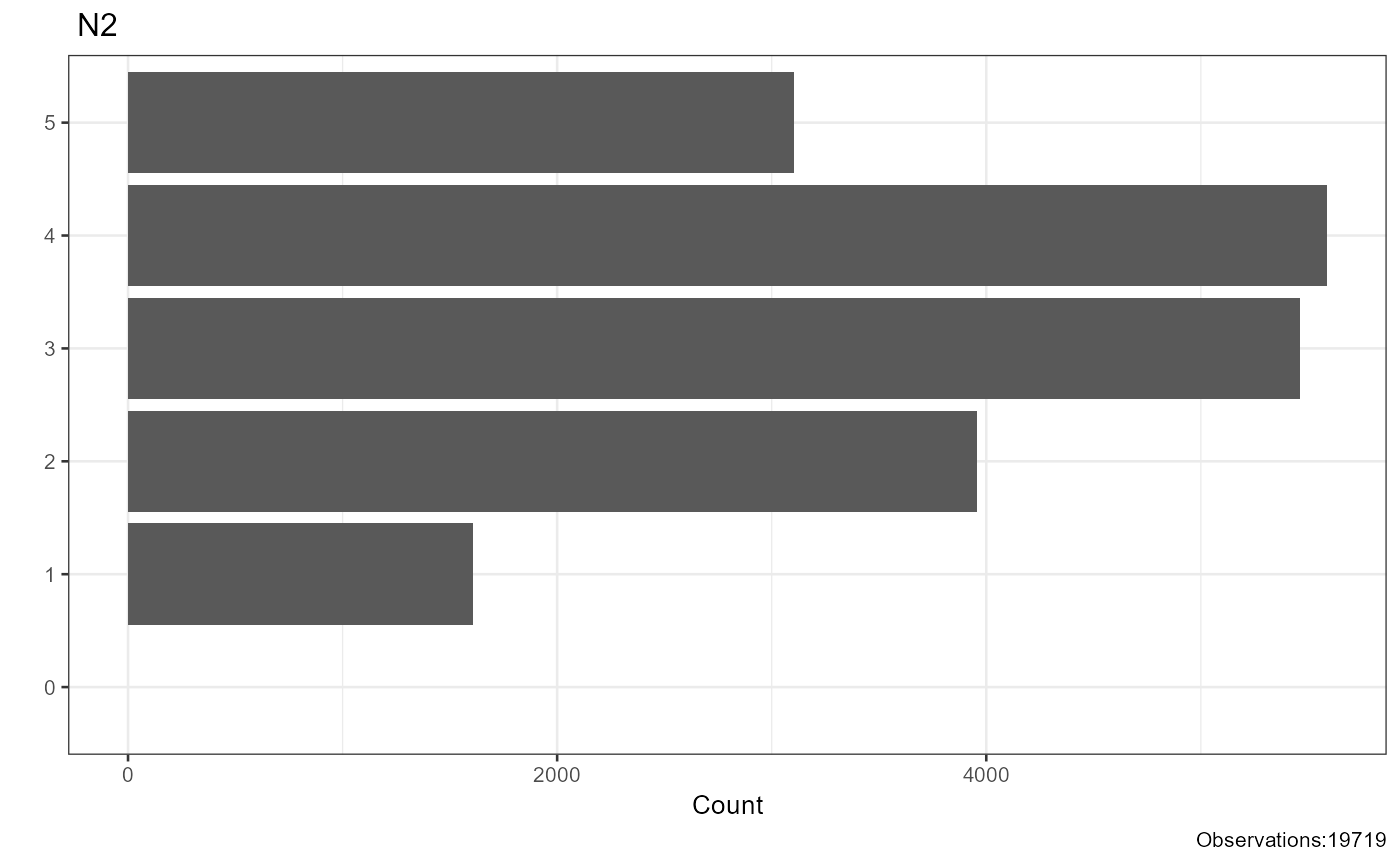
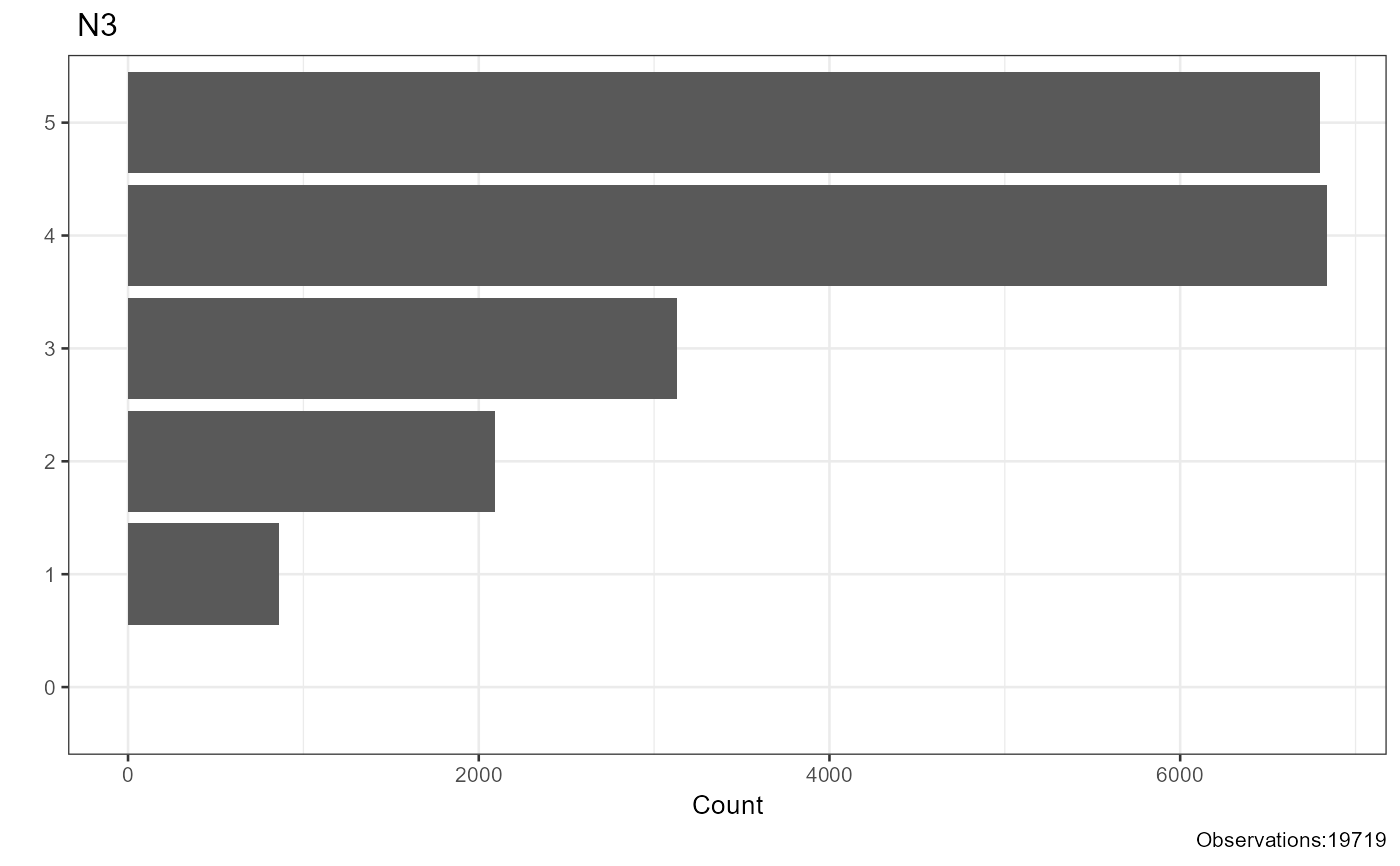
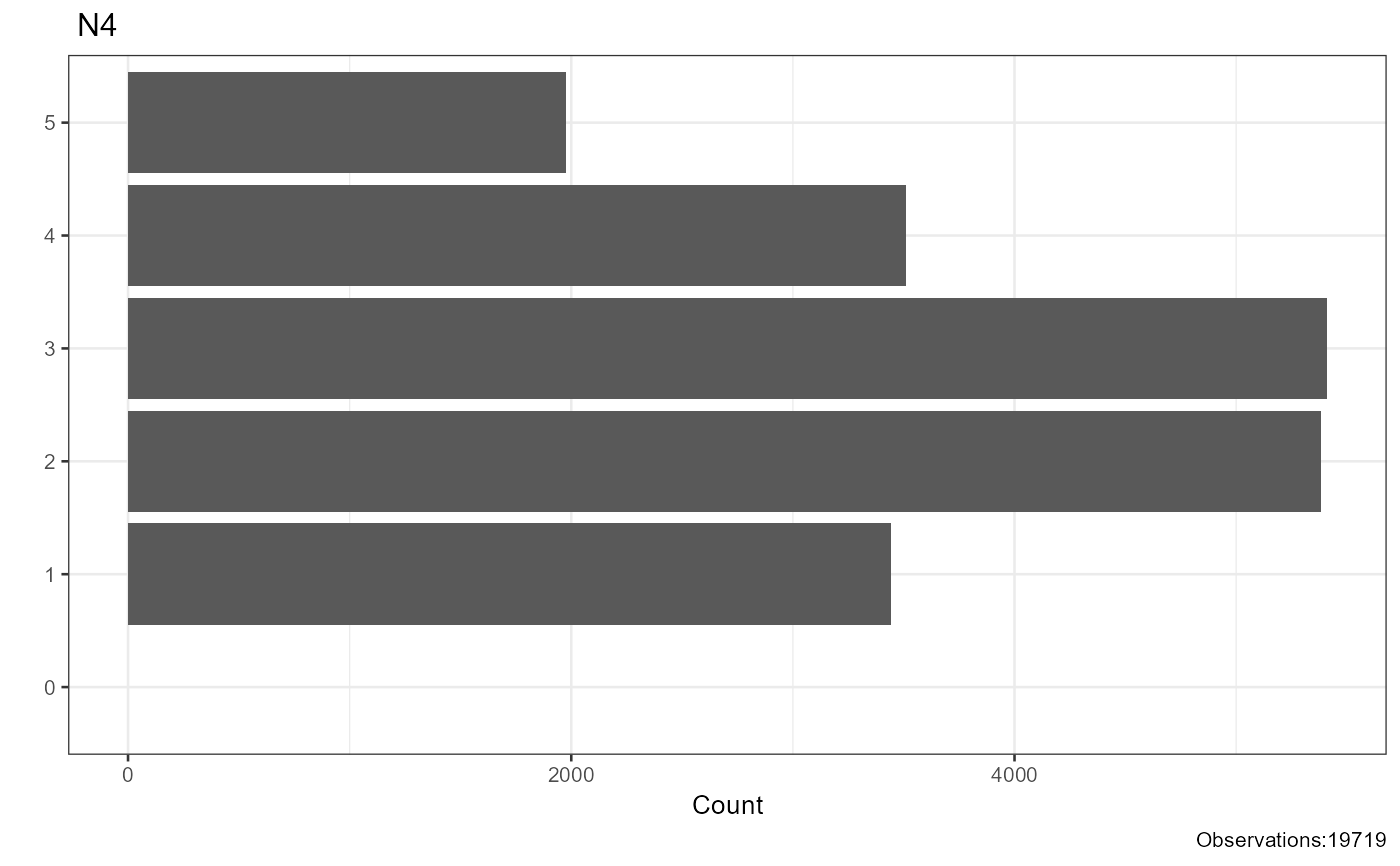
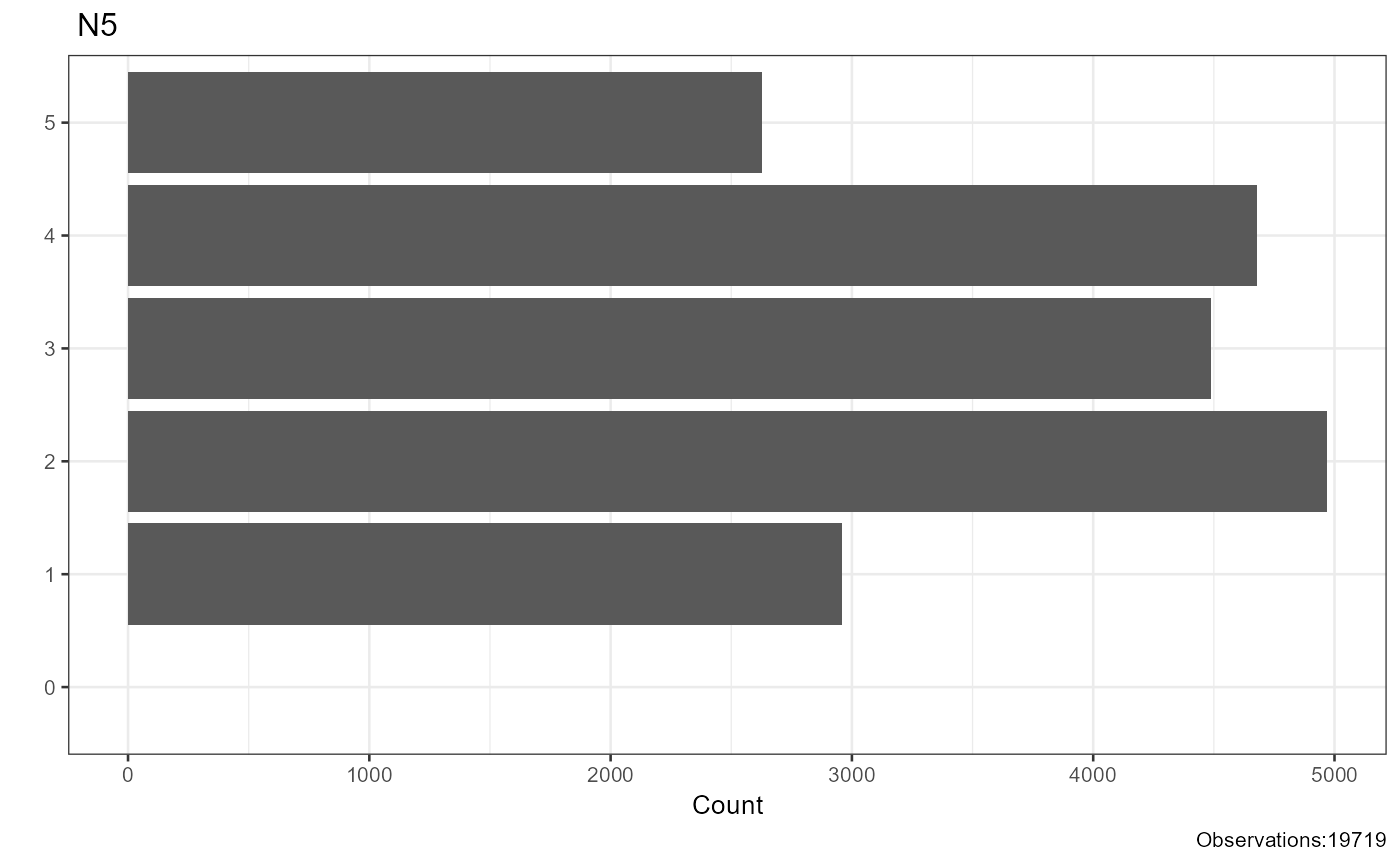
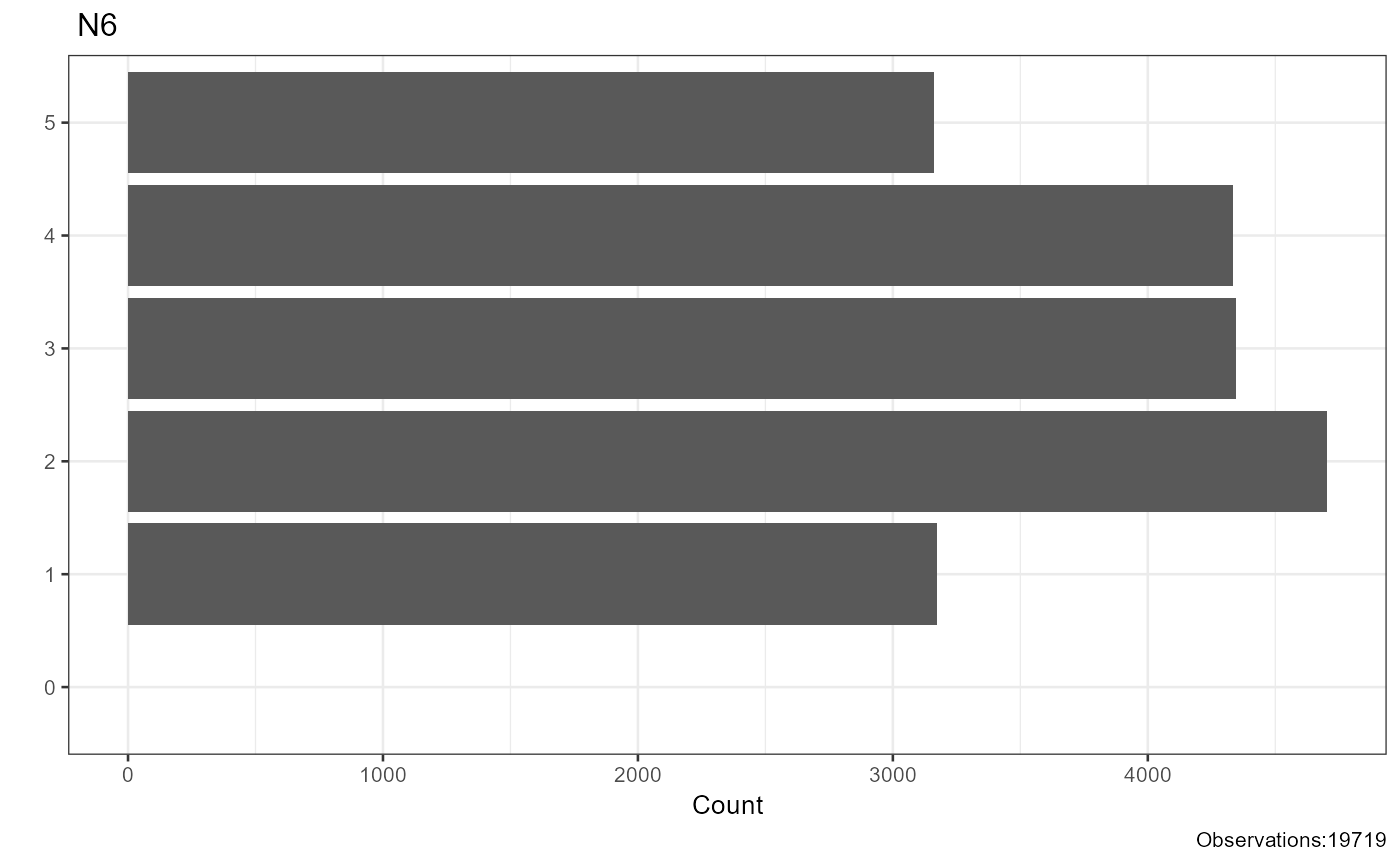
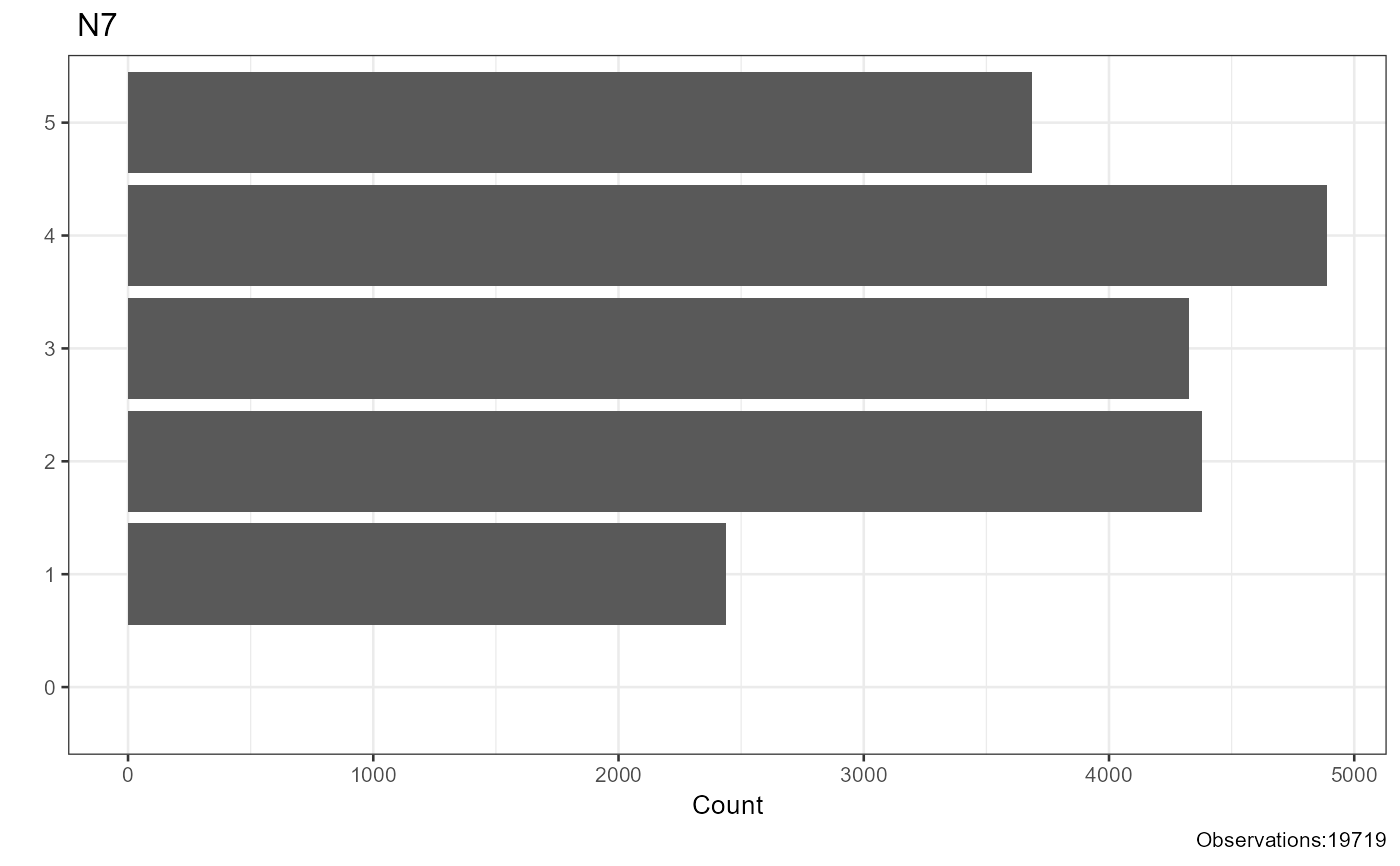
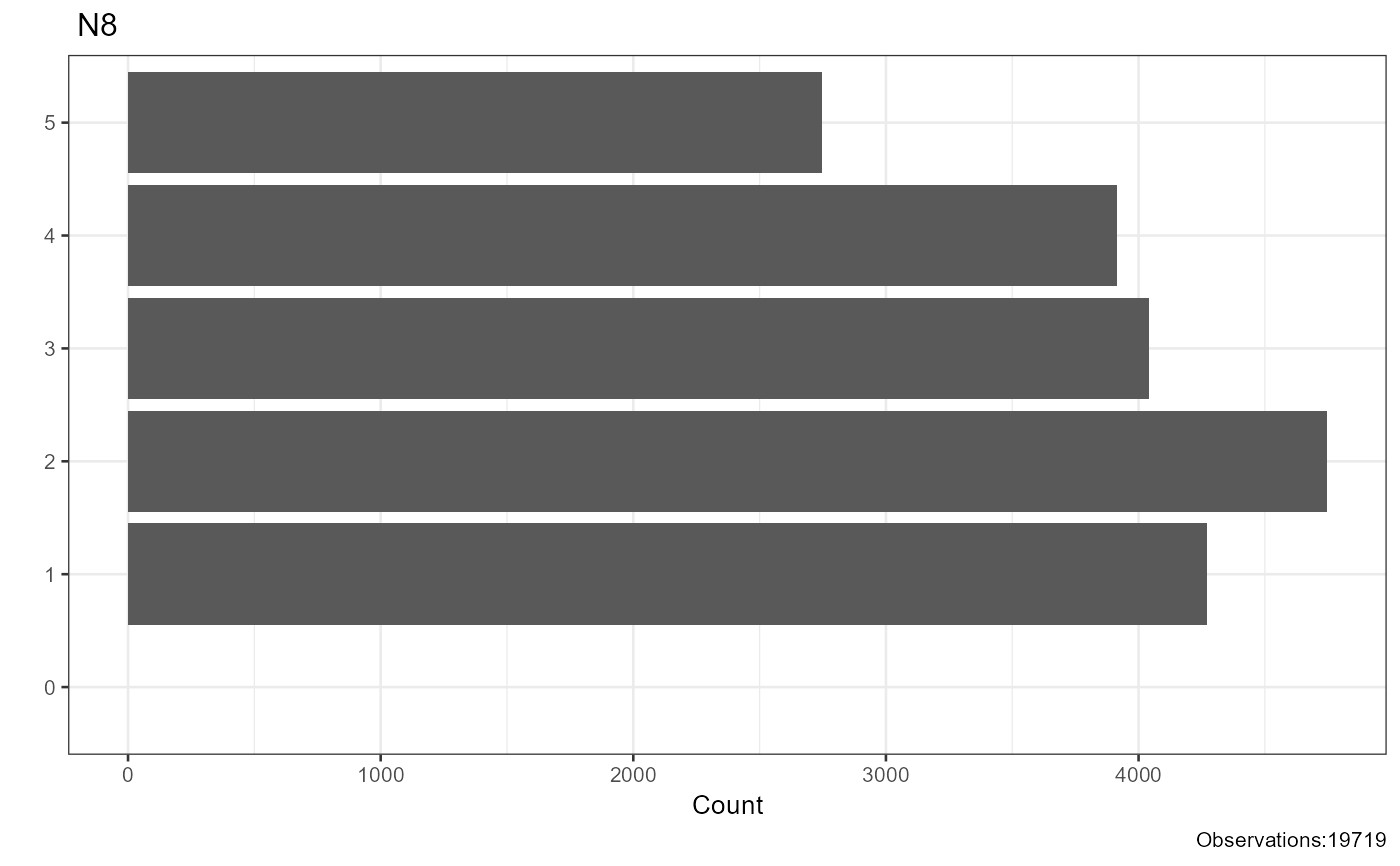
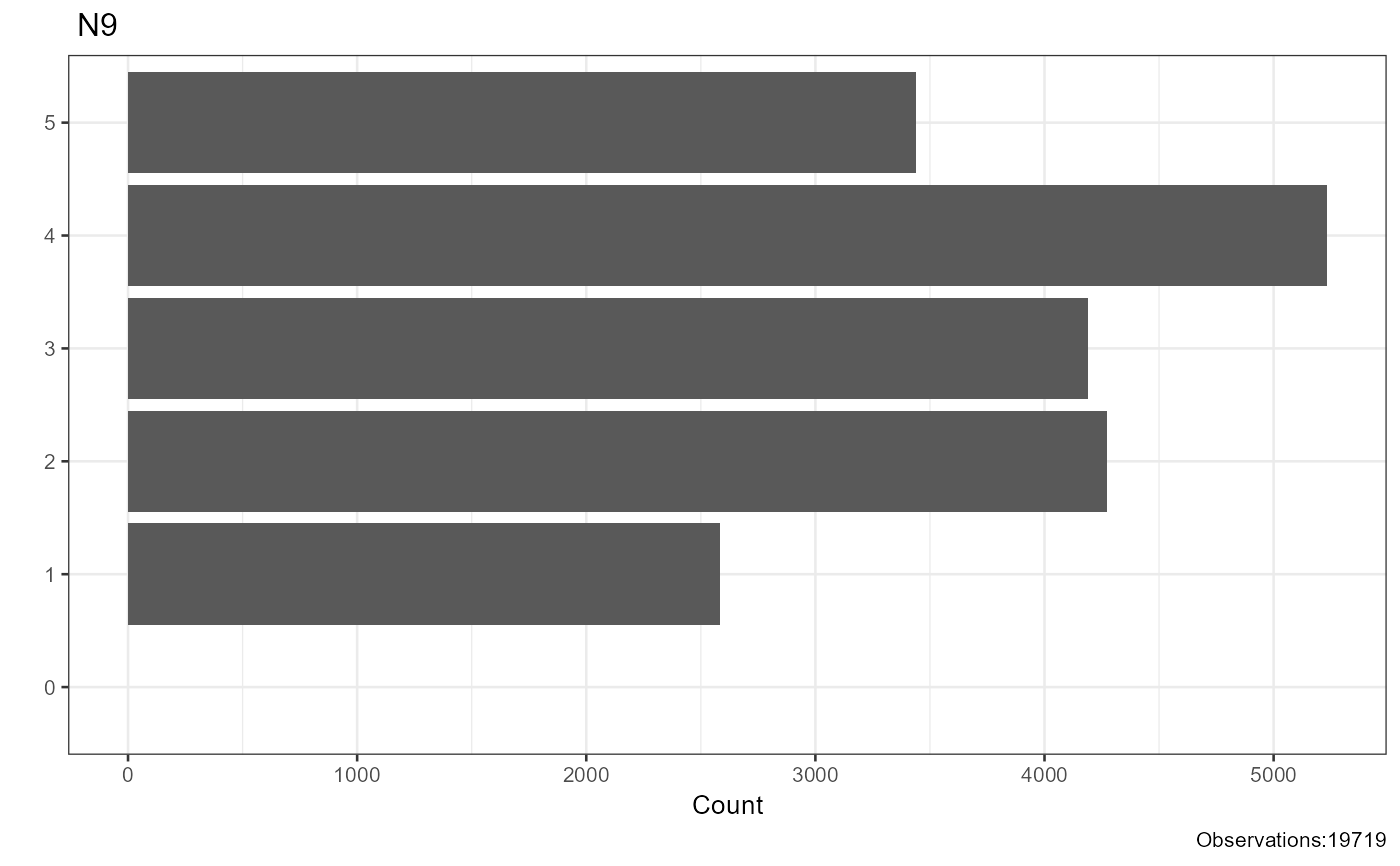
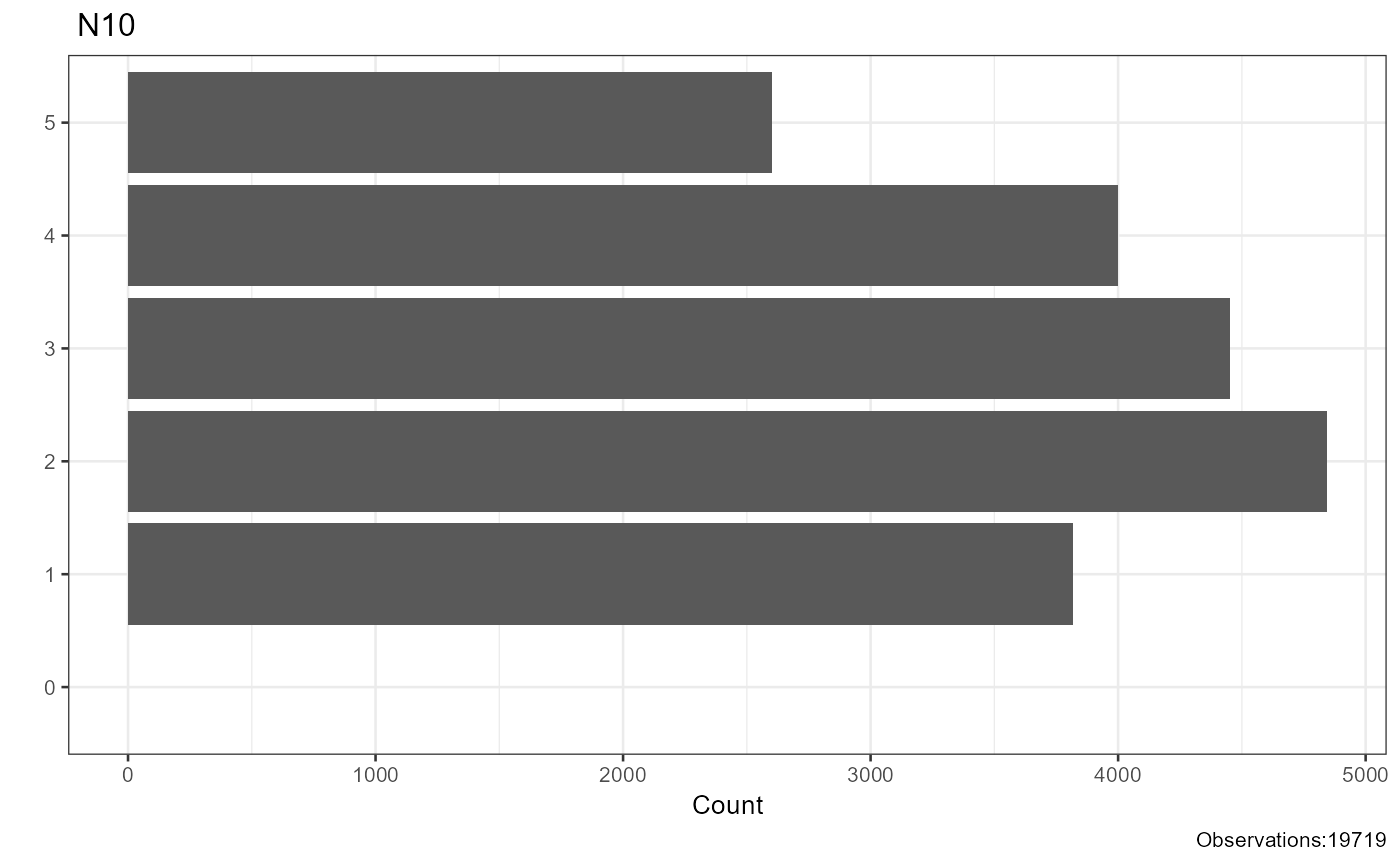
Horizontal bar charts of response frequencies
Source:R/EXPLORE_DESCRIPTIVES.R
plot_response_frequencies.RdCreates one horizontal bar chart per variable showing the frequency count of each observed level. Missing values are excluded before tabulation. Variables with no valid observations are silently dropped from the output.
Usage
plot_response_frequencies(
  df,
  factor_index,
  base_size = 10,
  title = "",
  width = 100,
  reorder = FALSE
)
Arguments
- df
A data frame containing the variables to plot.
- factor_index
Integer vector of column indices identifying the variables to plot.
- base_size
Base font size passed to
theme_bw(). Default is10.- title
Character string prepended to each plot title. Default is
"".- width
Integer controlling the character wrap width applied to the variable name in the plot title. Default is
100.- reorder
Logical. When
TRUEbars are ordered by frequency in ascending order (longest bar at the top). WhenFALSE(default) the original level order is preserved.