For every combination of independent variable (IV) and dependent
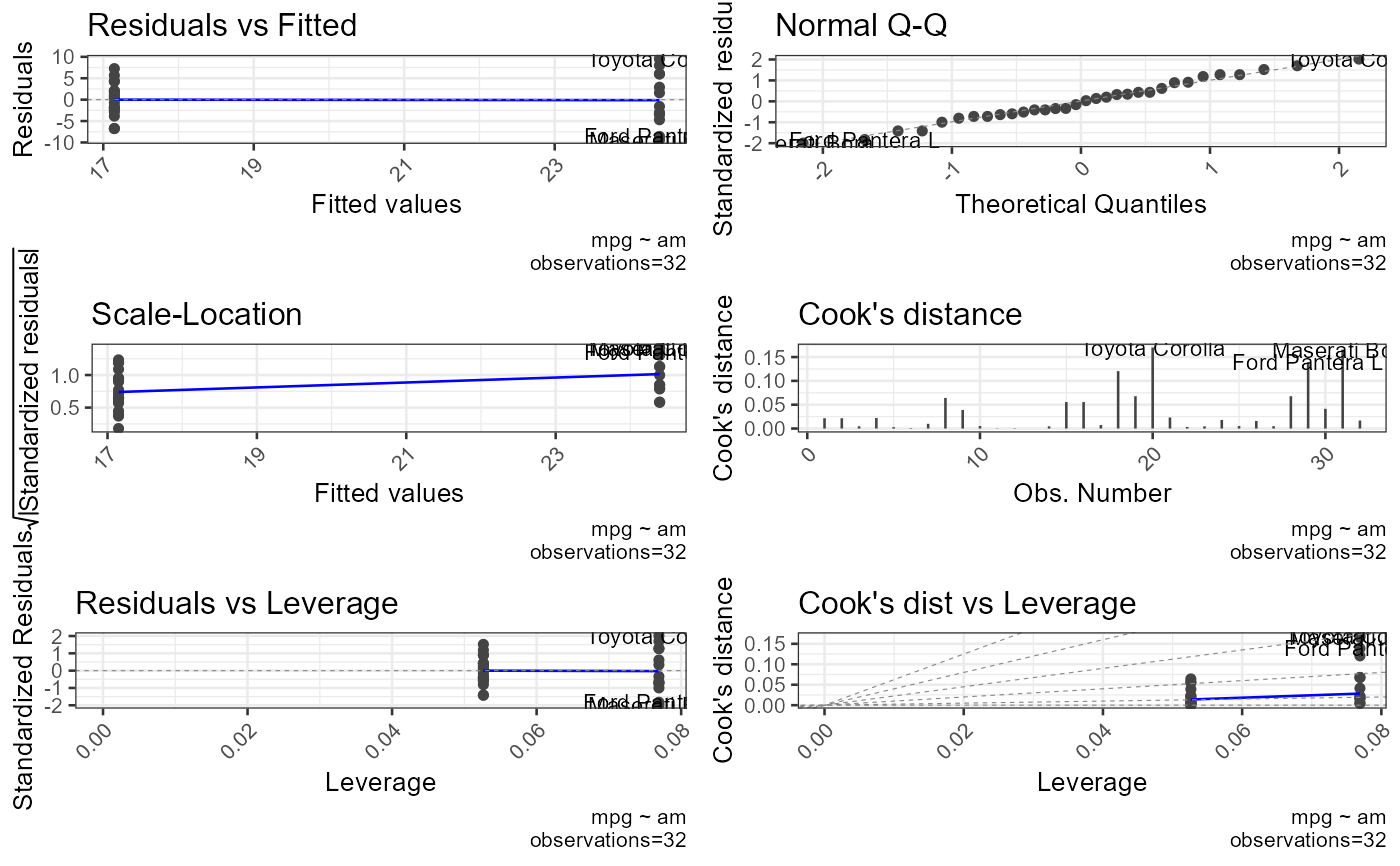
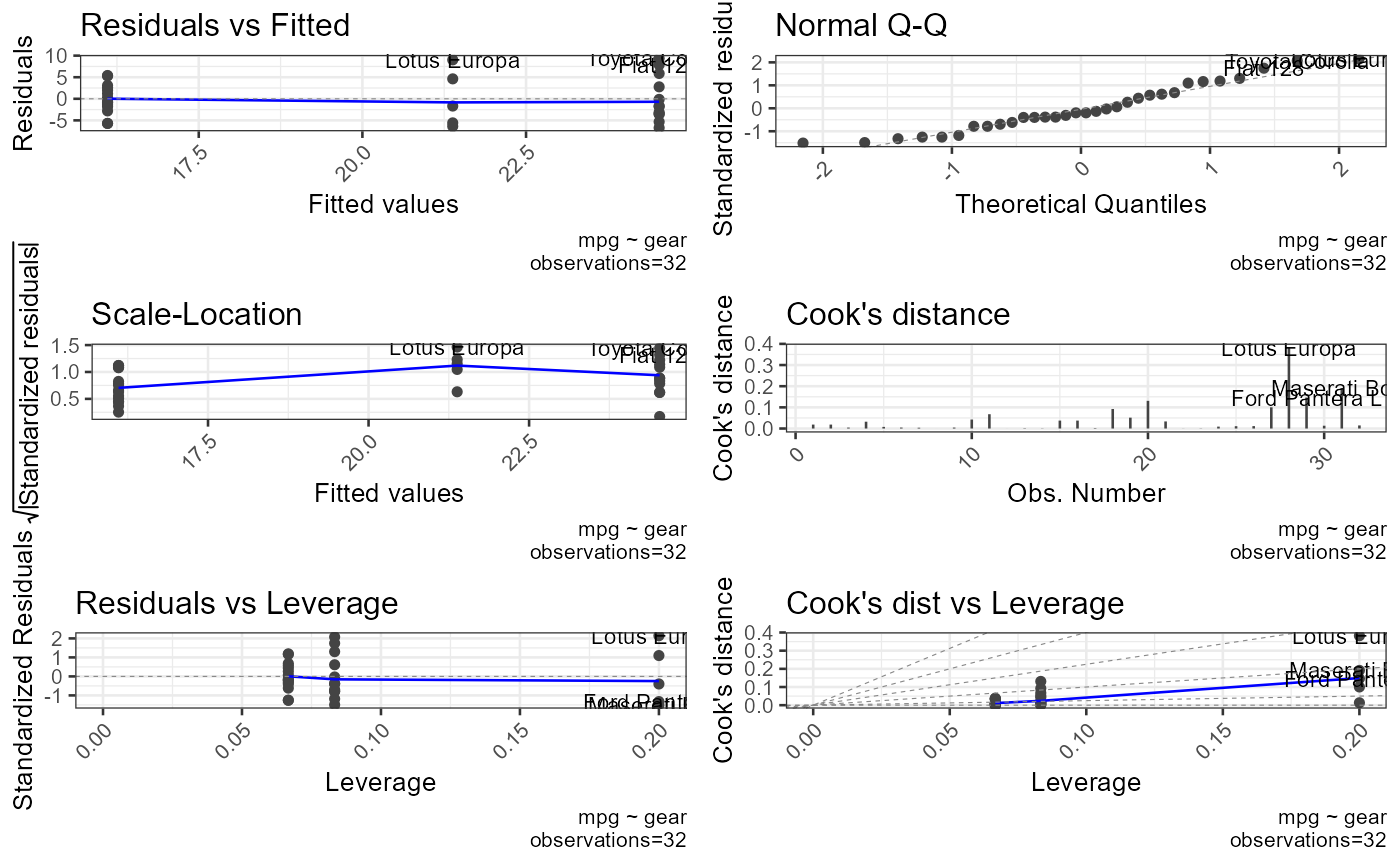
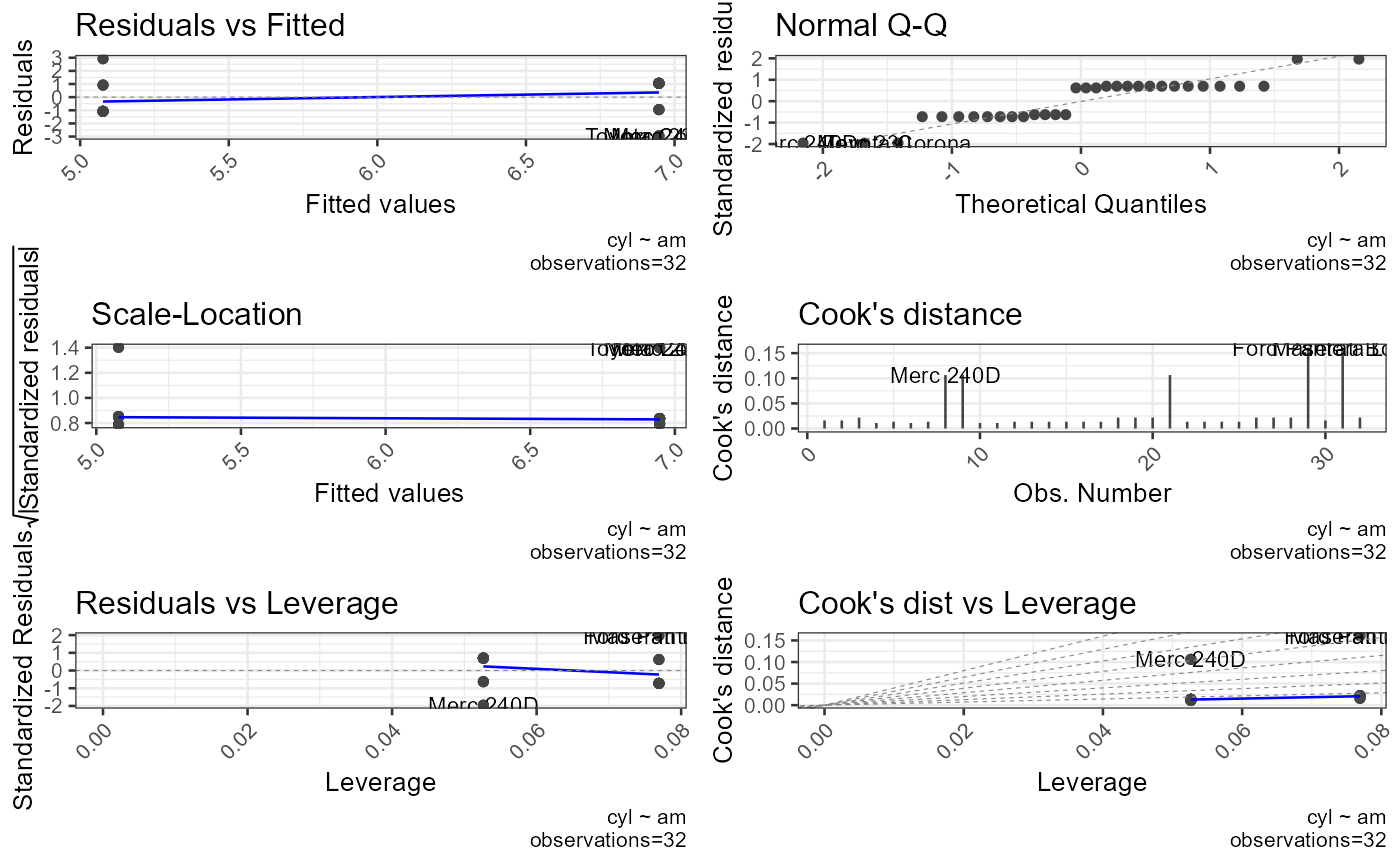
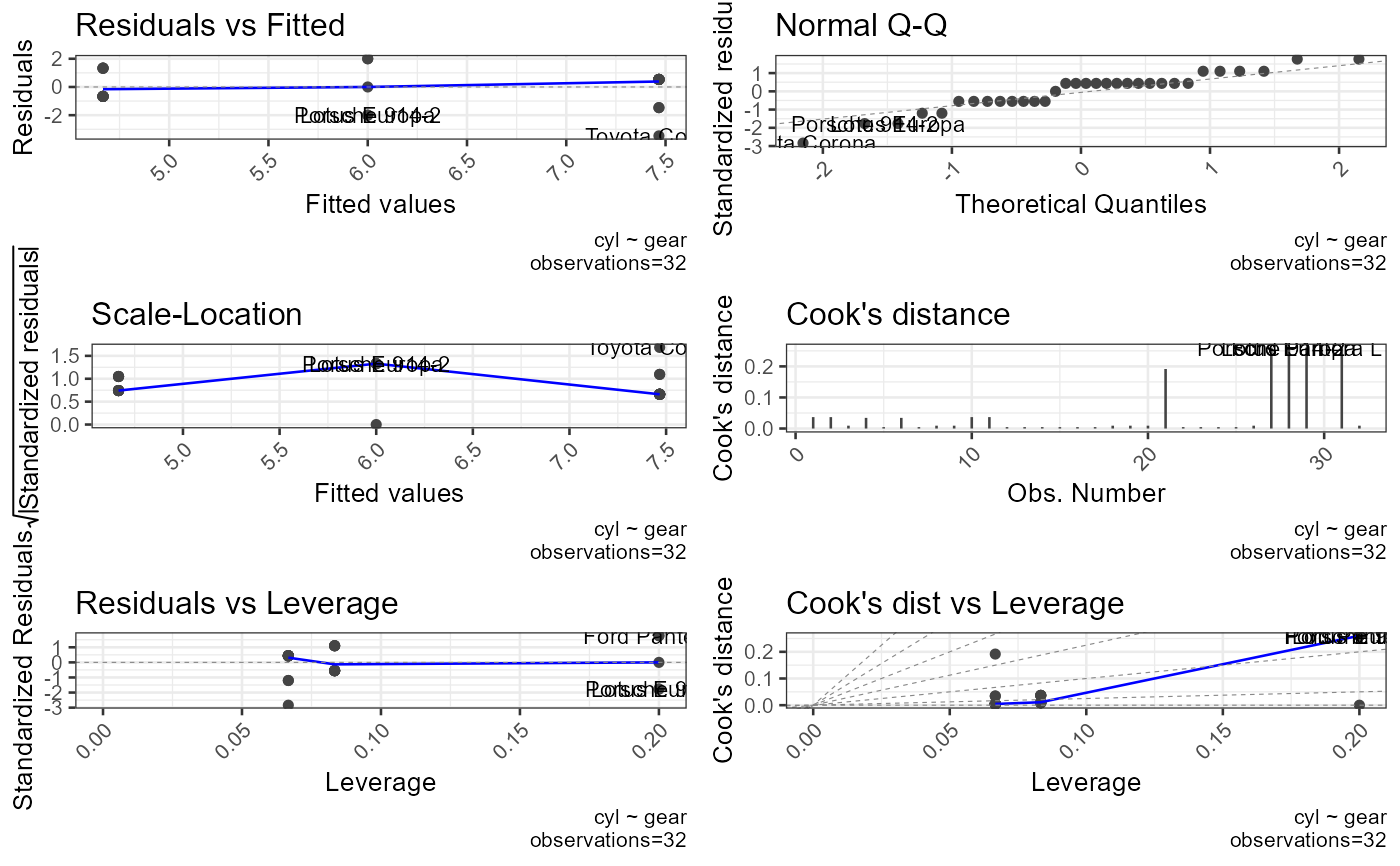
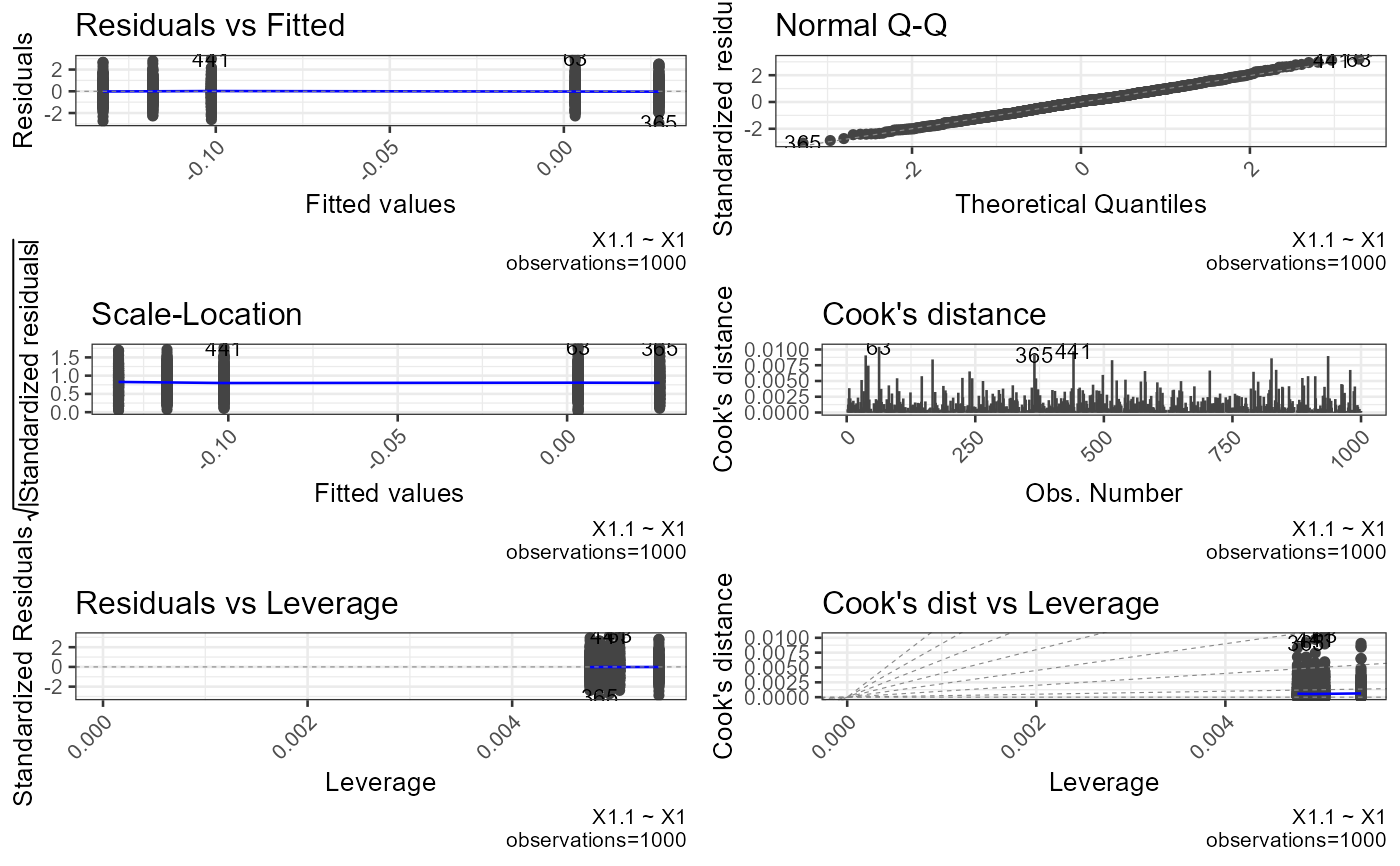
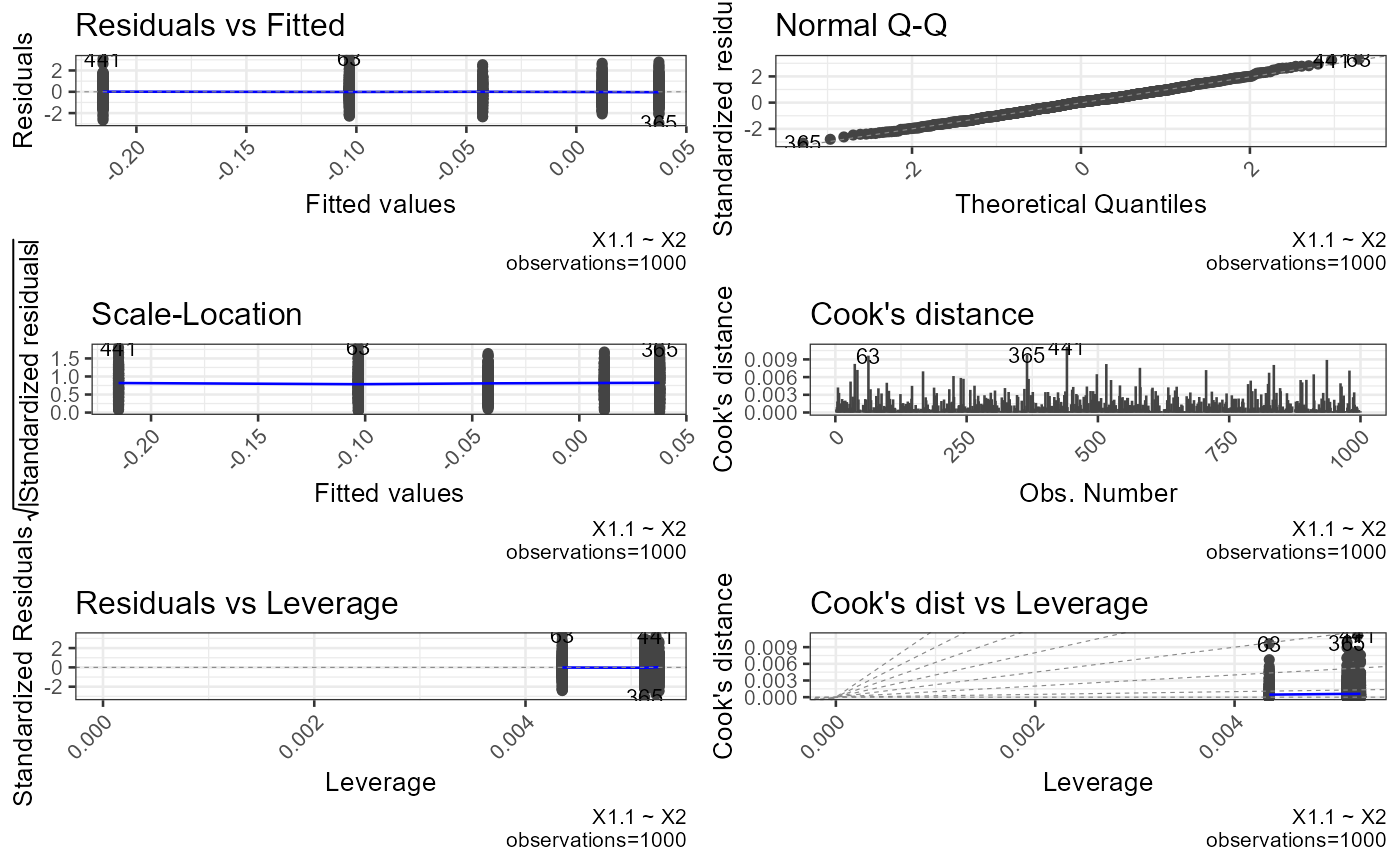
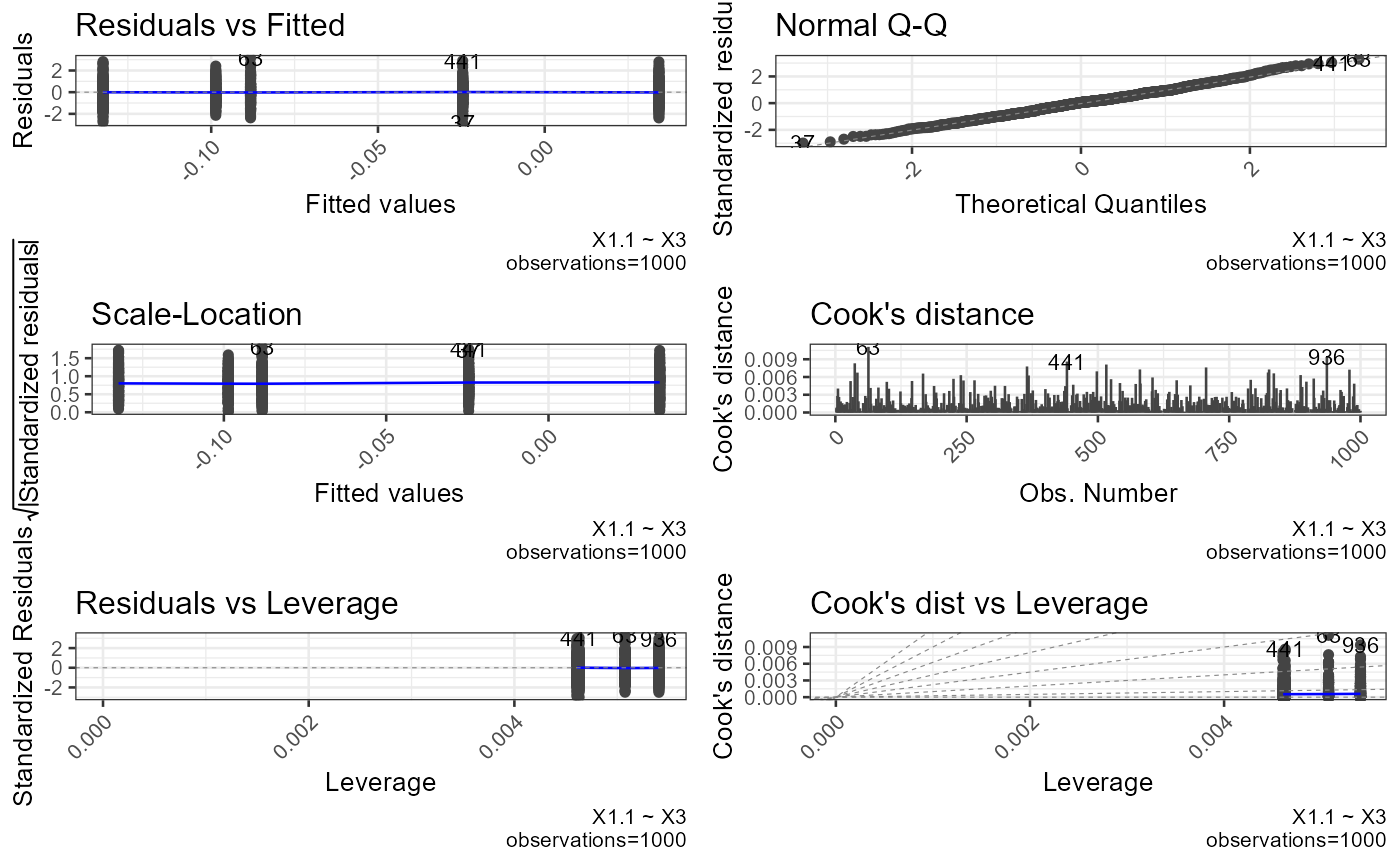
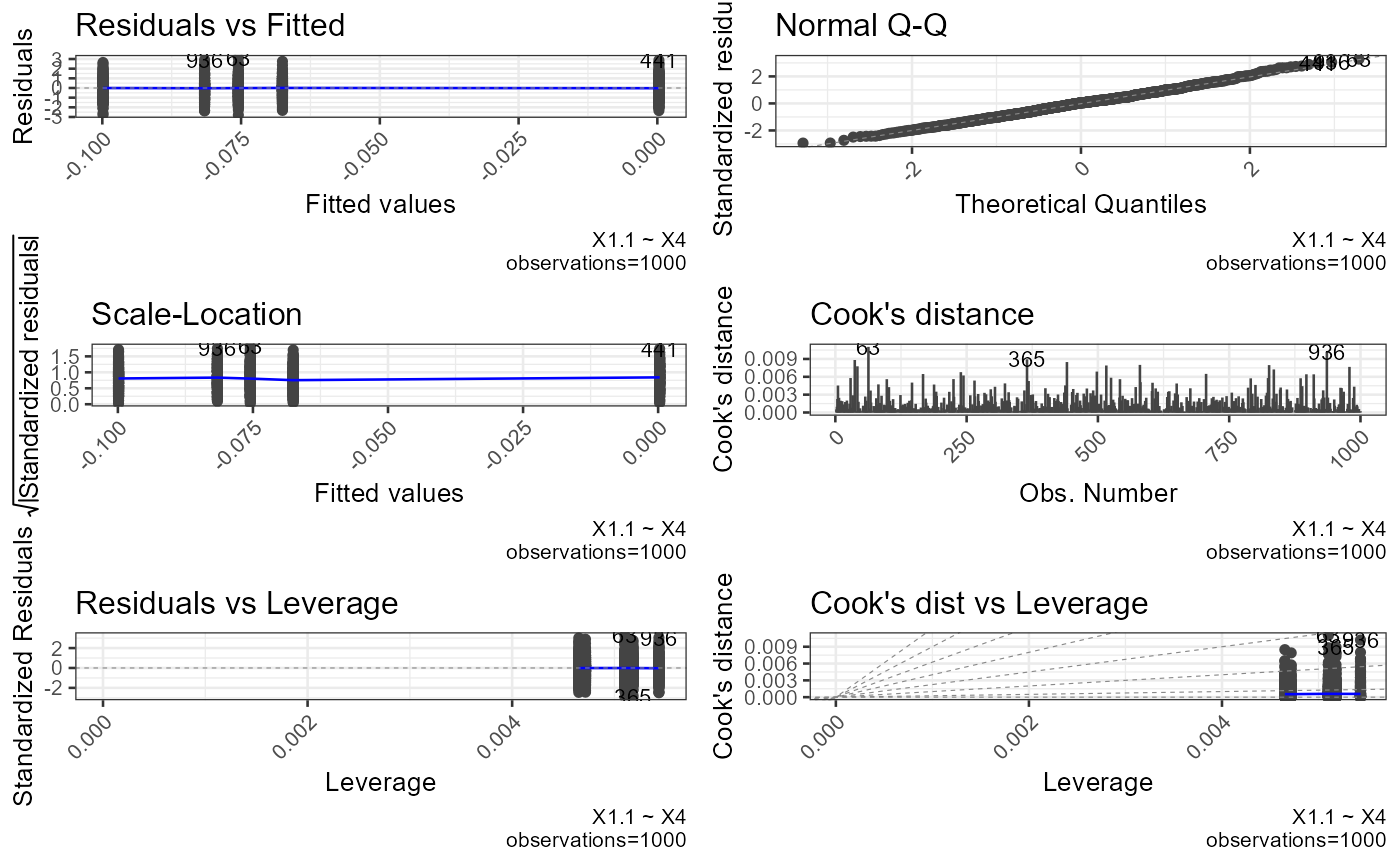
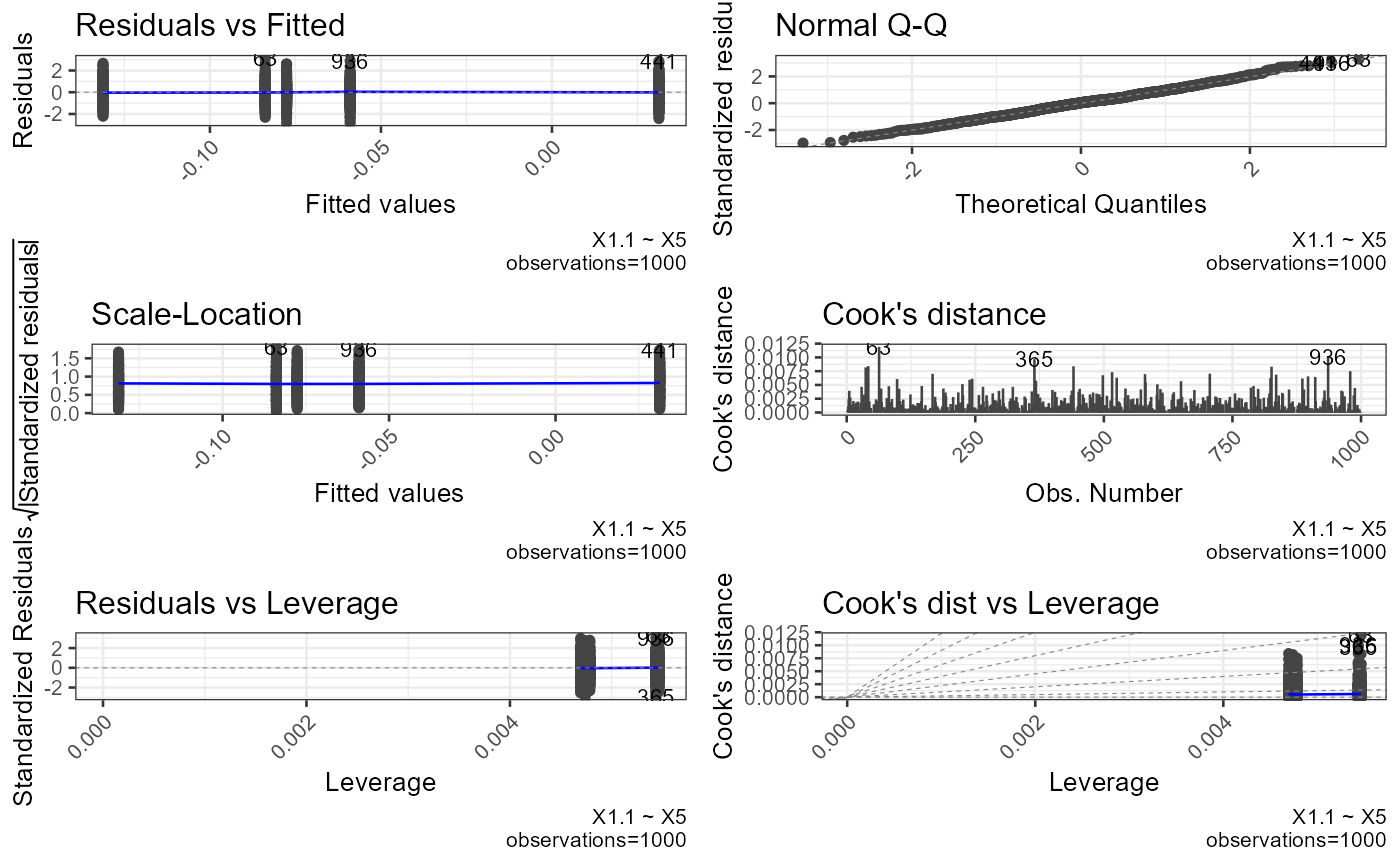
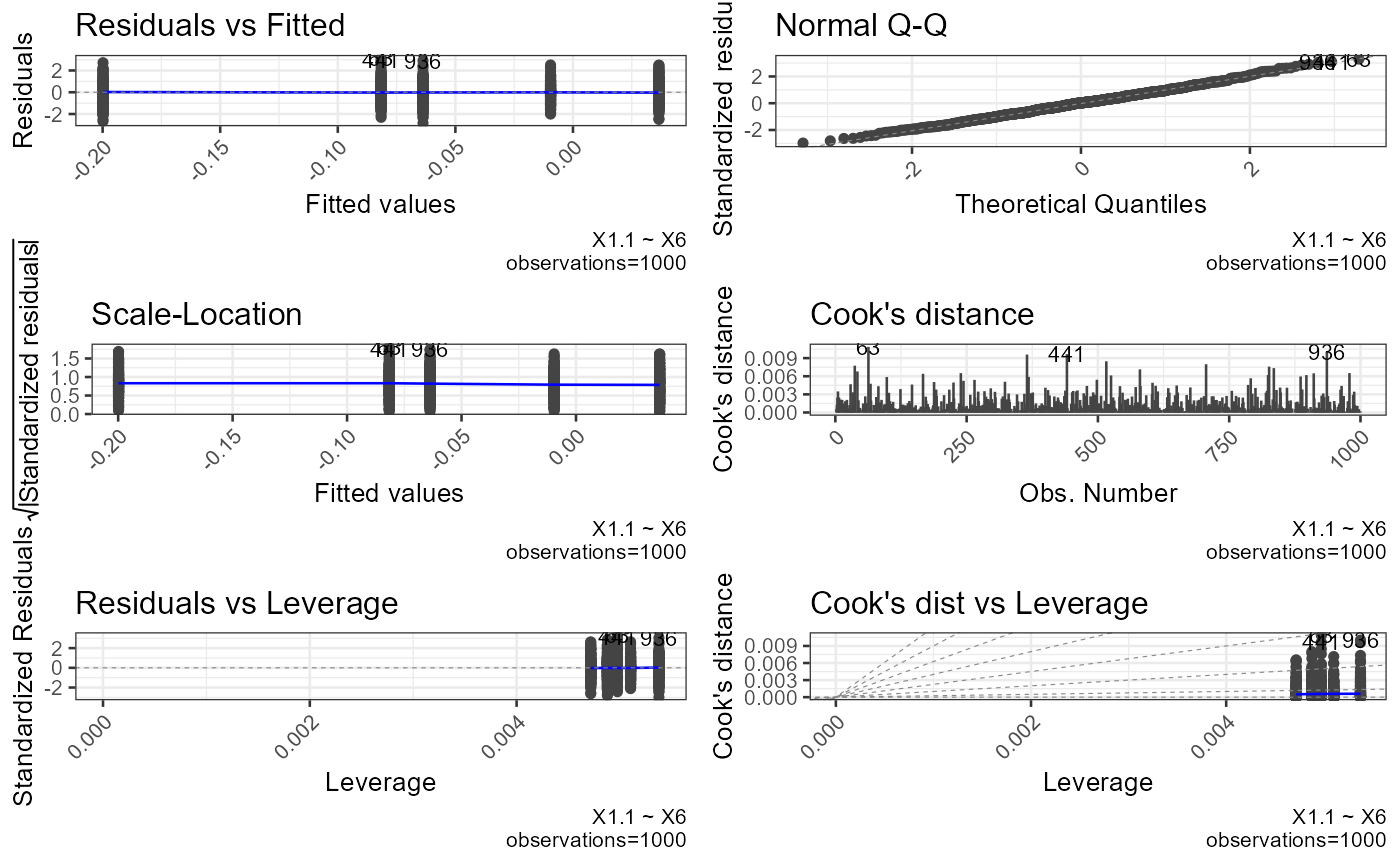
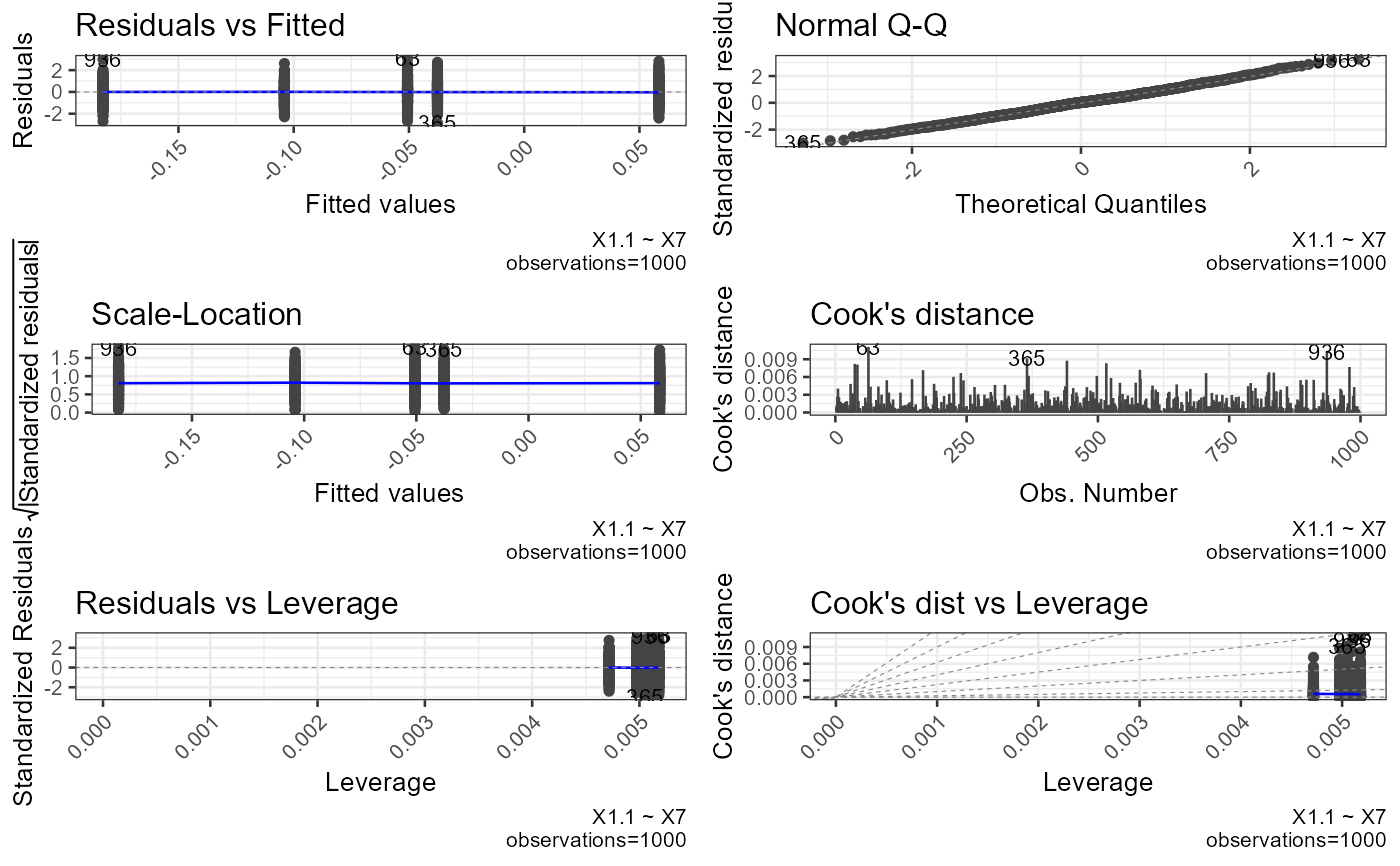
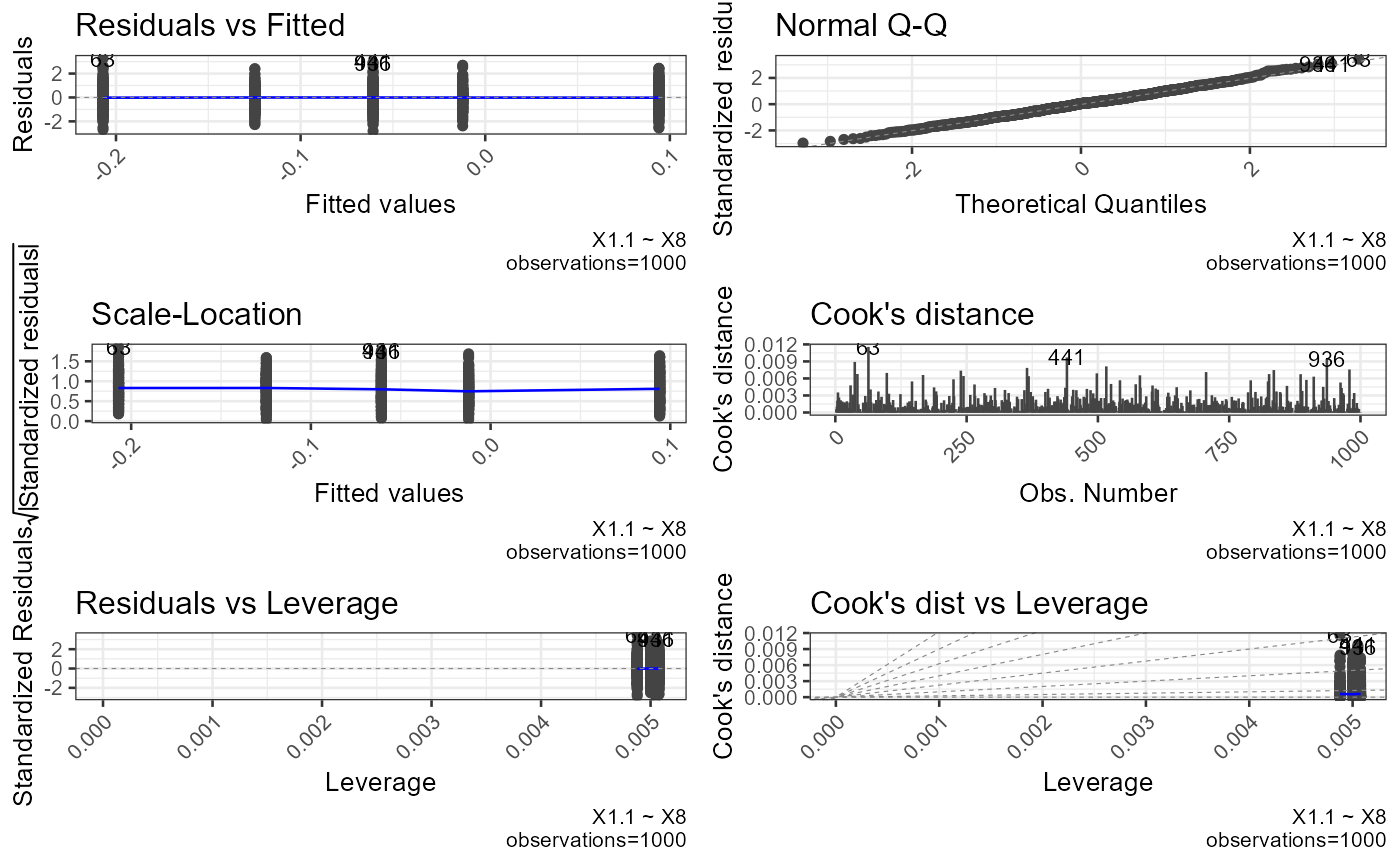
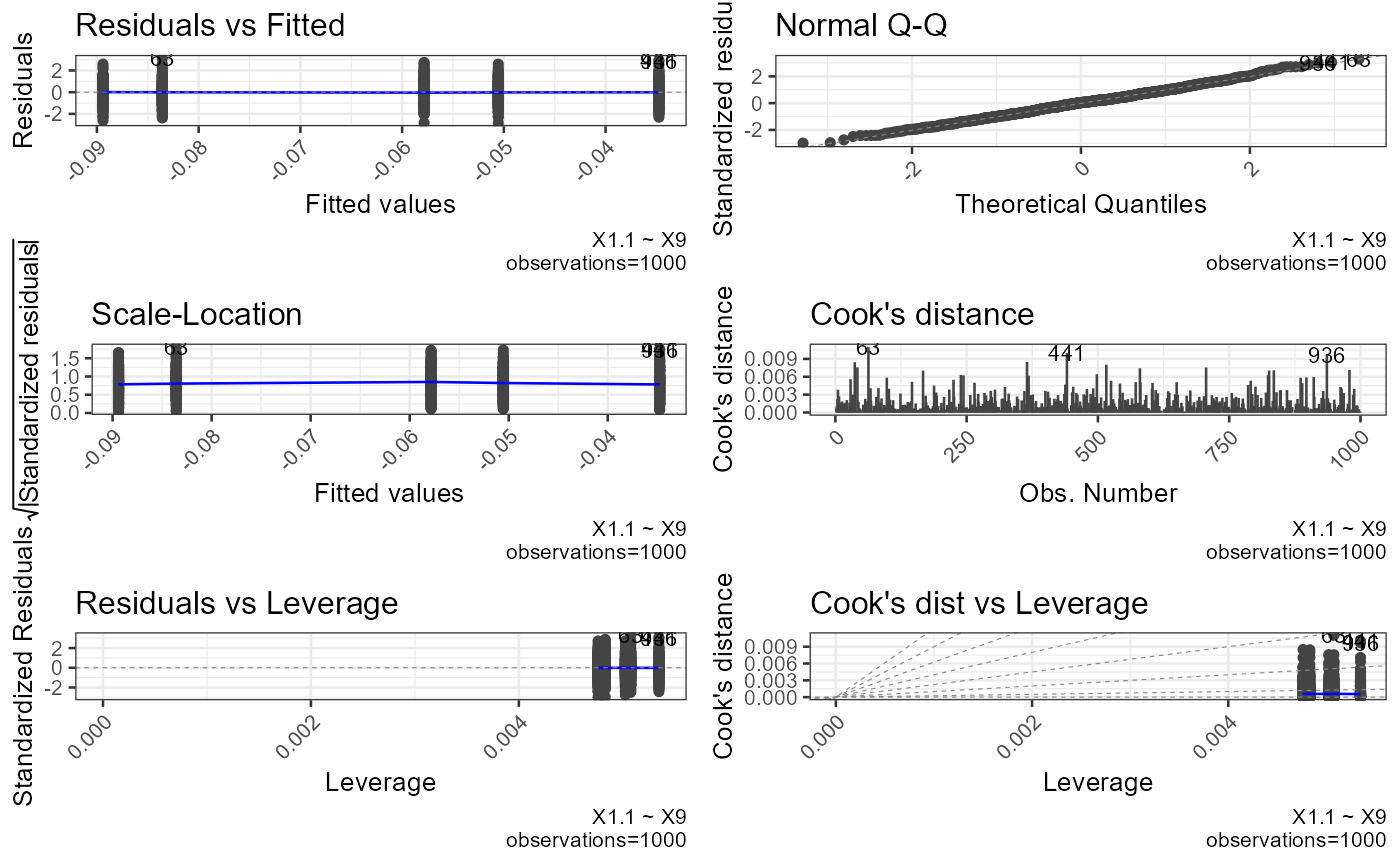
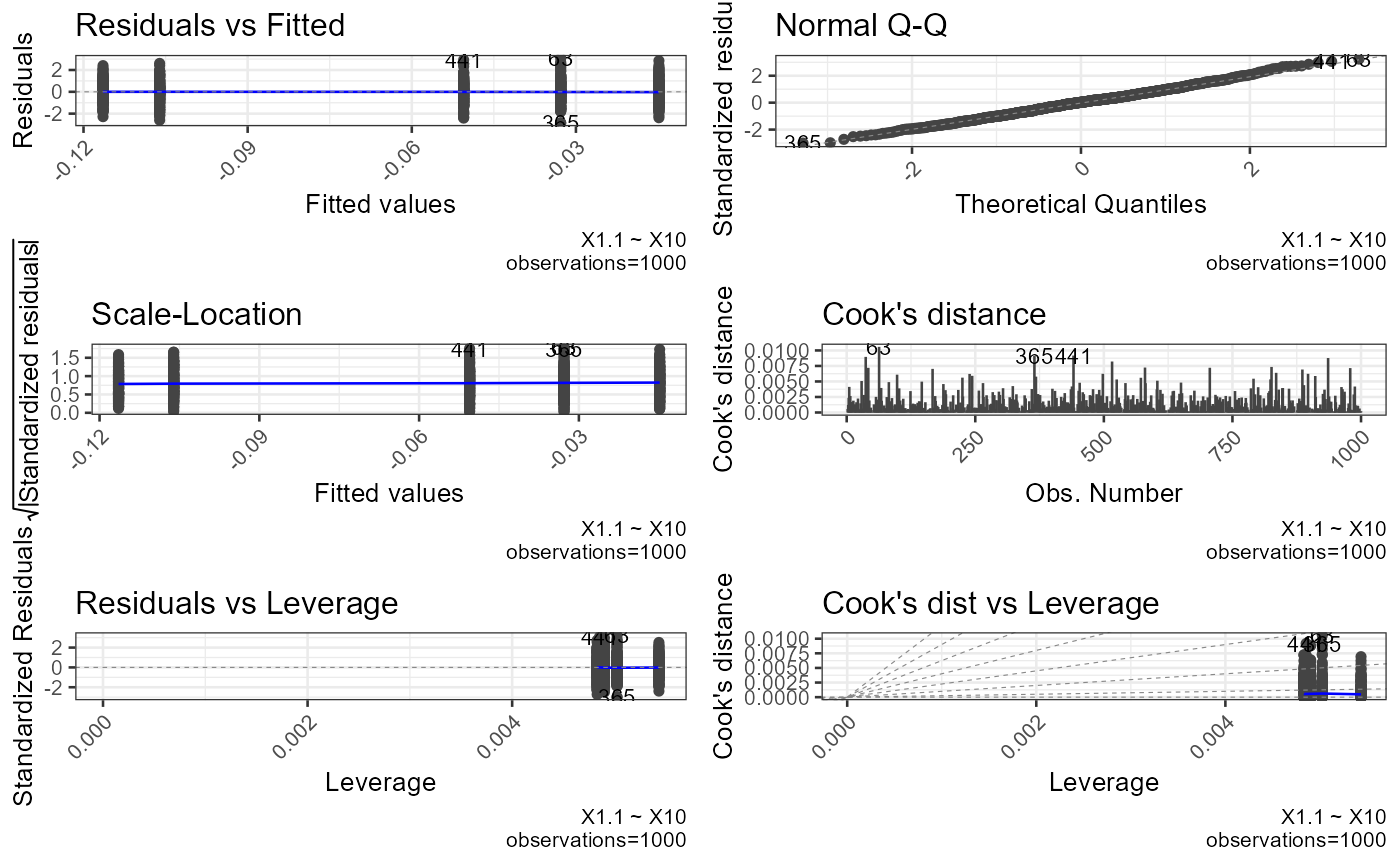
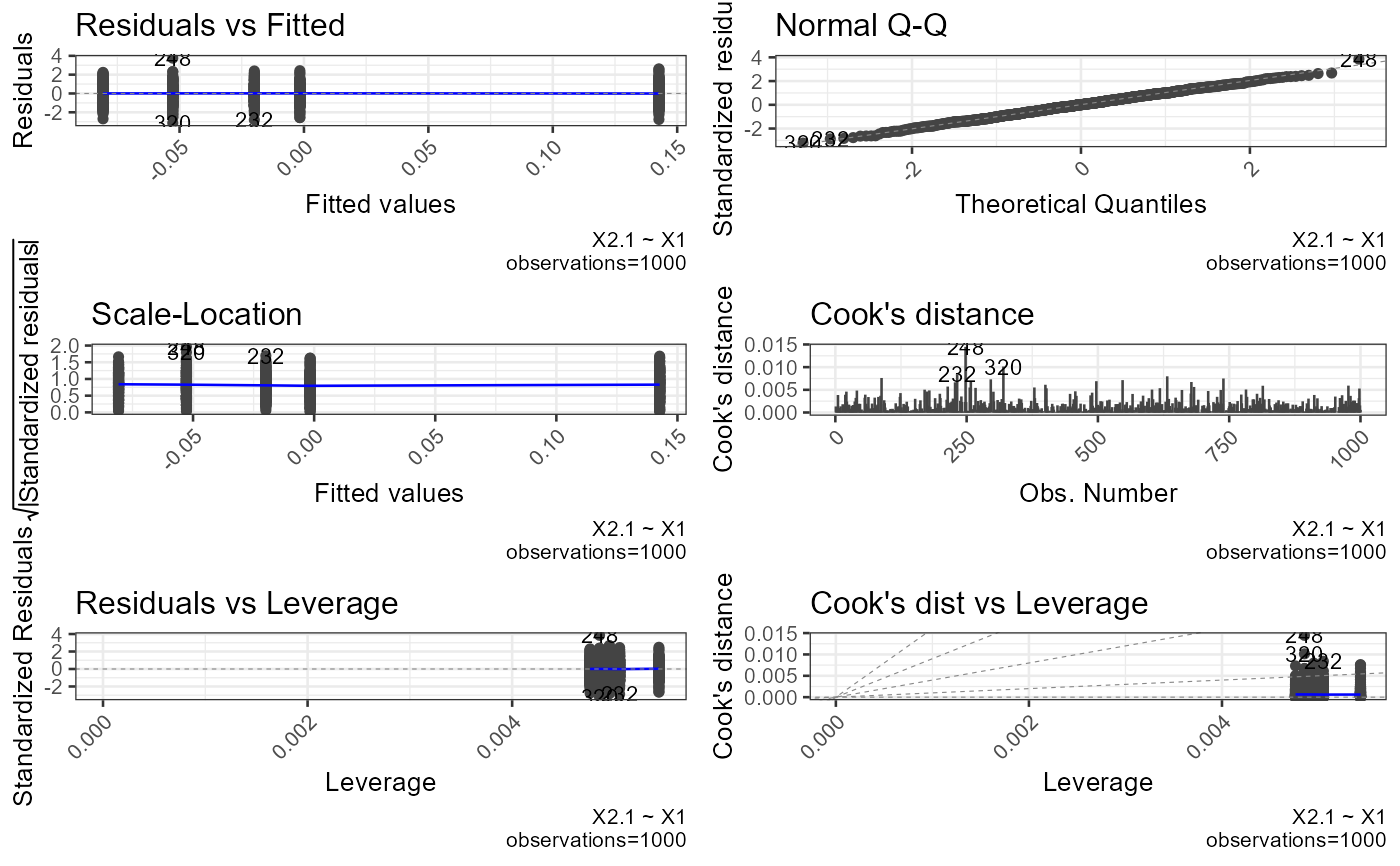
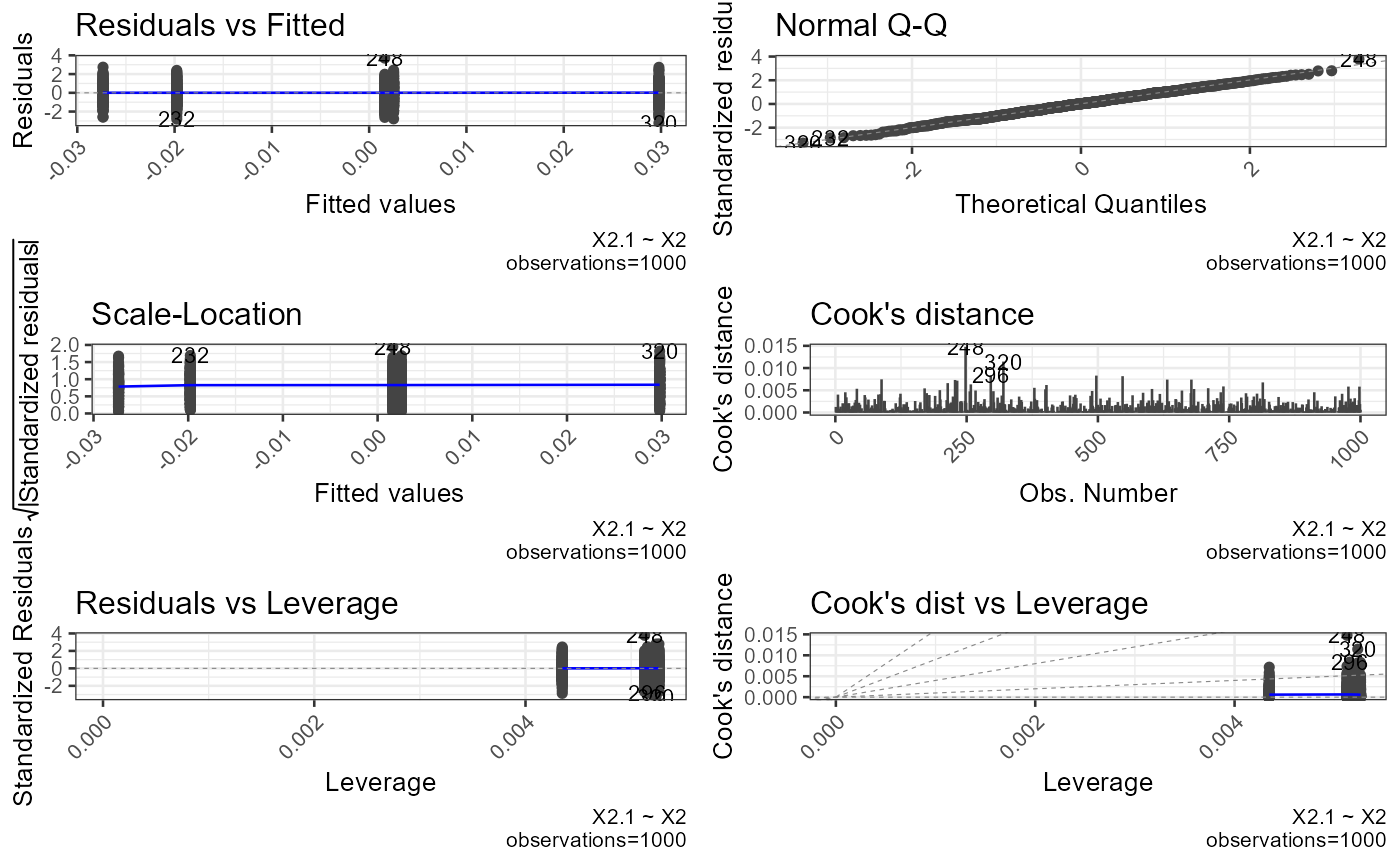
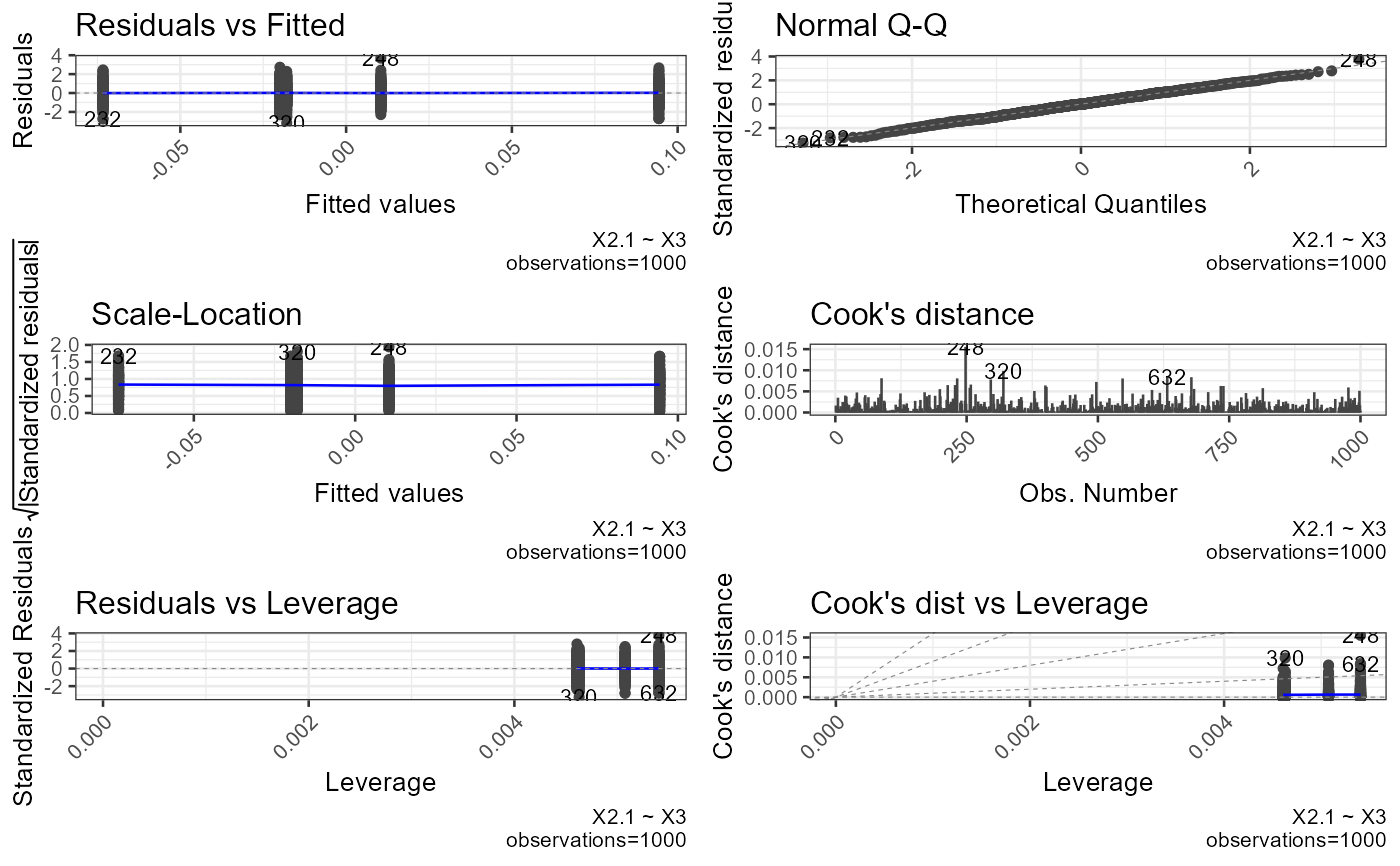
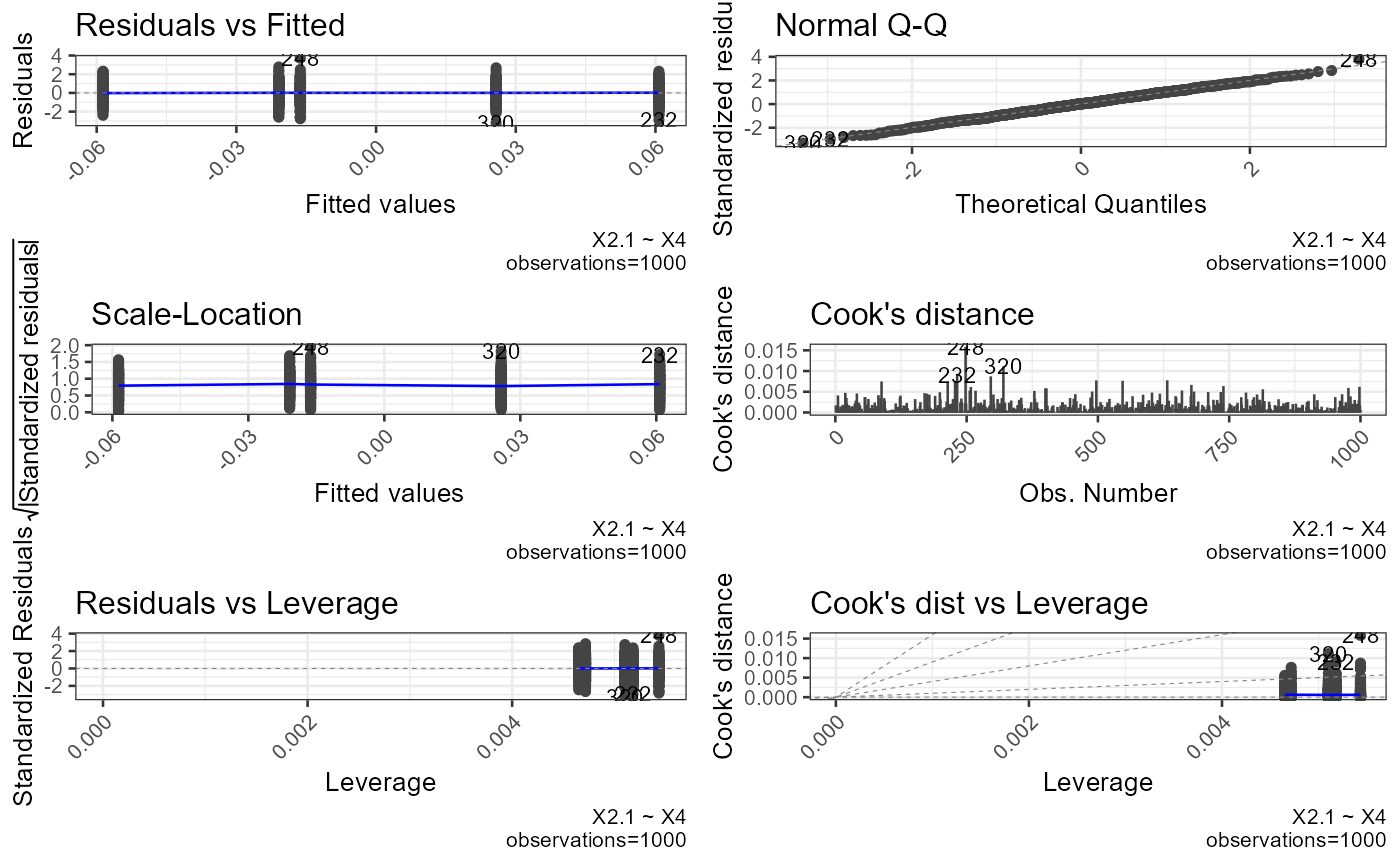
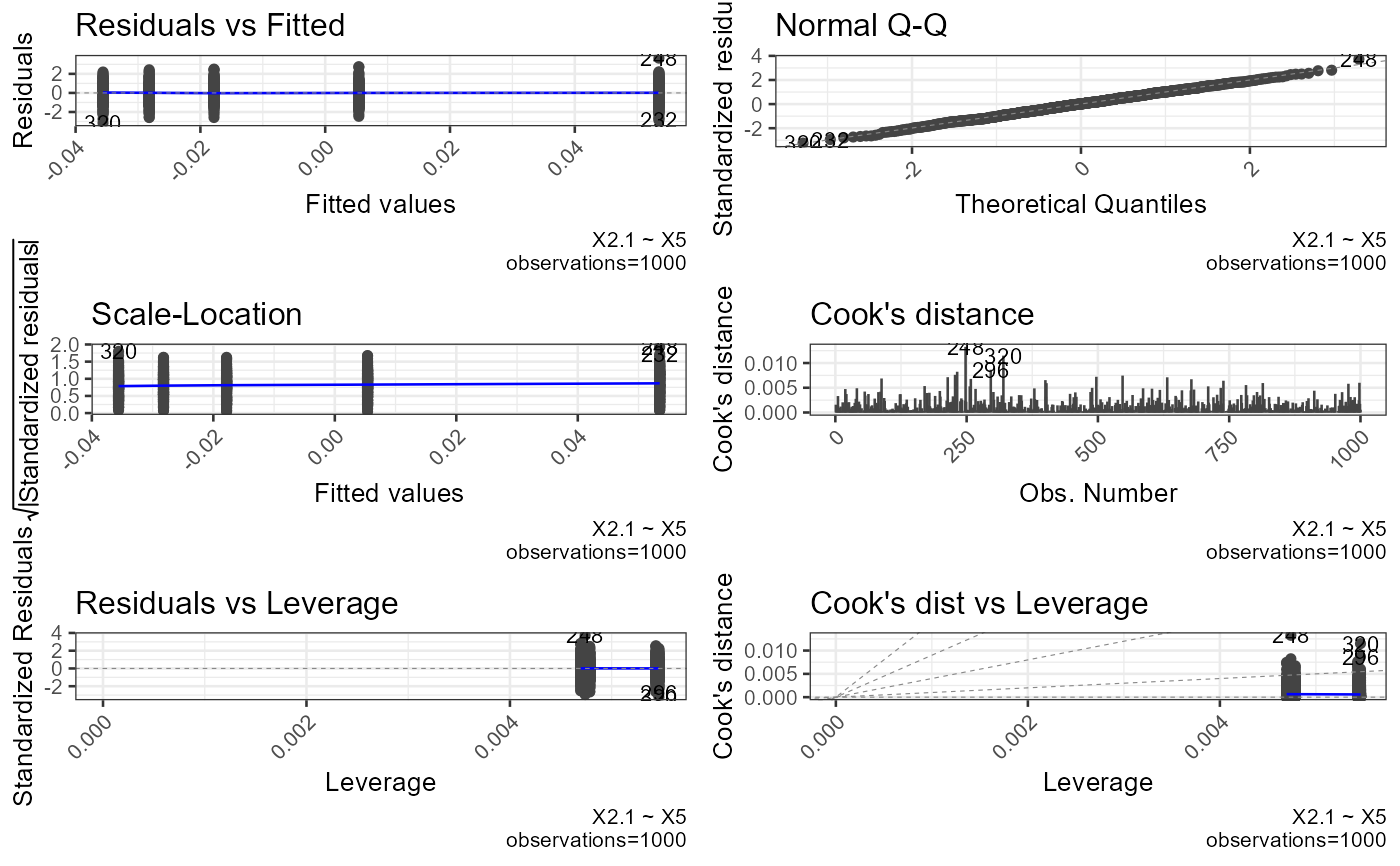
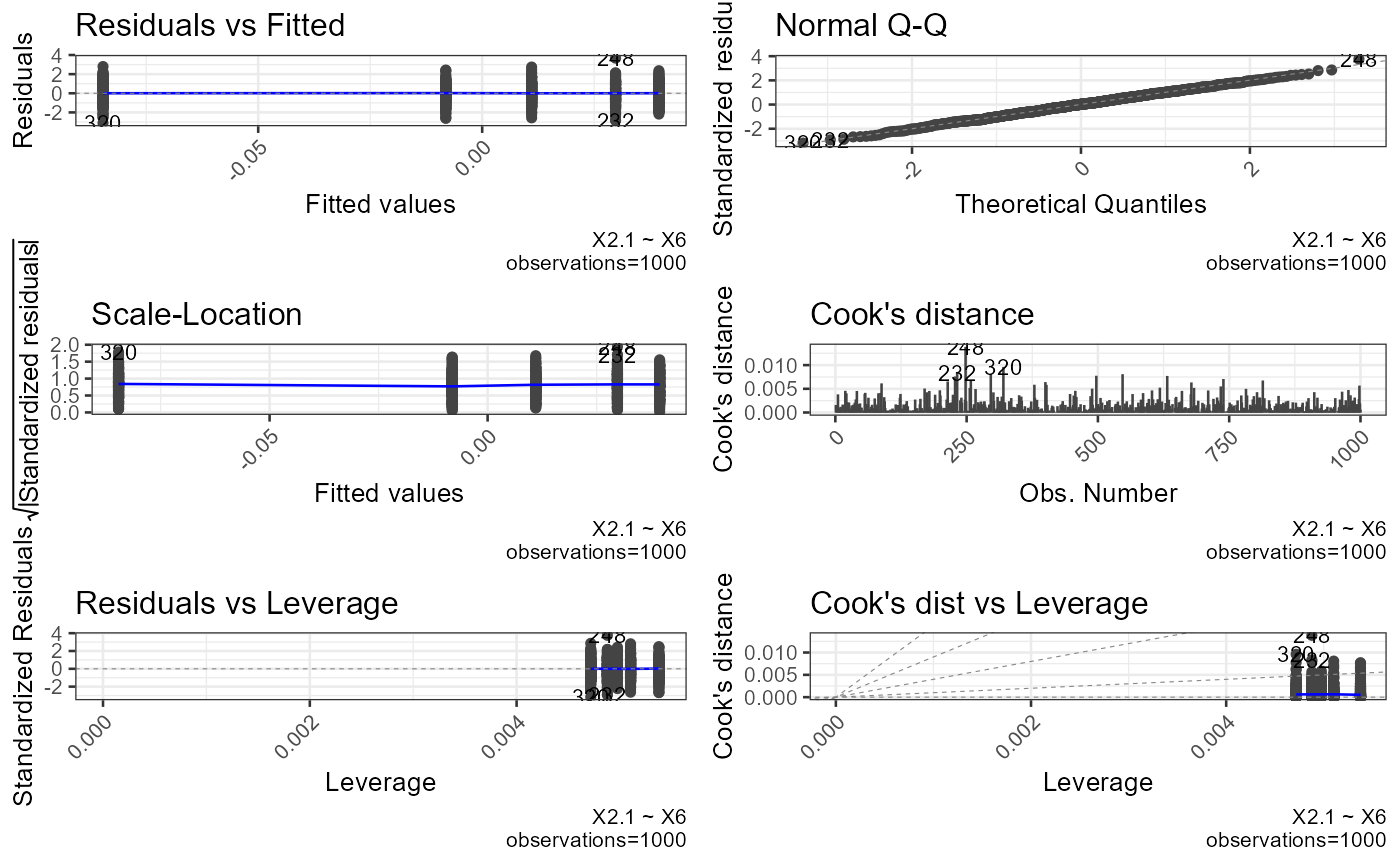
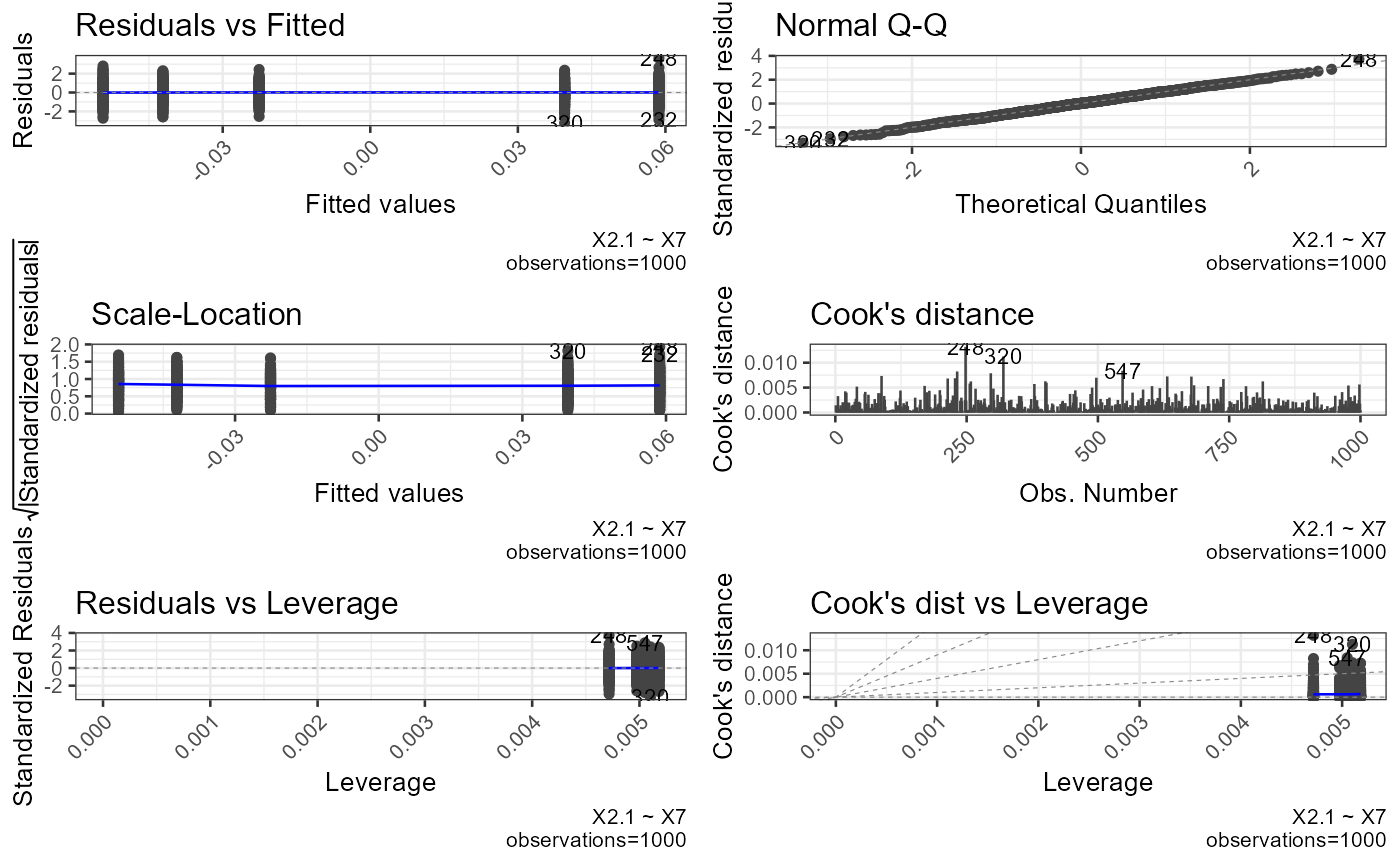
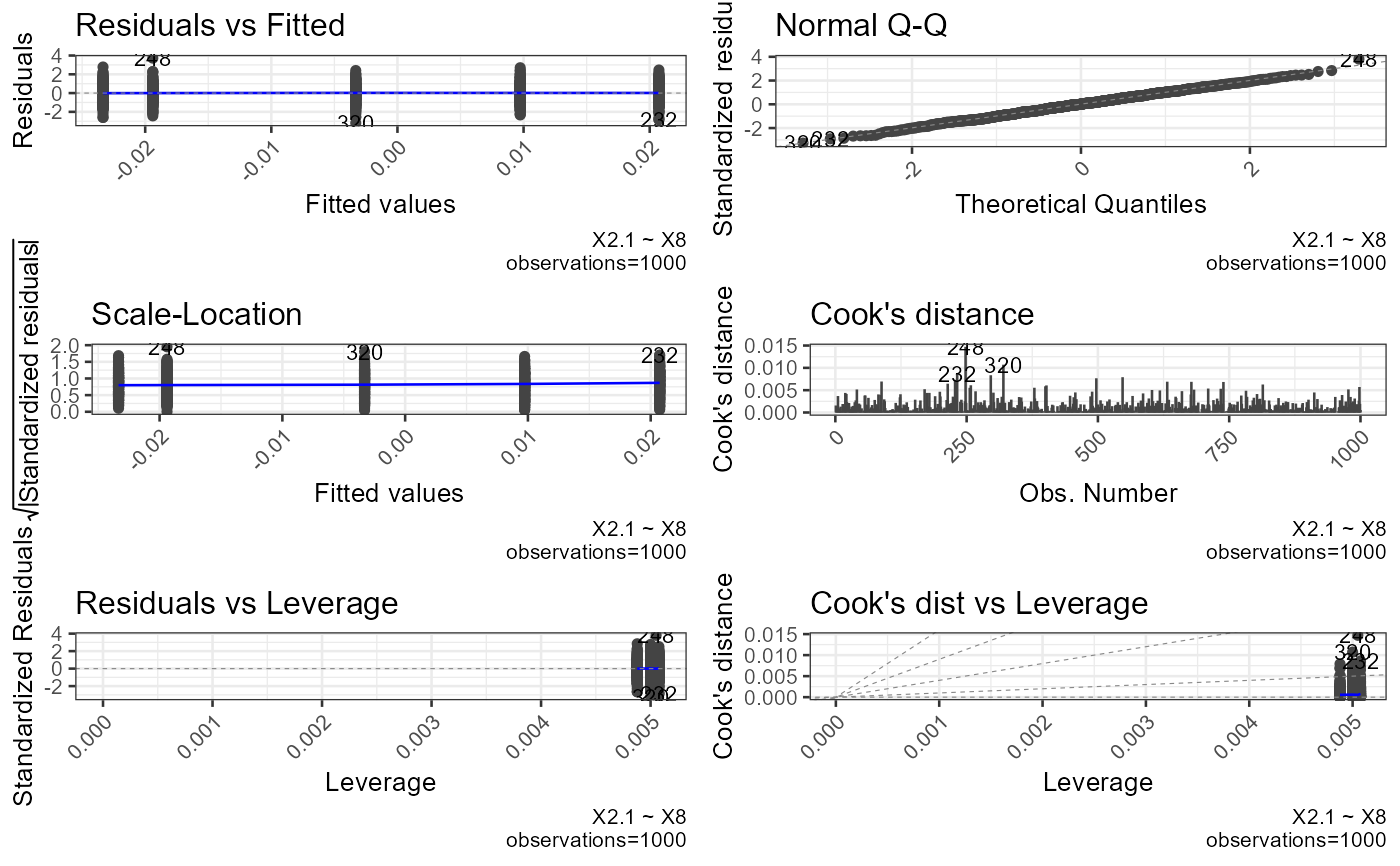
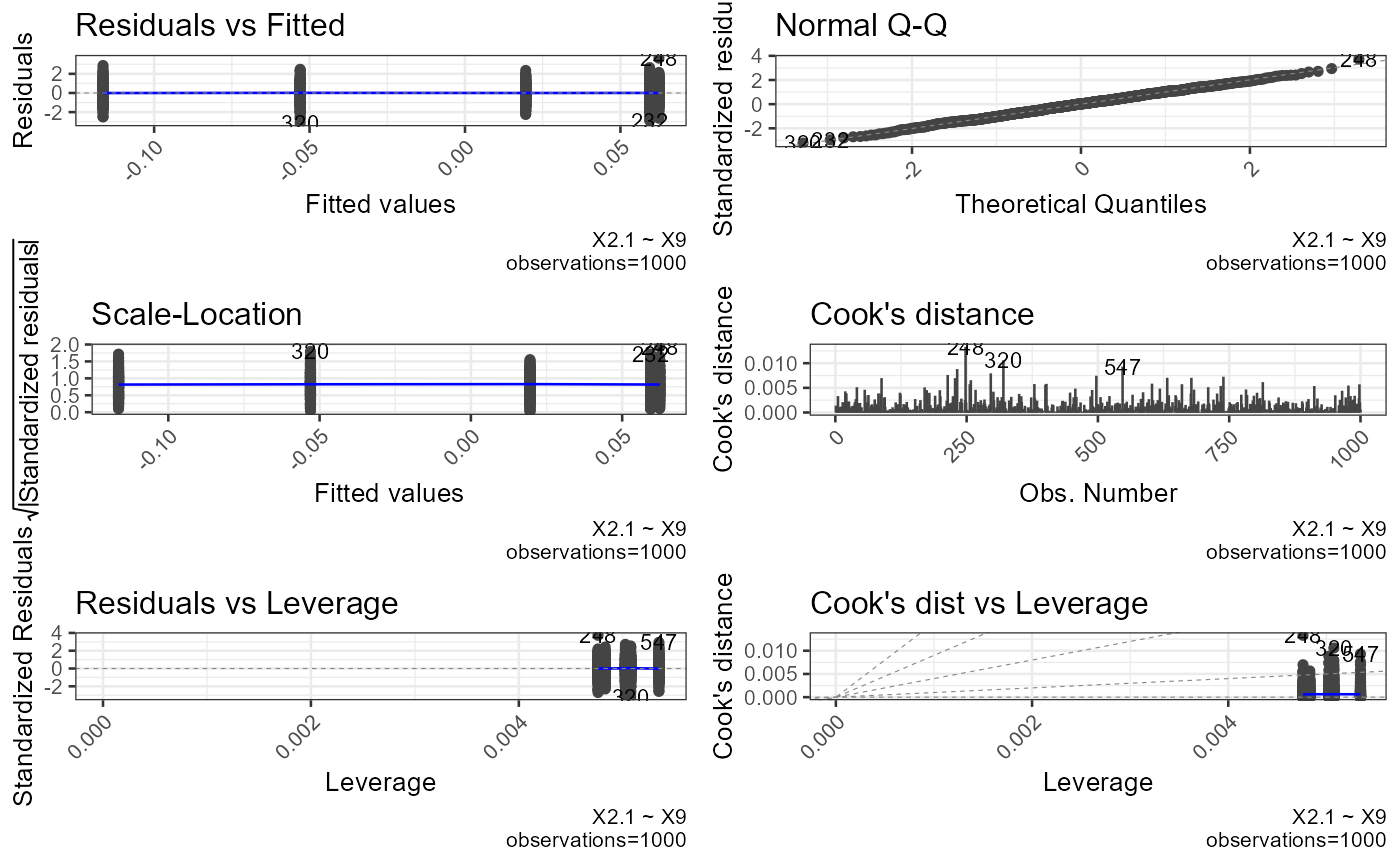
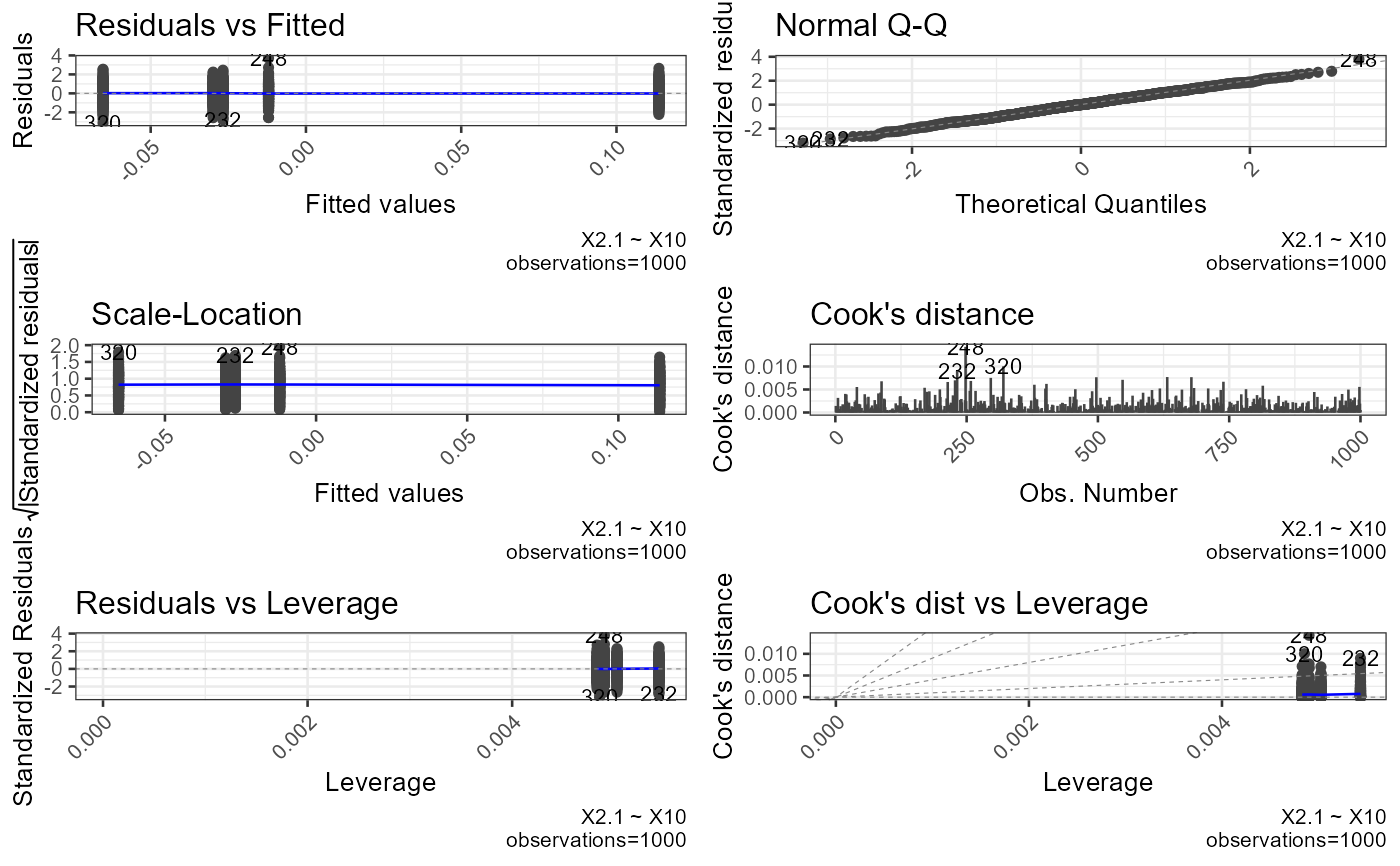
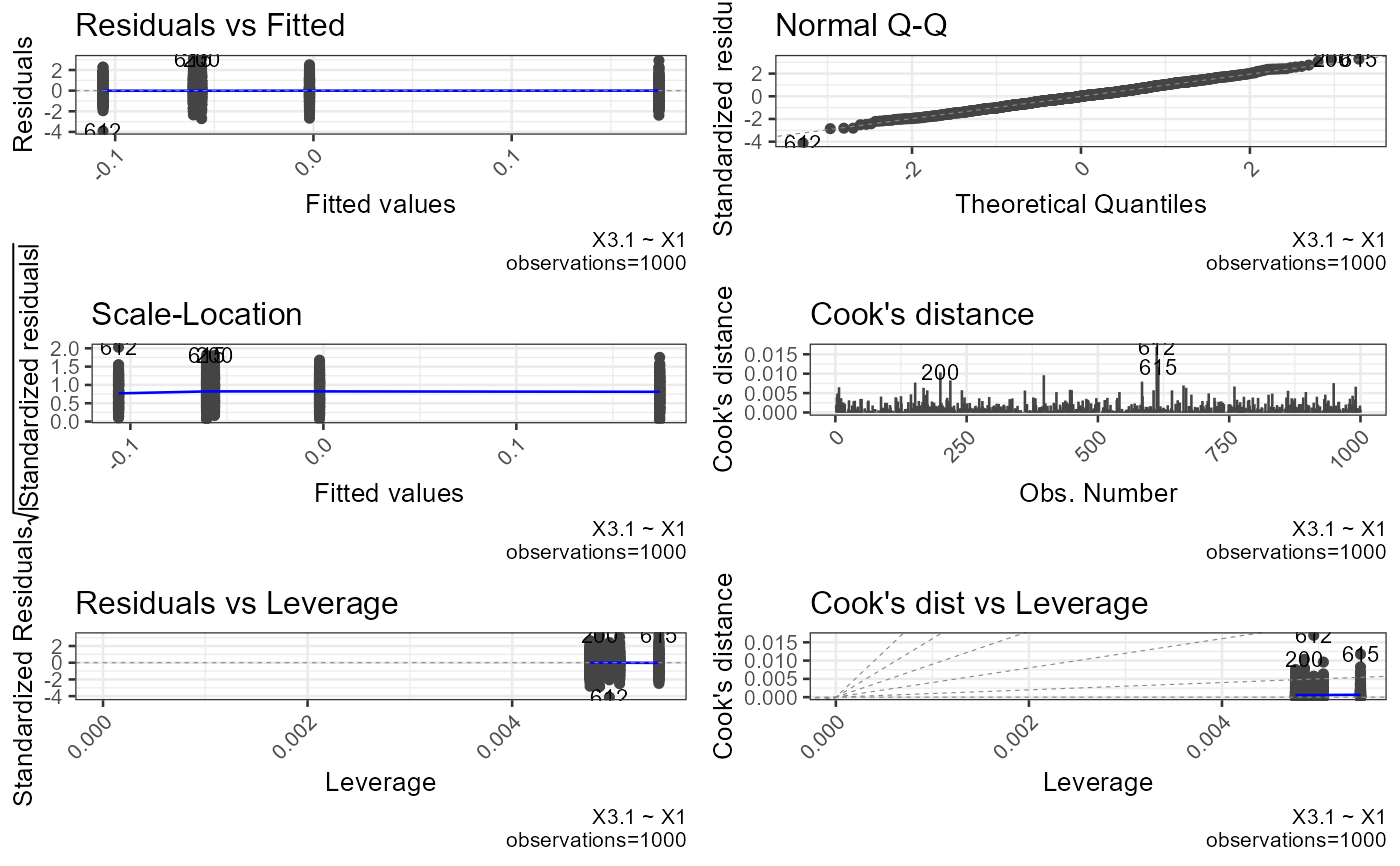
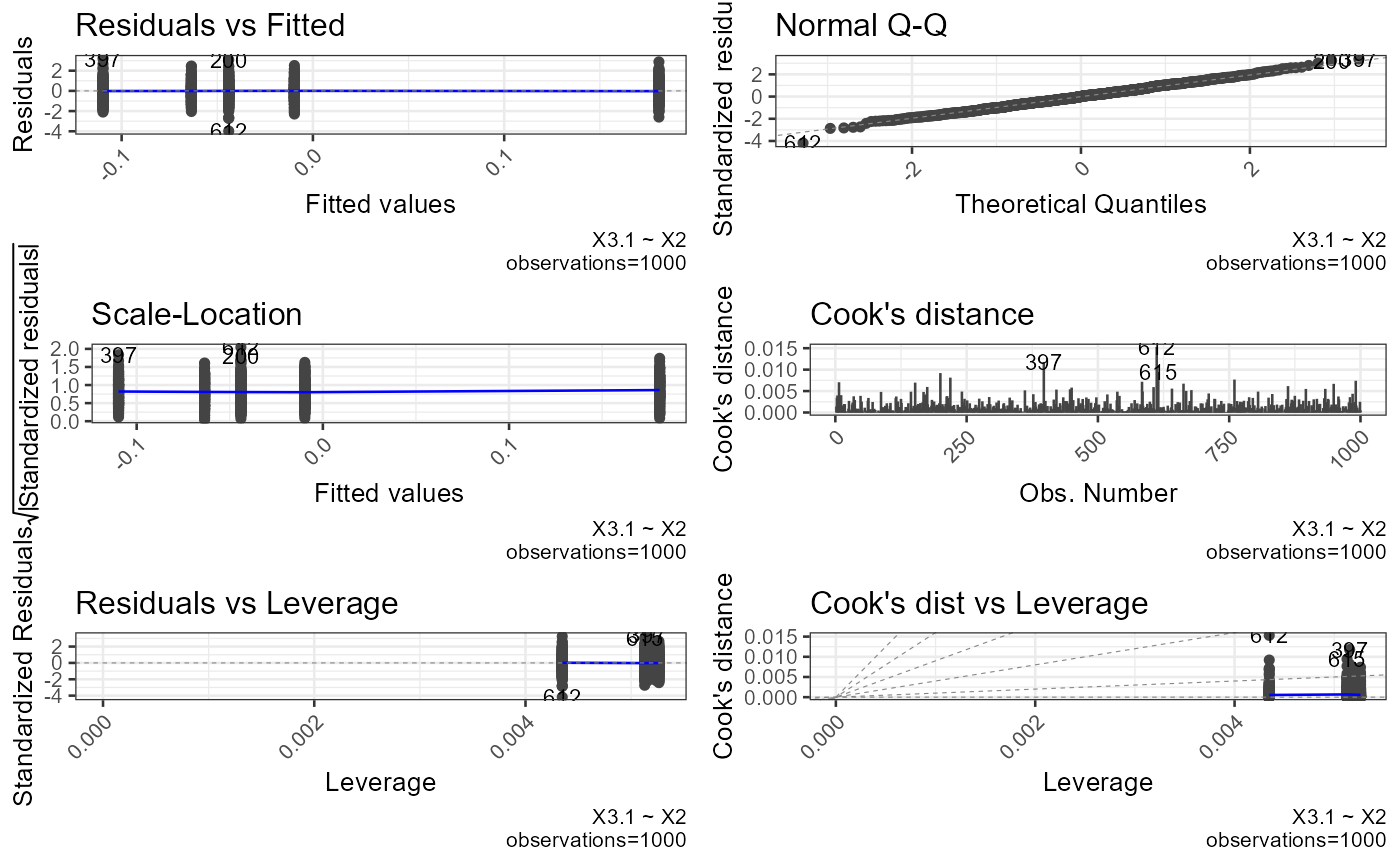
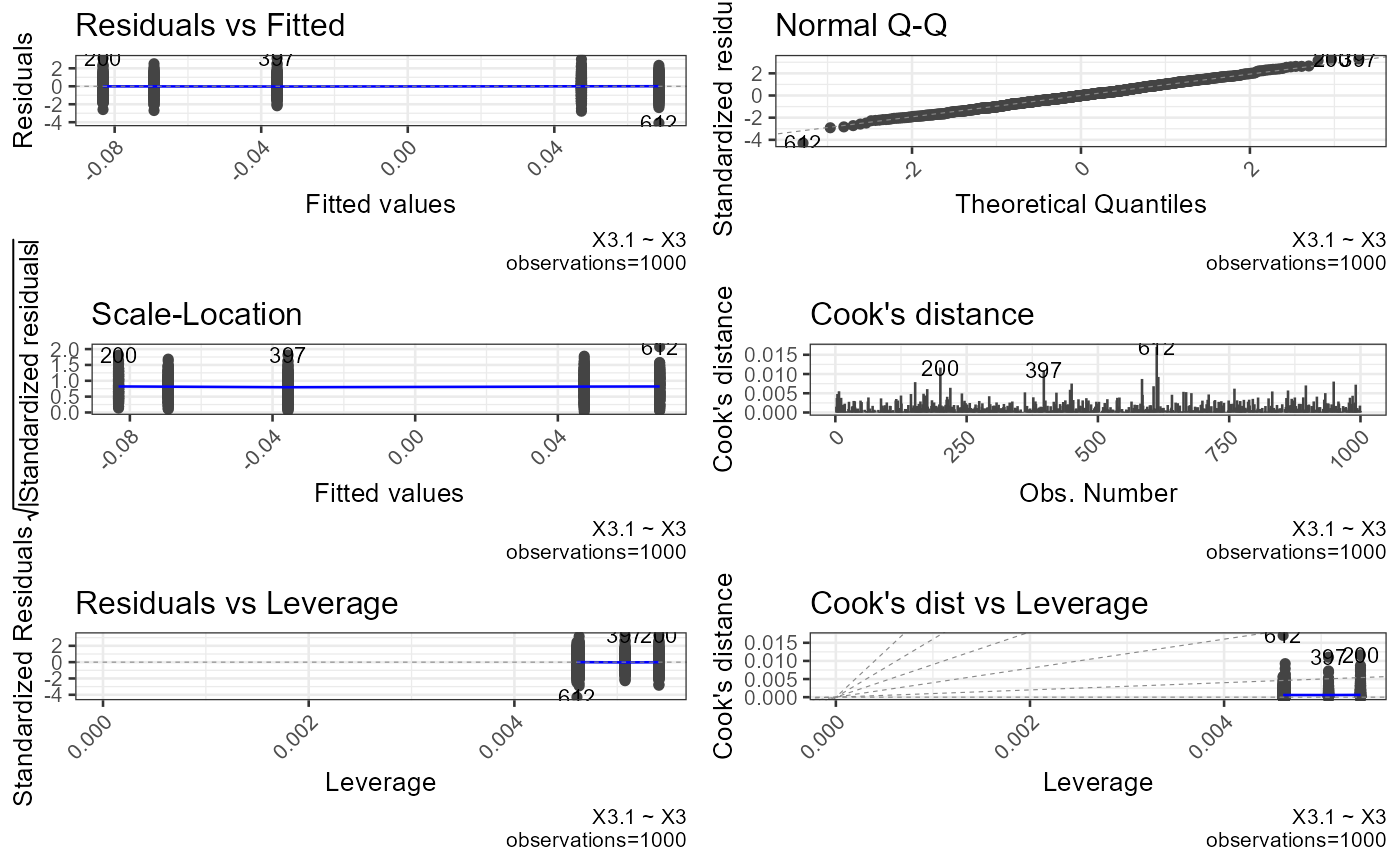
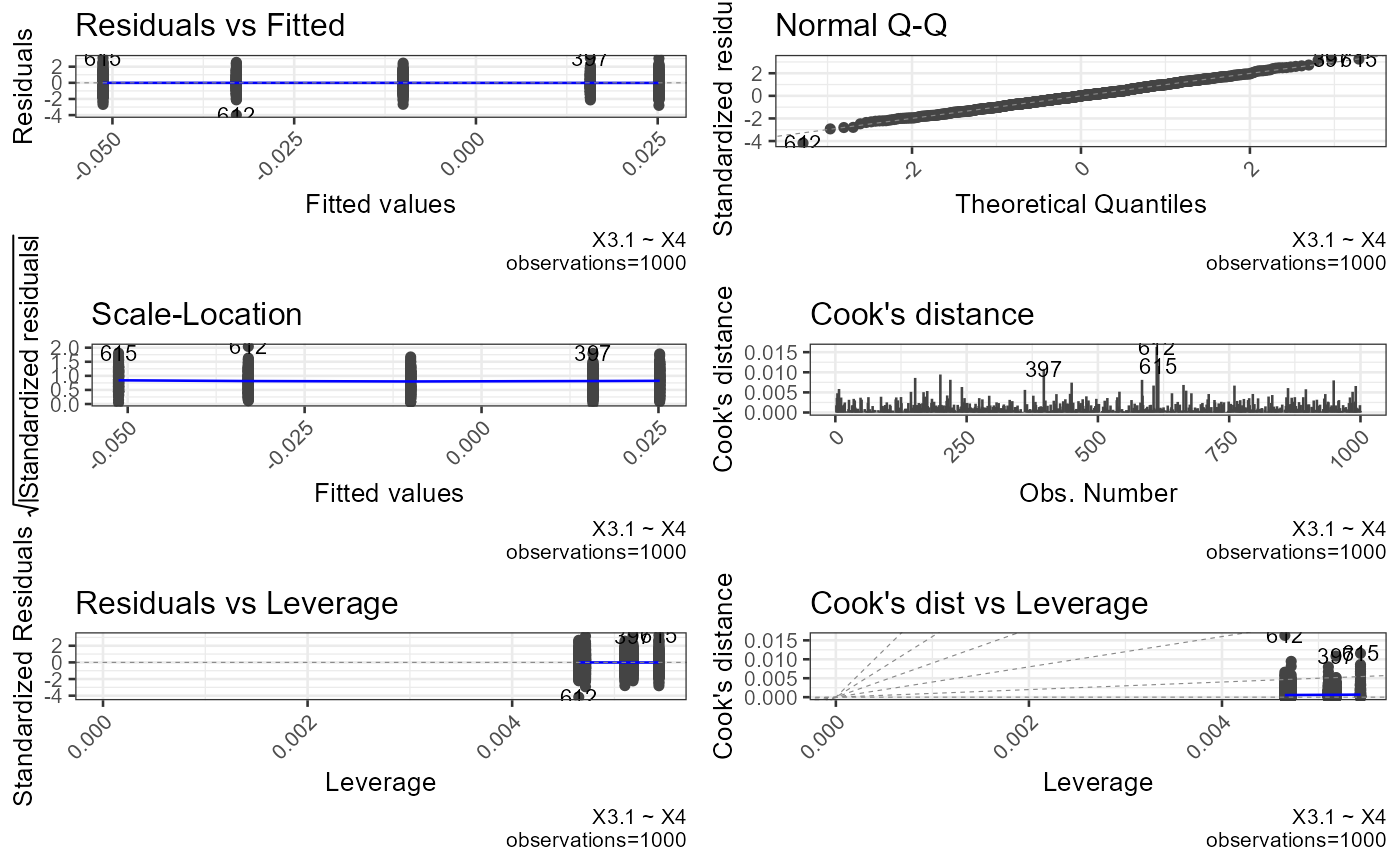
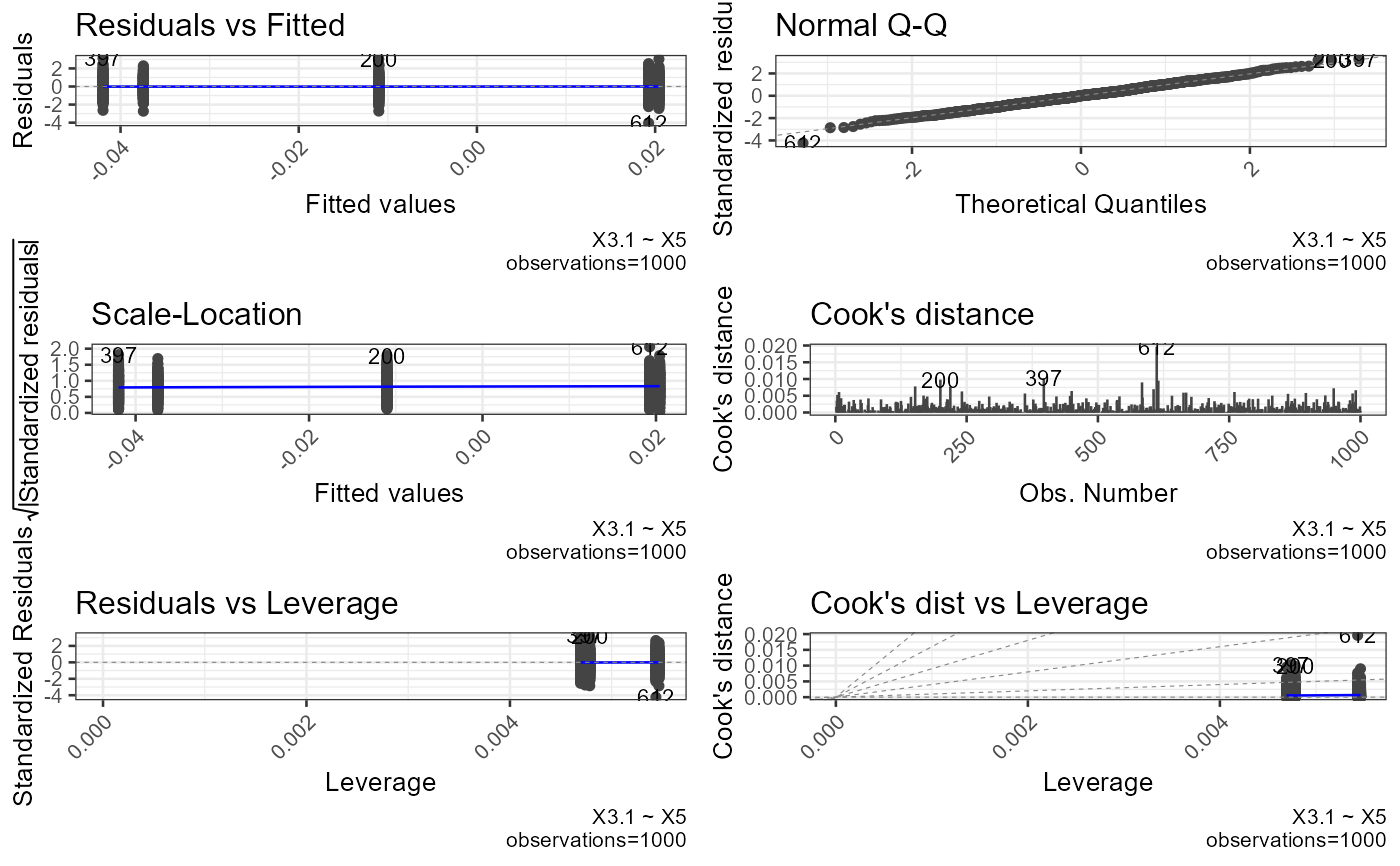
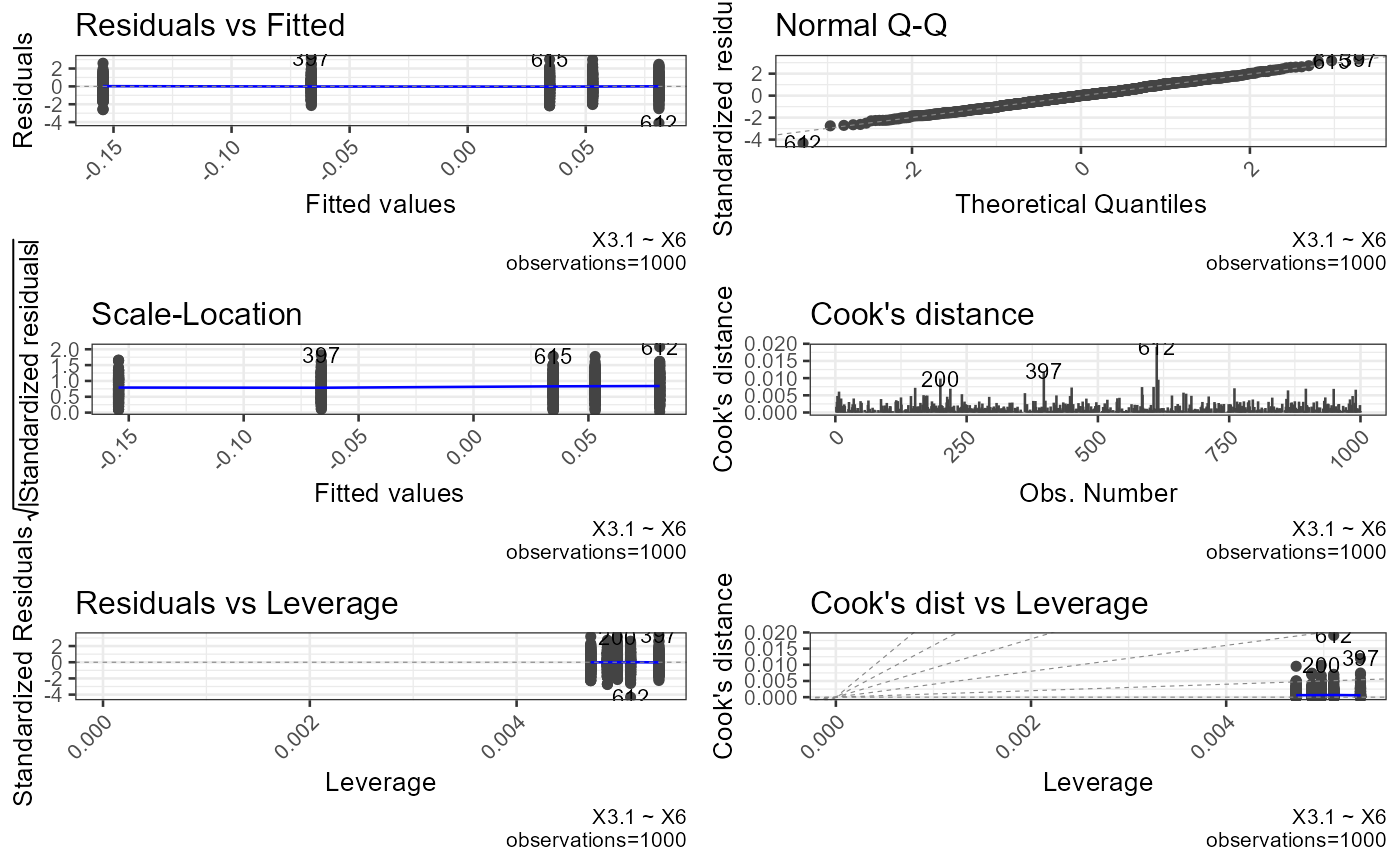
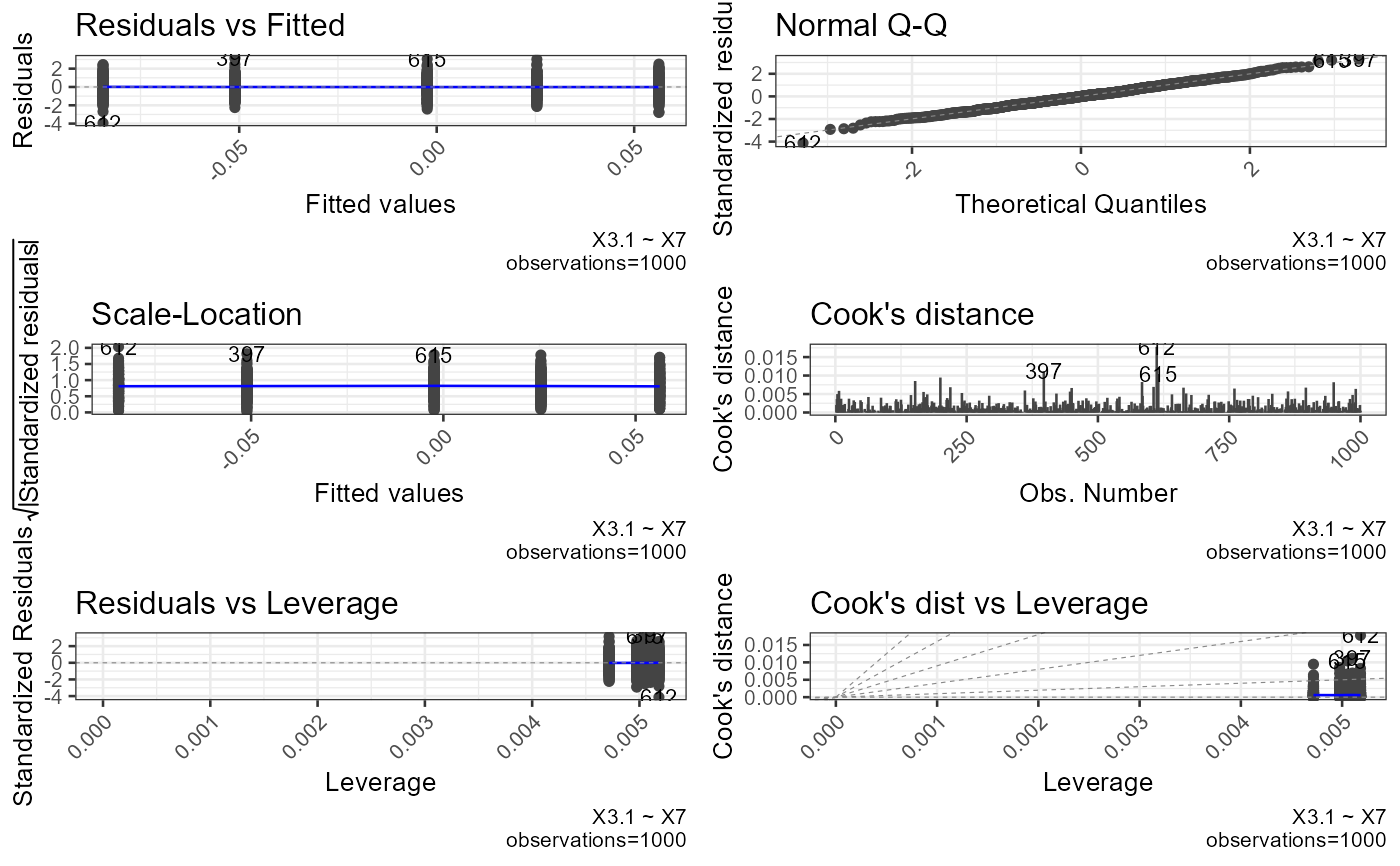
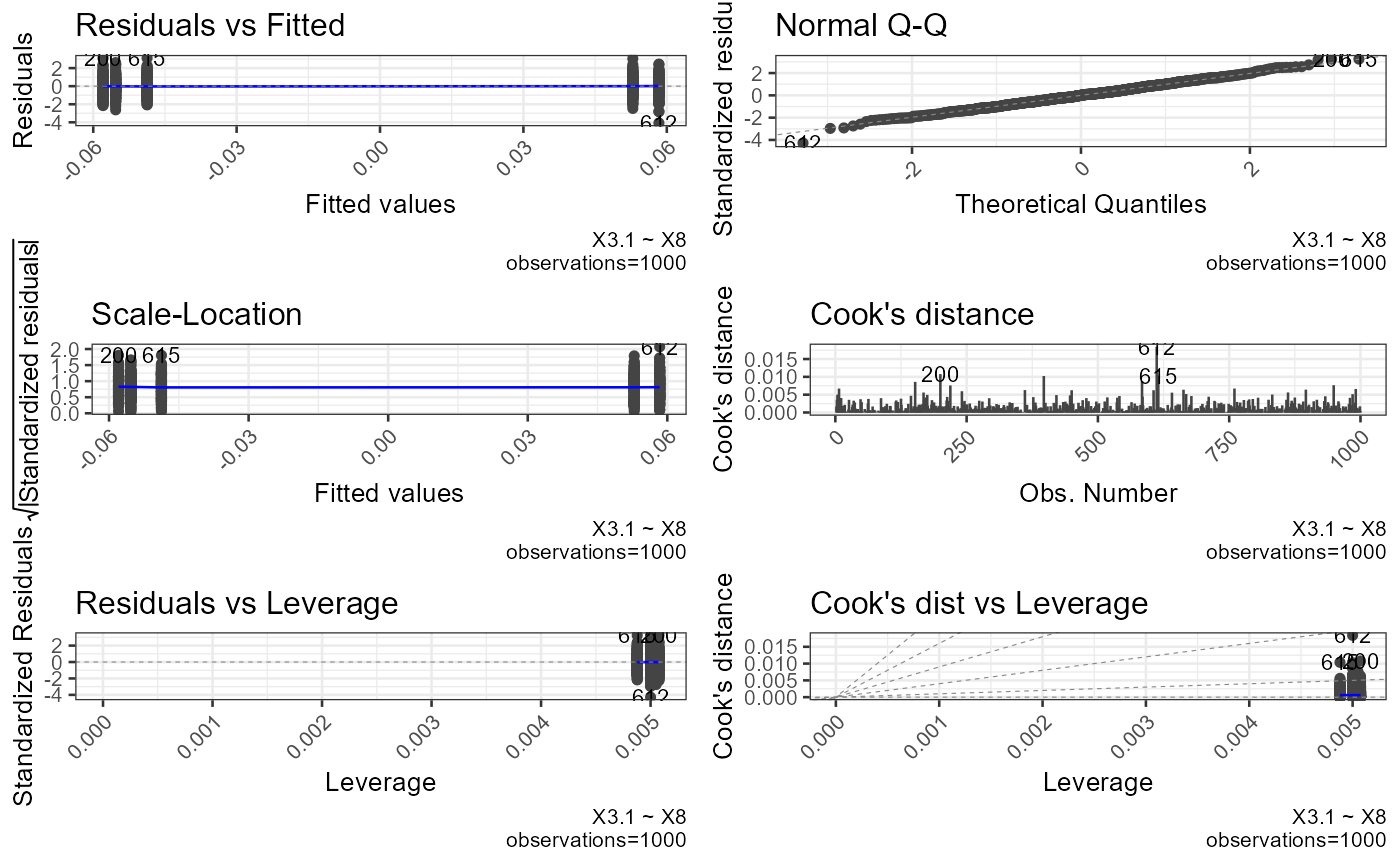
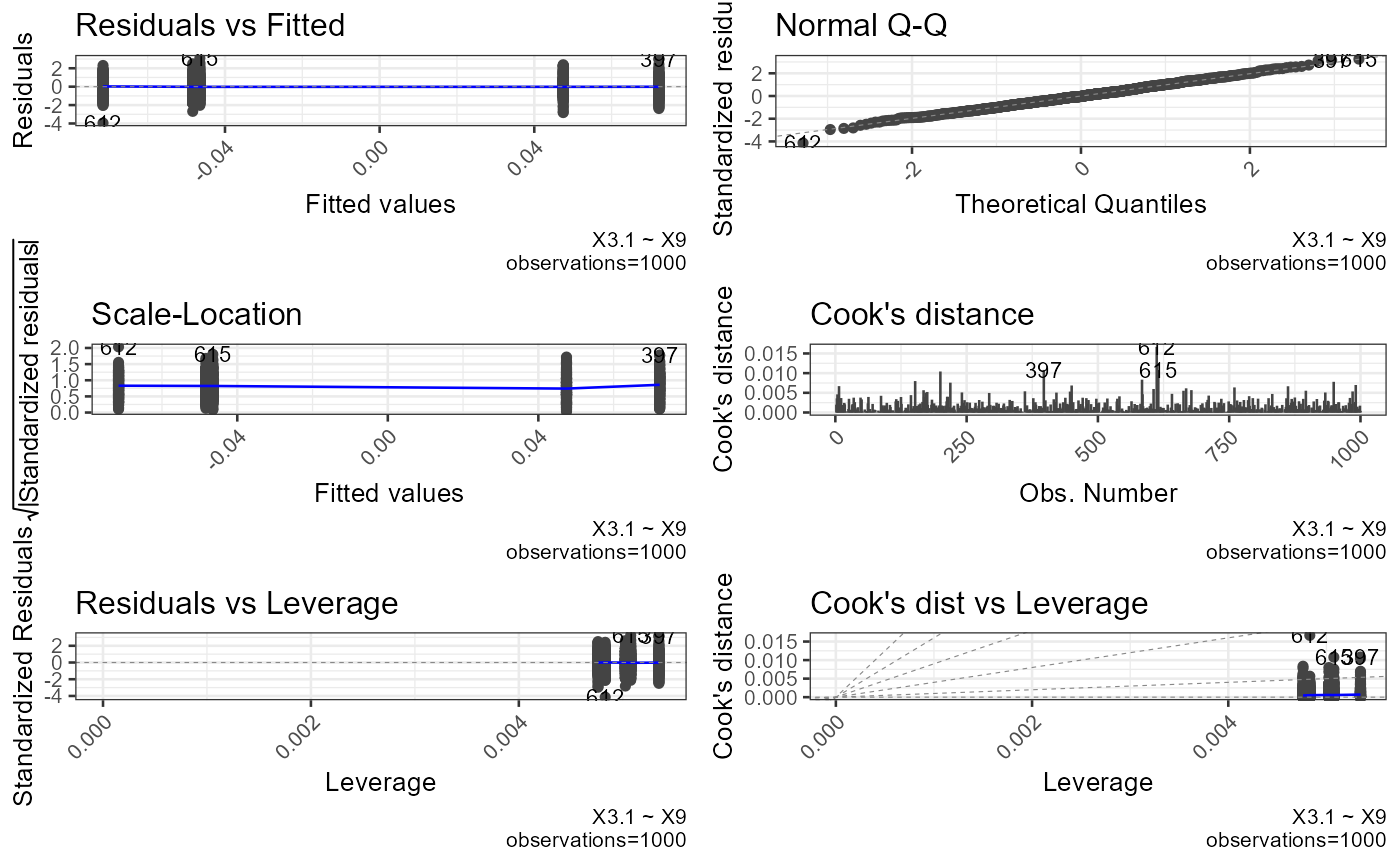
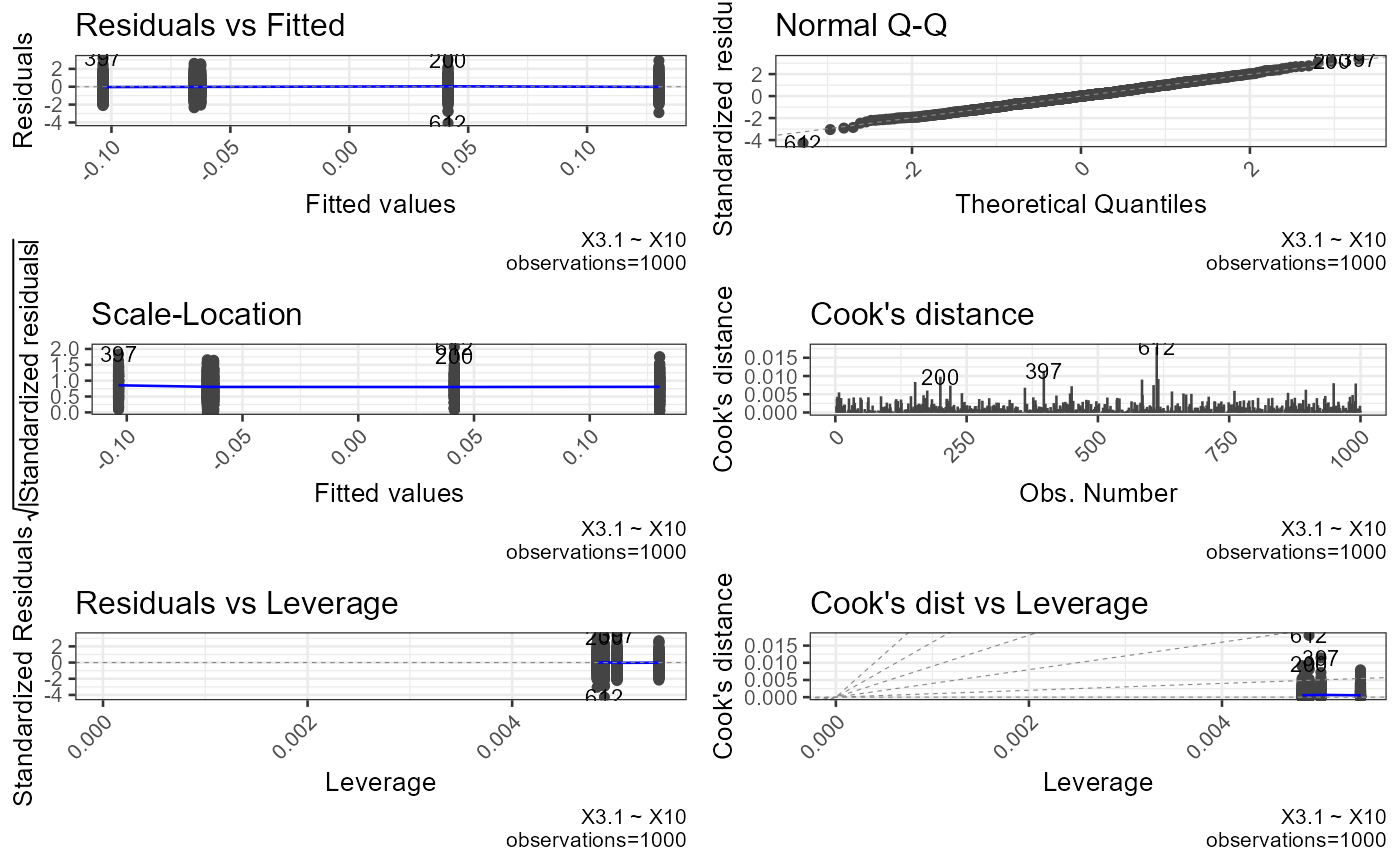
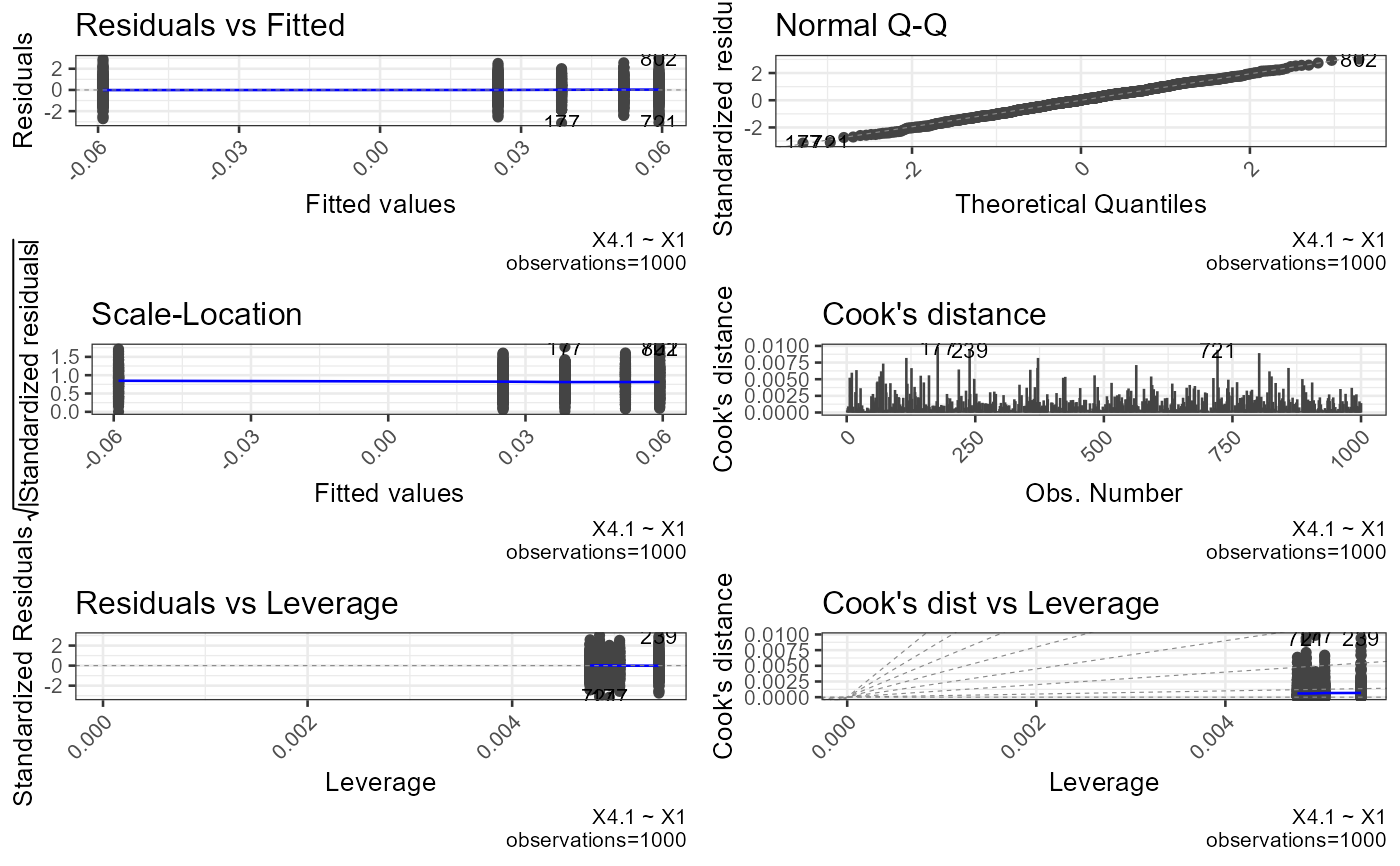
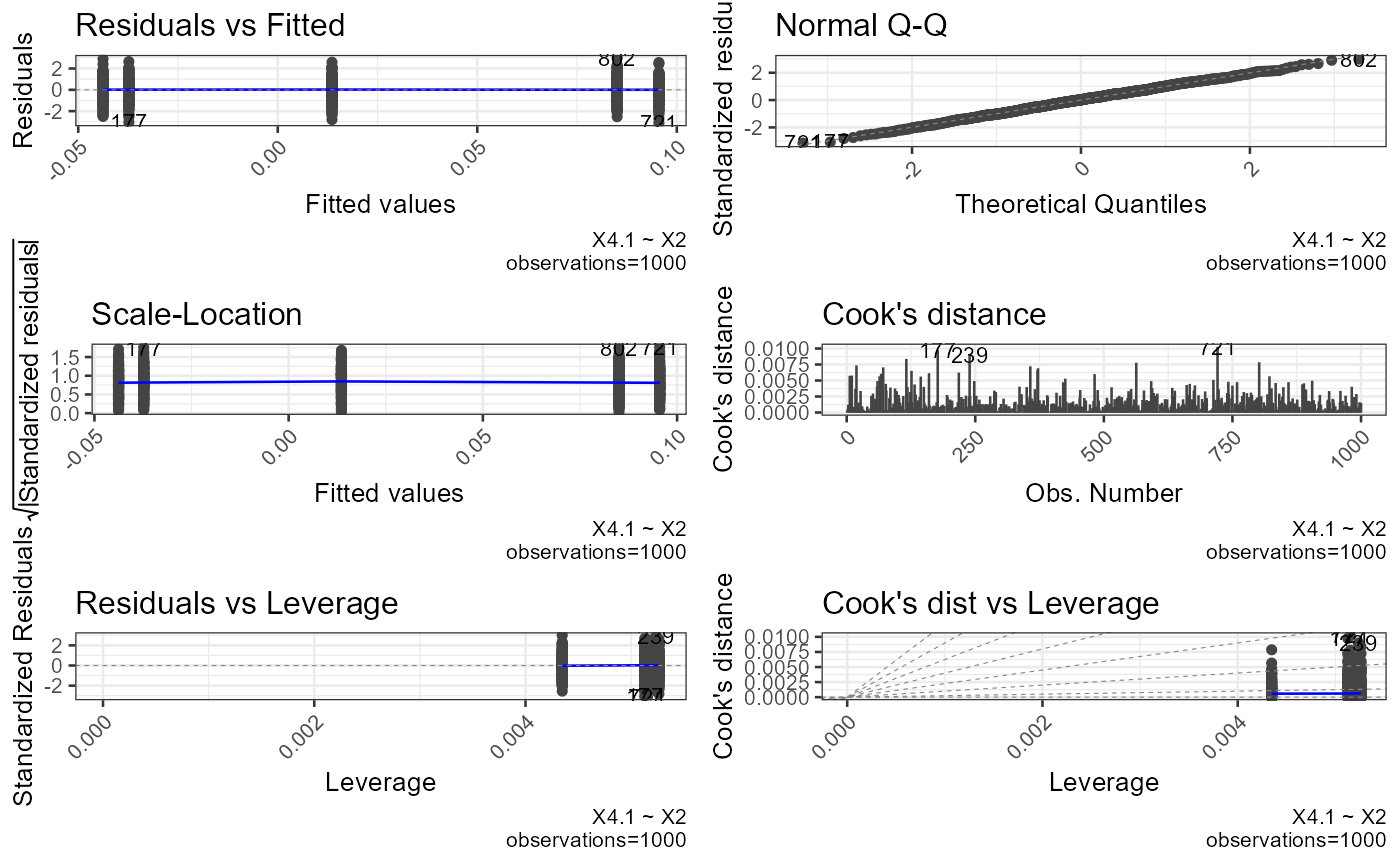
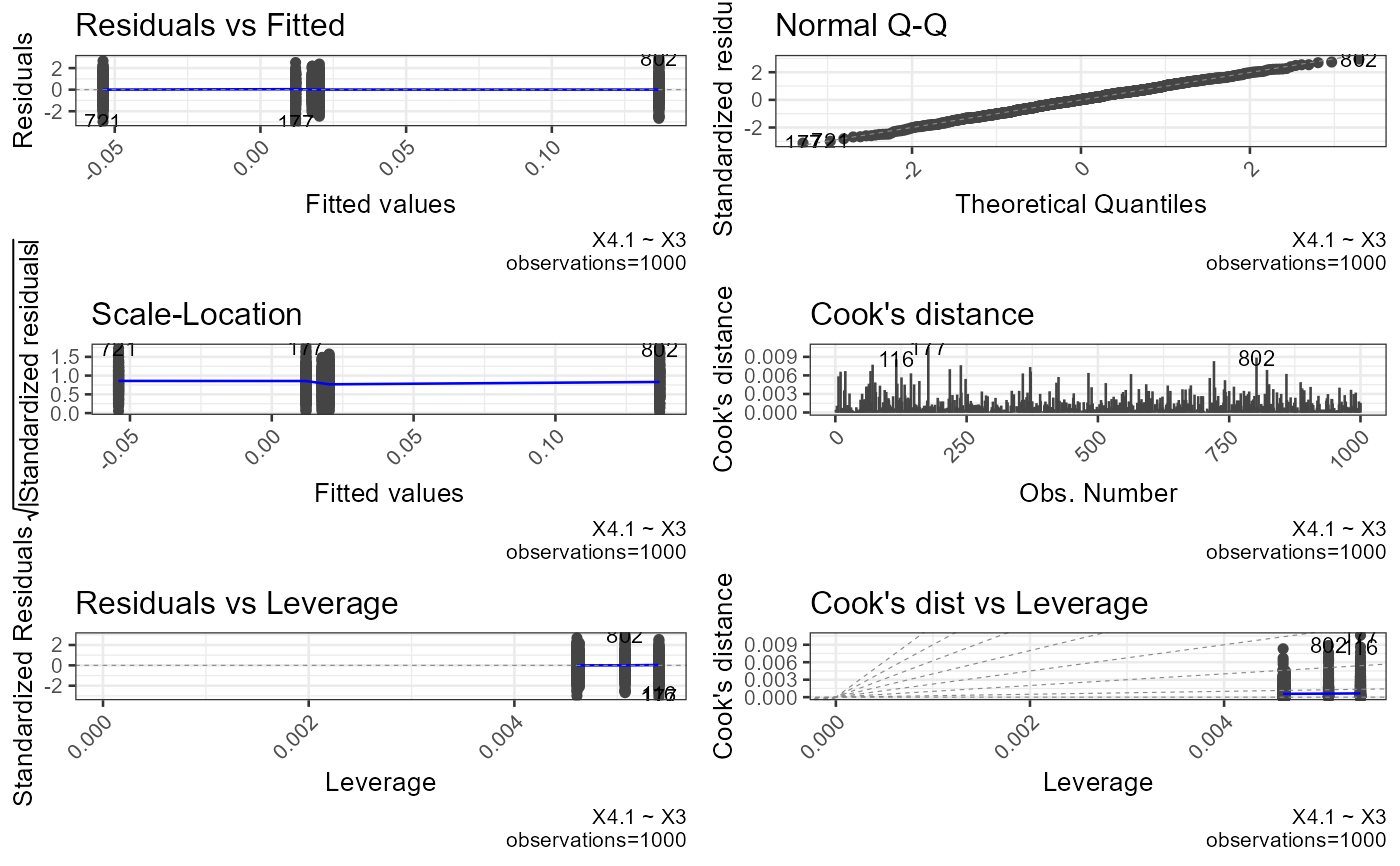
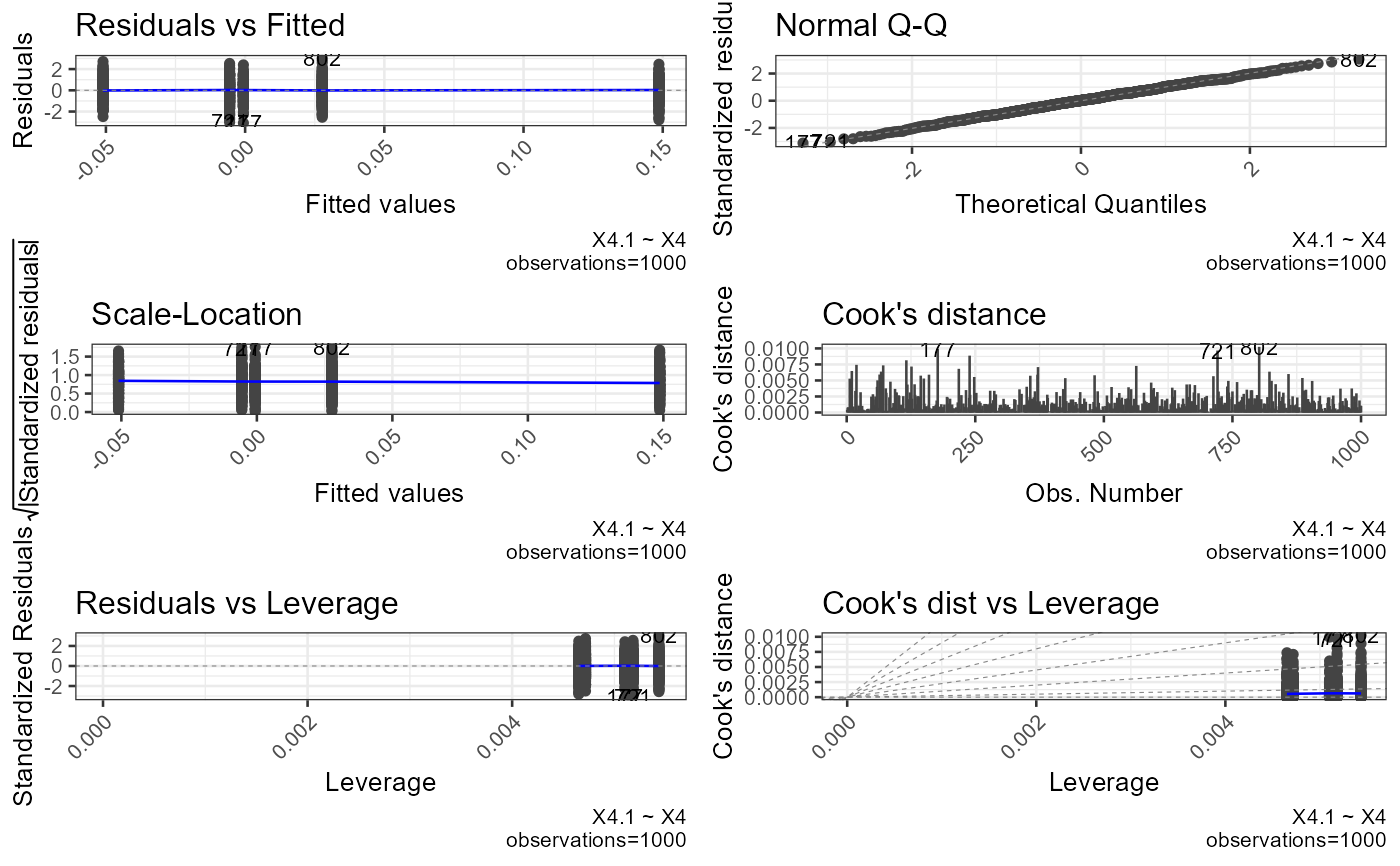
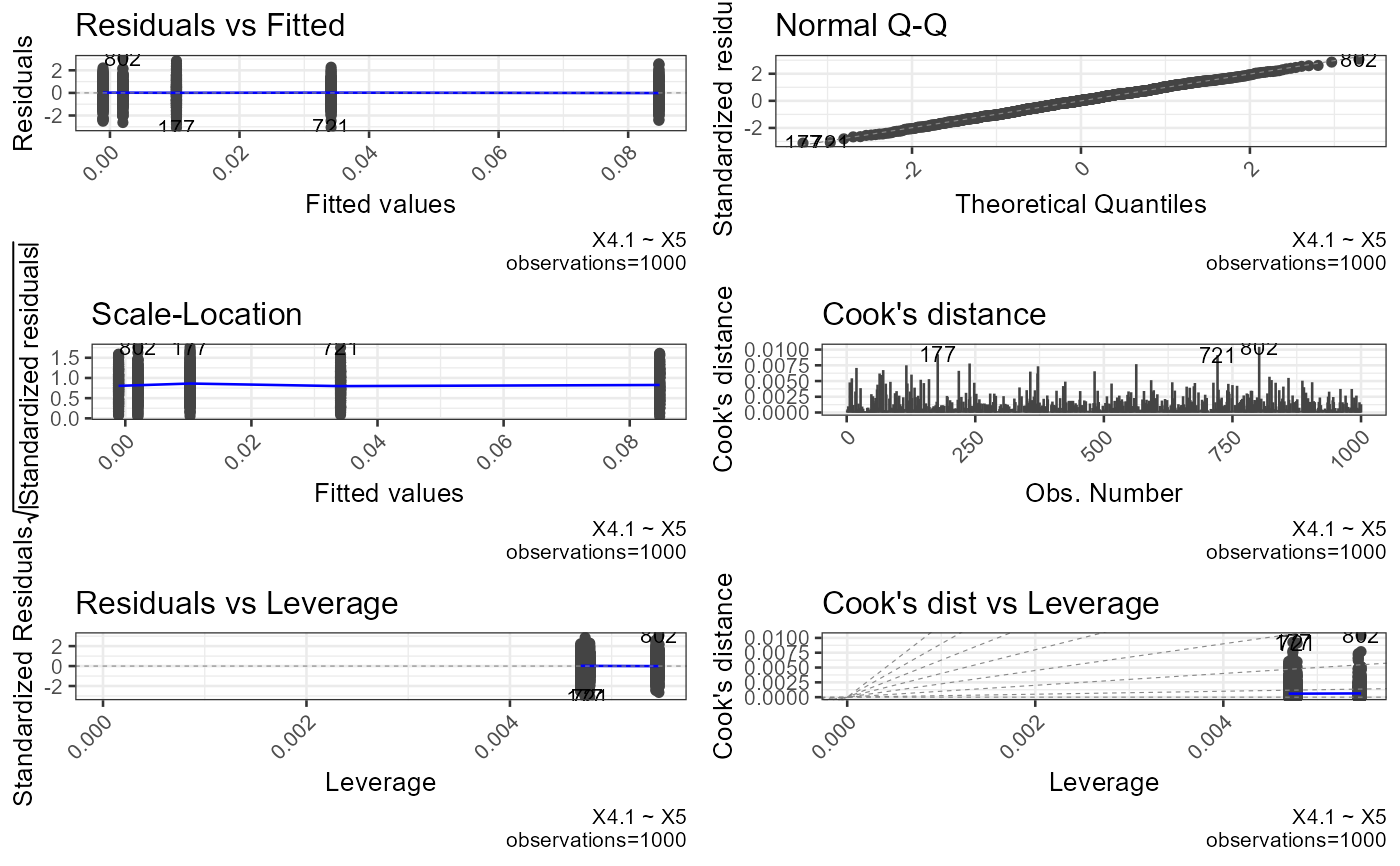
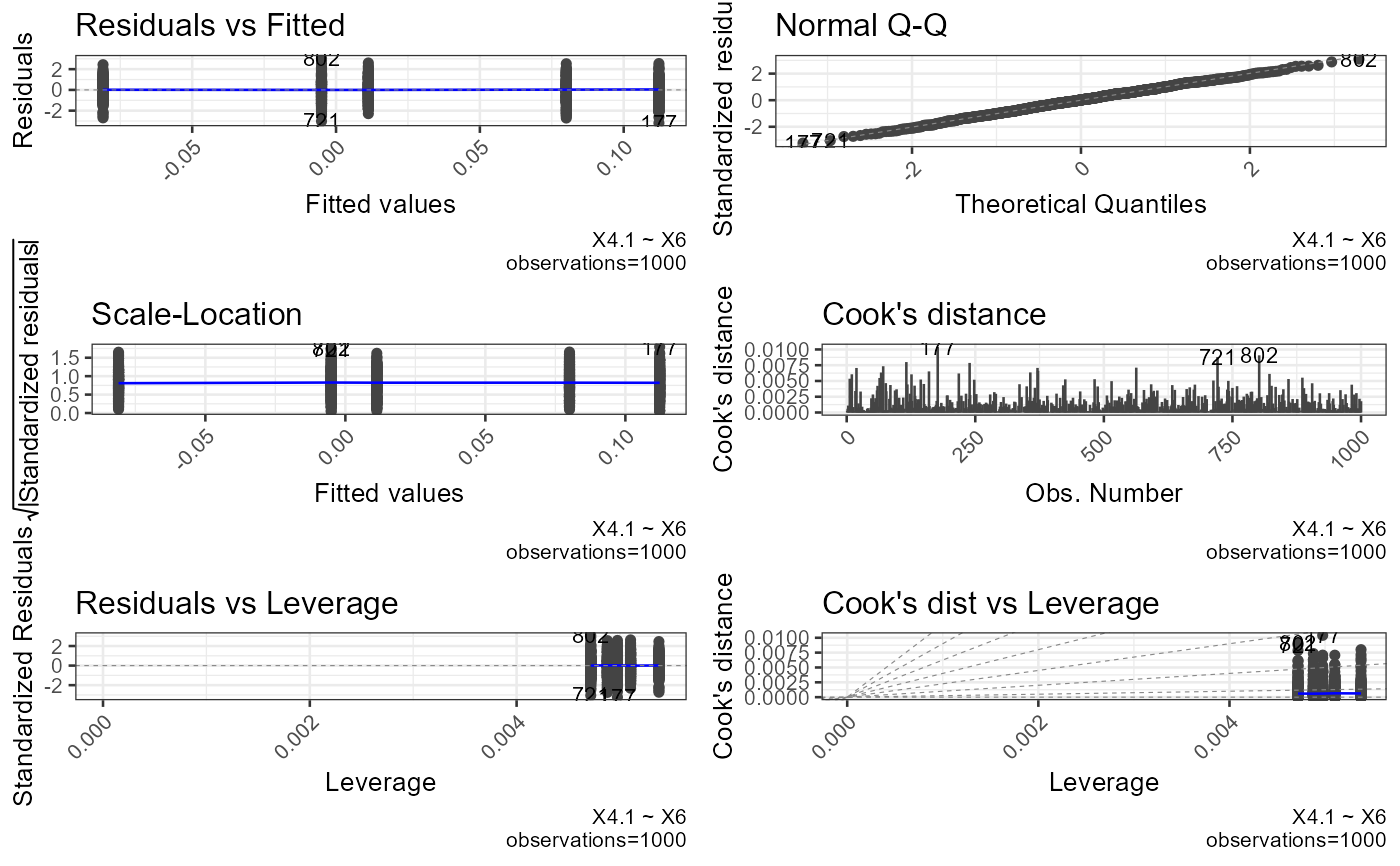
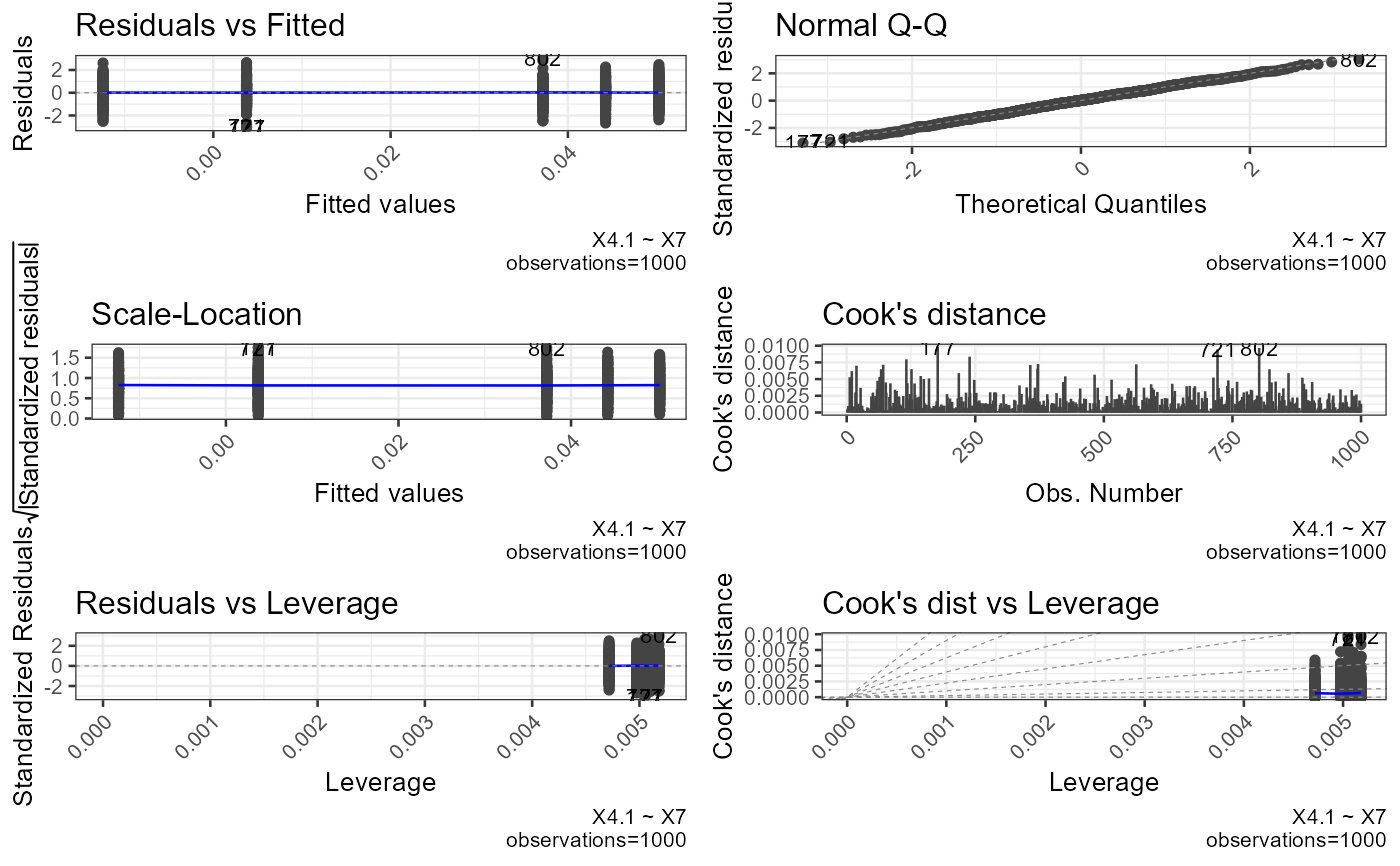
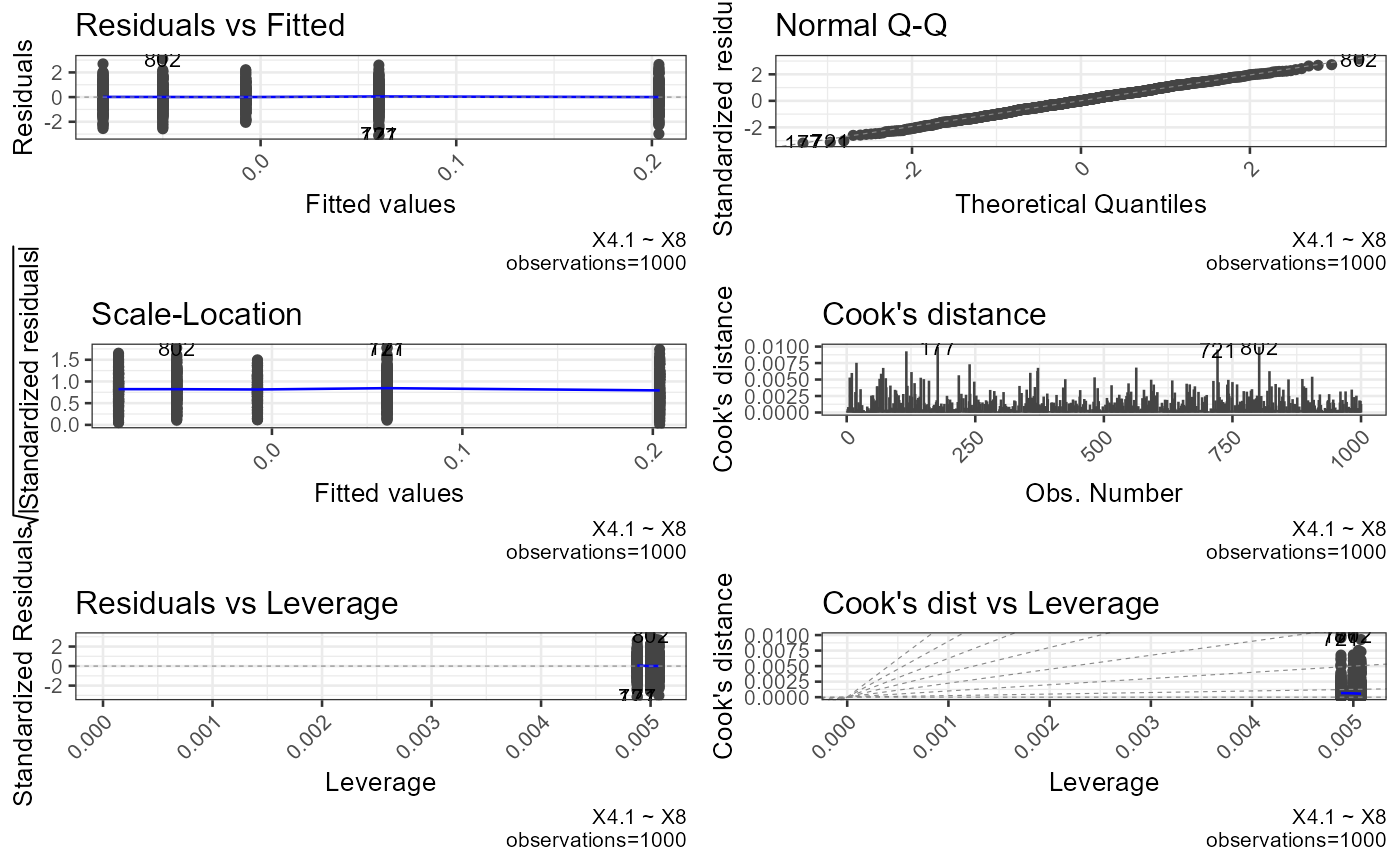
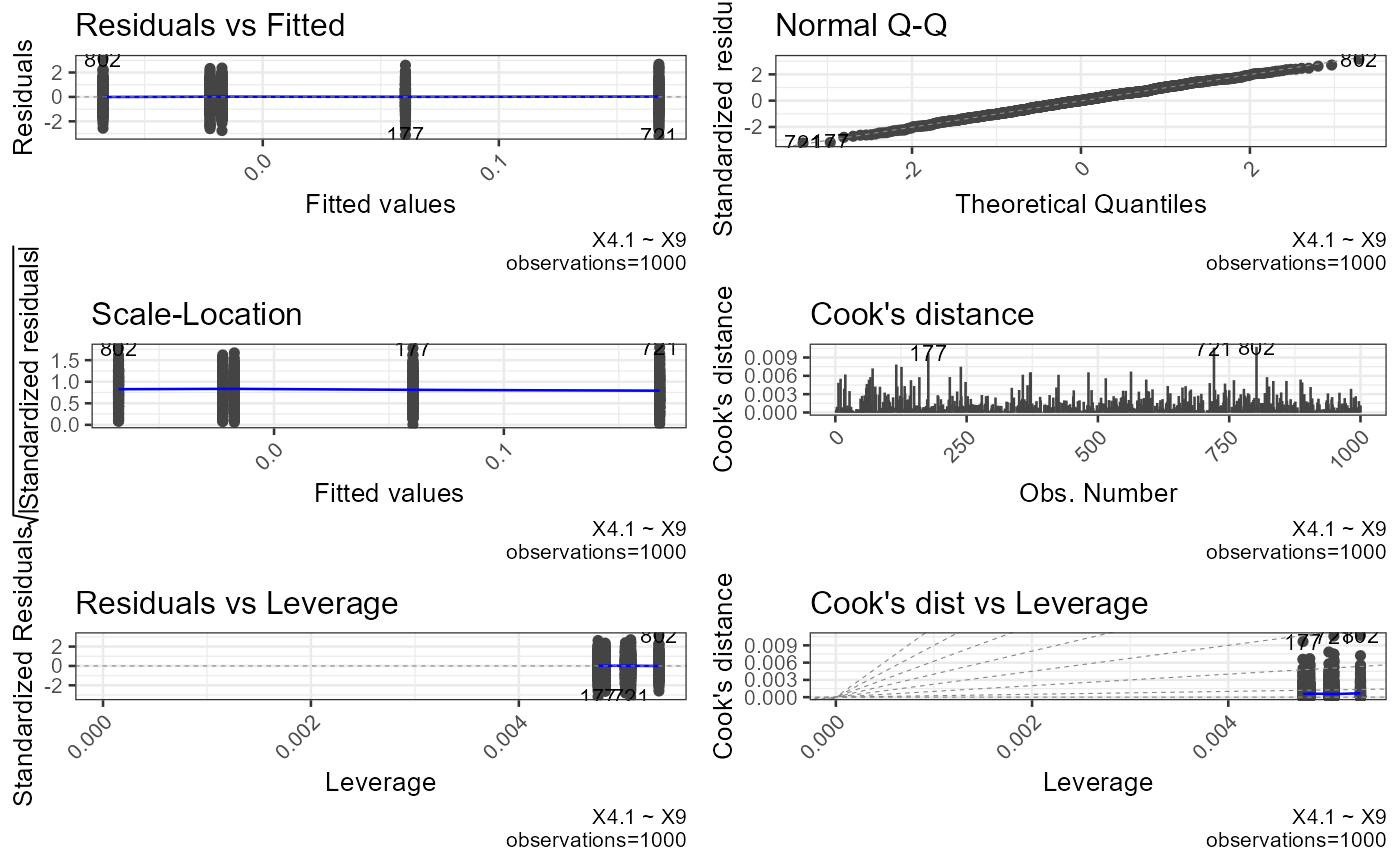
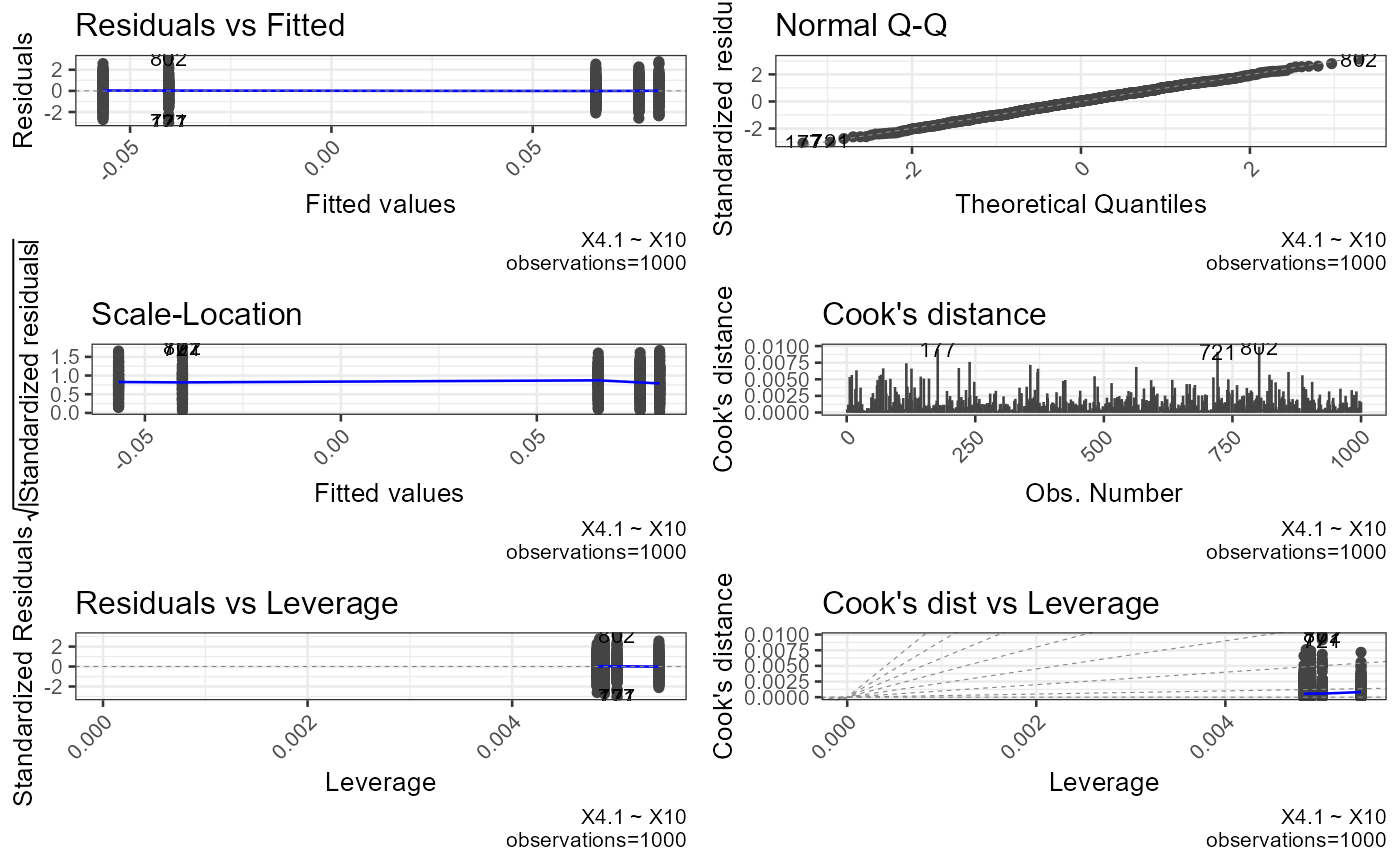
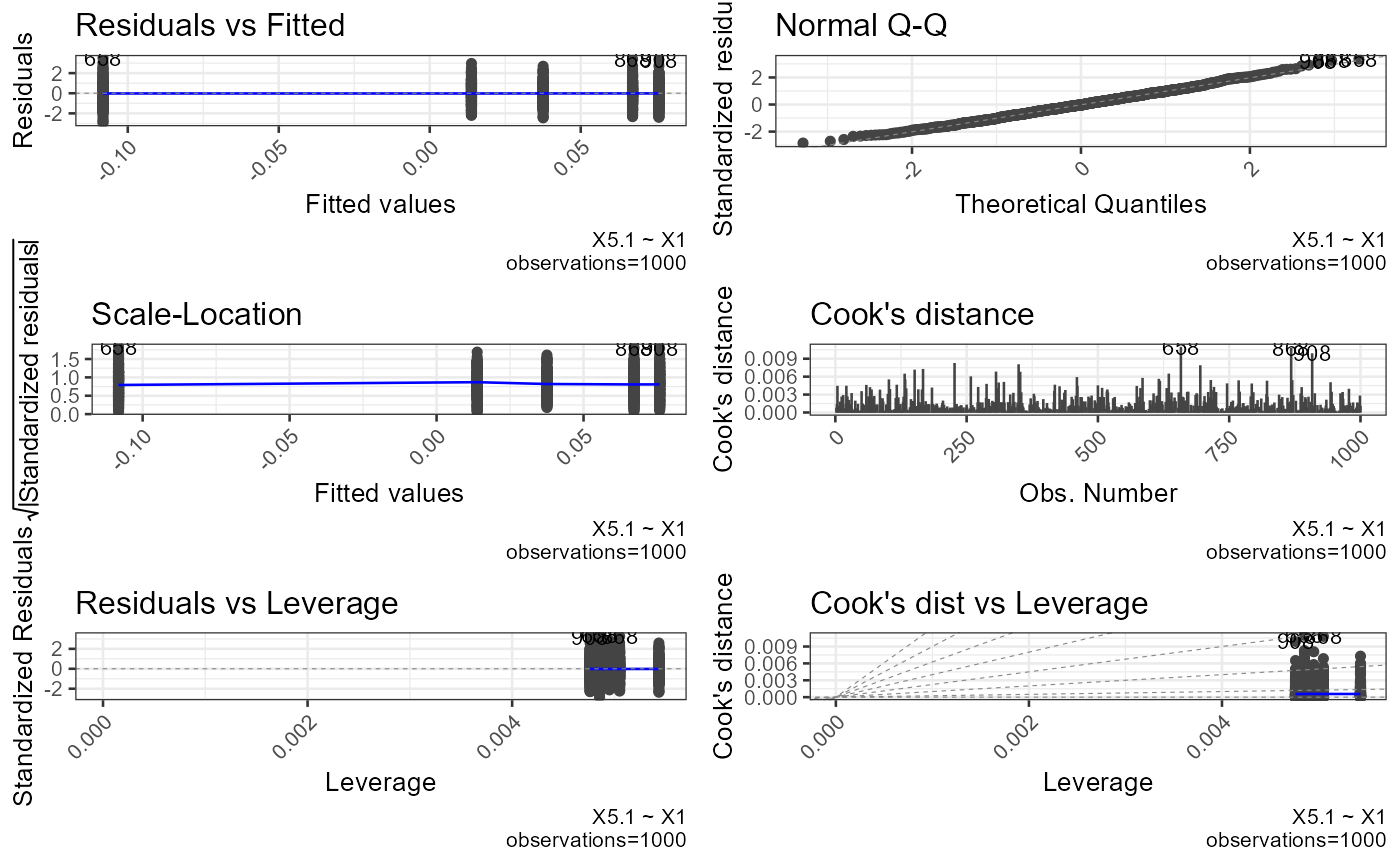
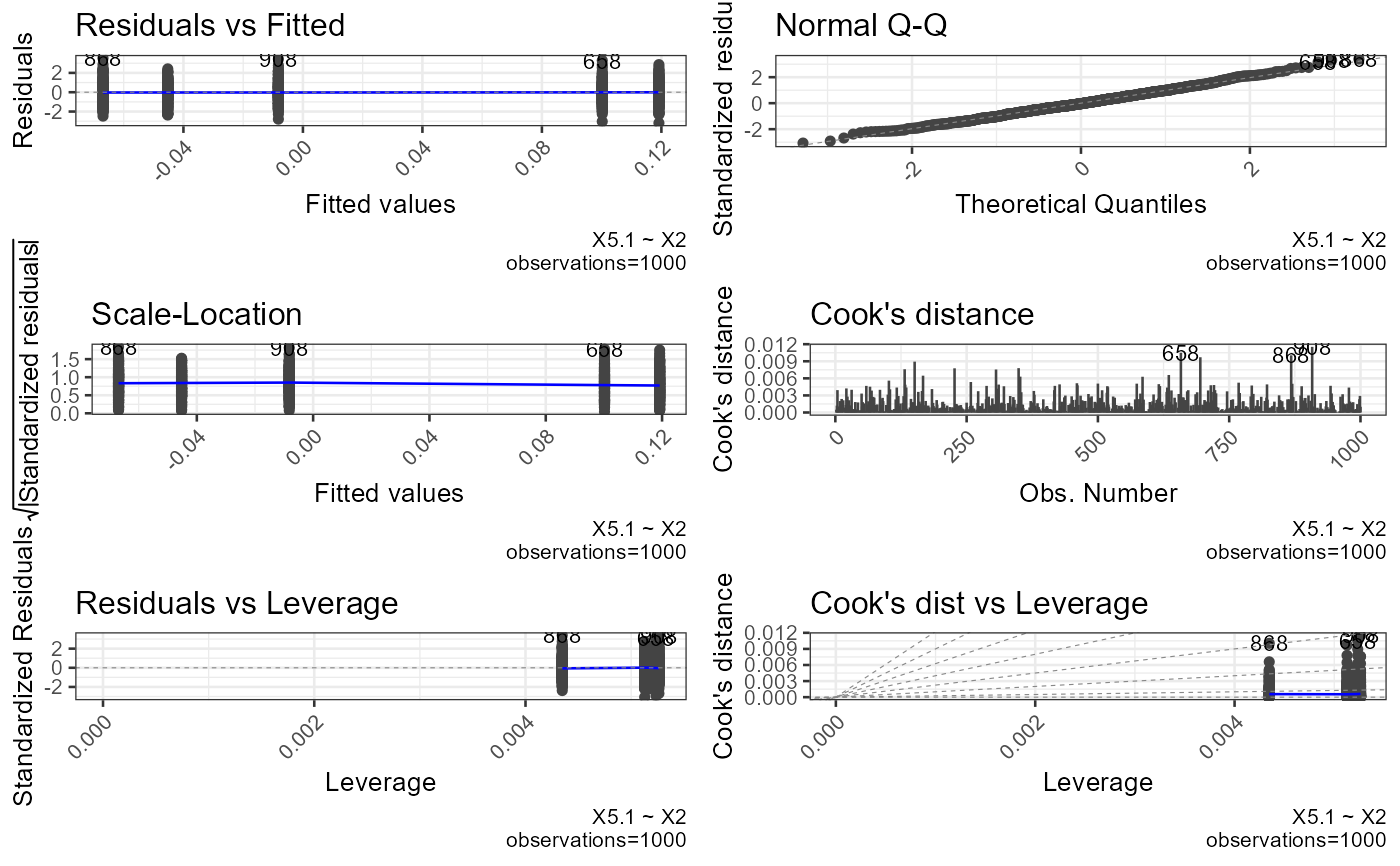
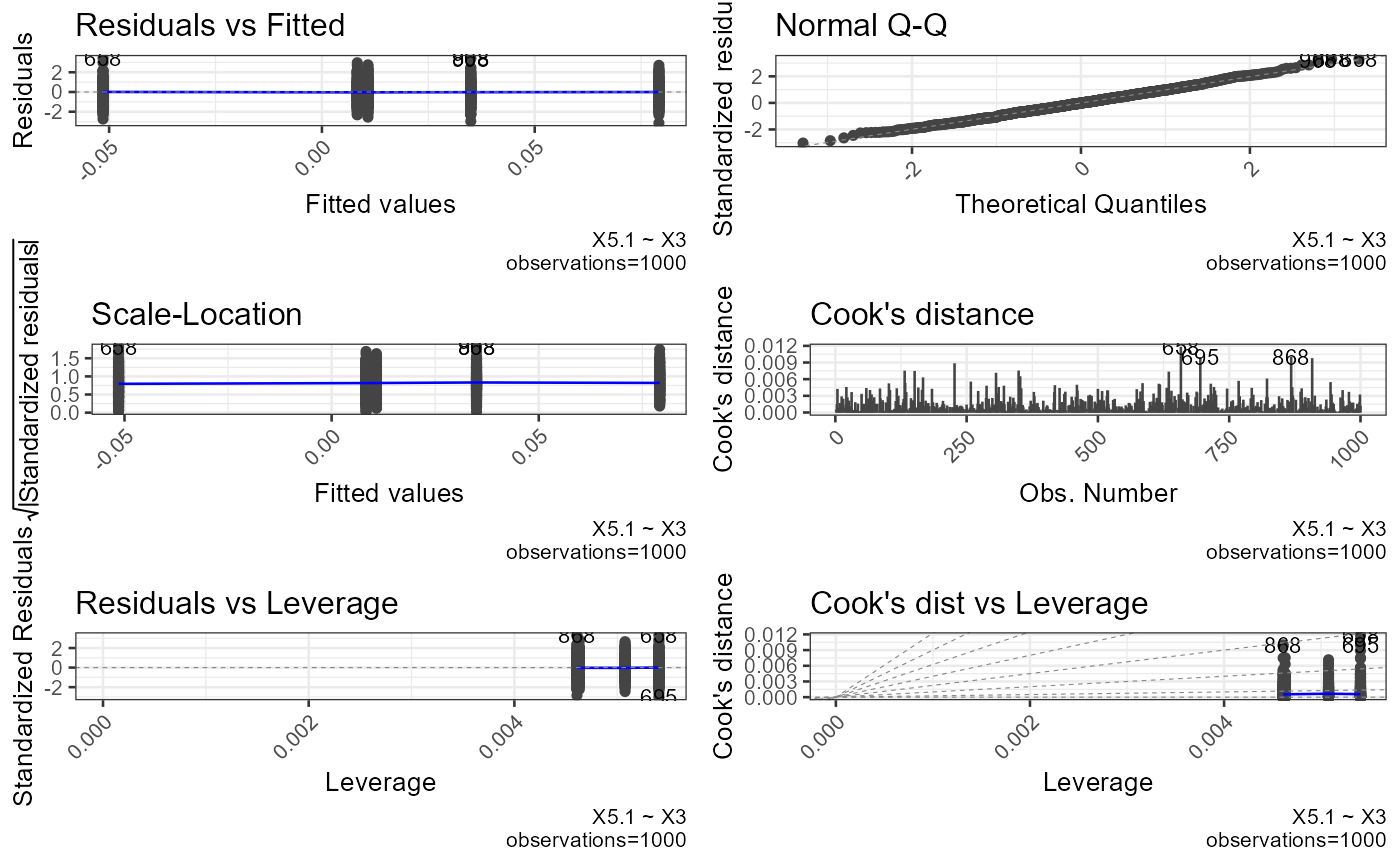
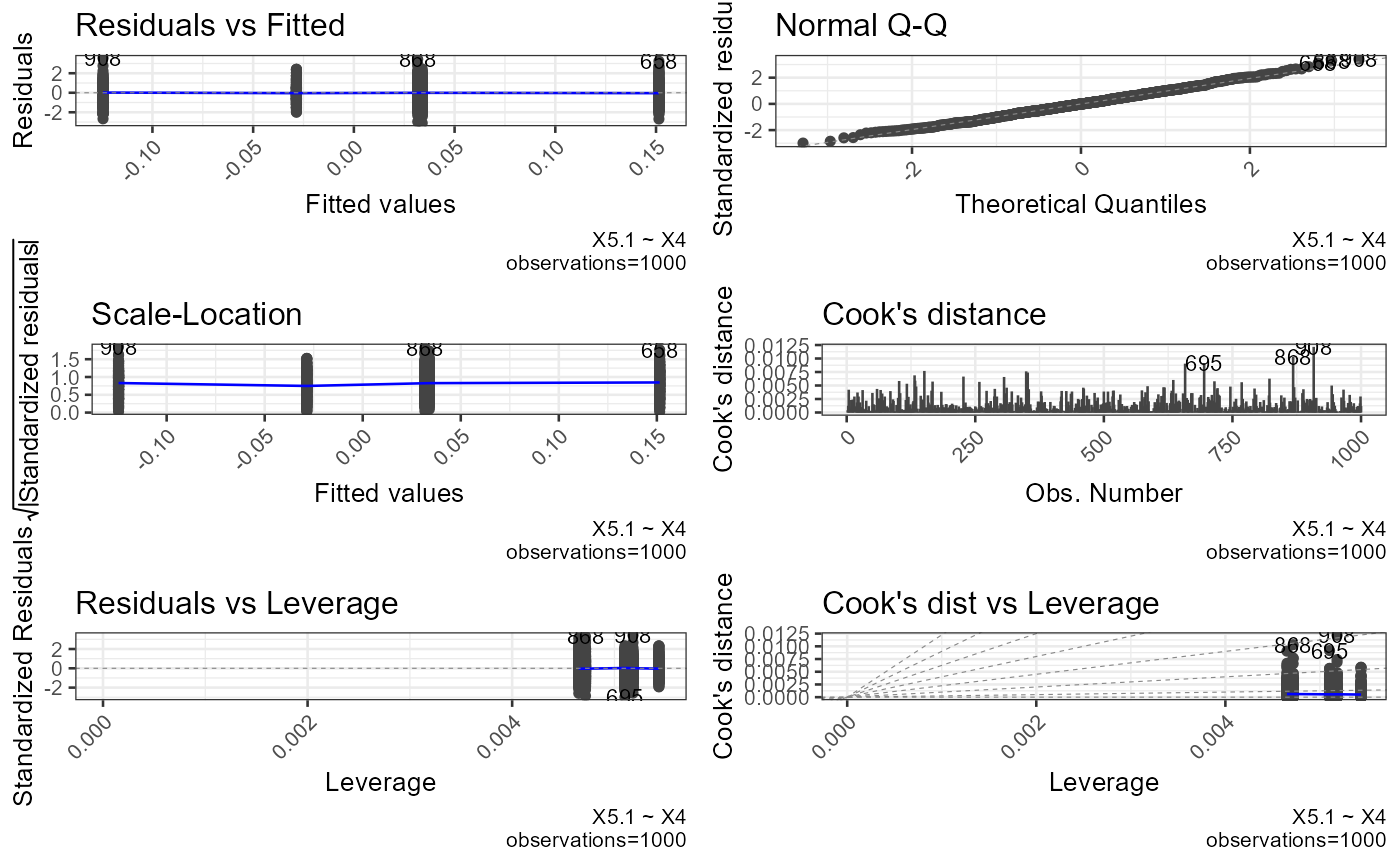
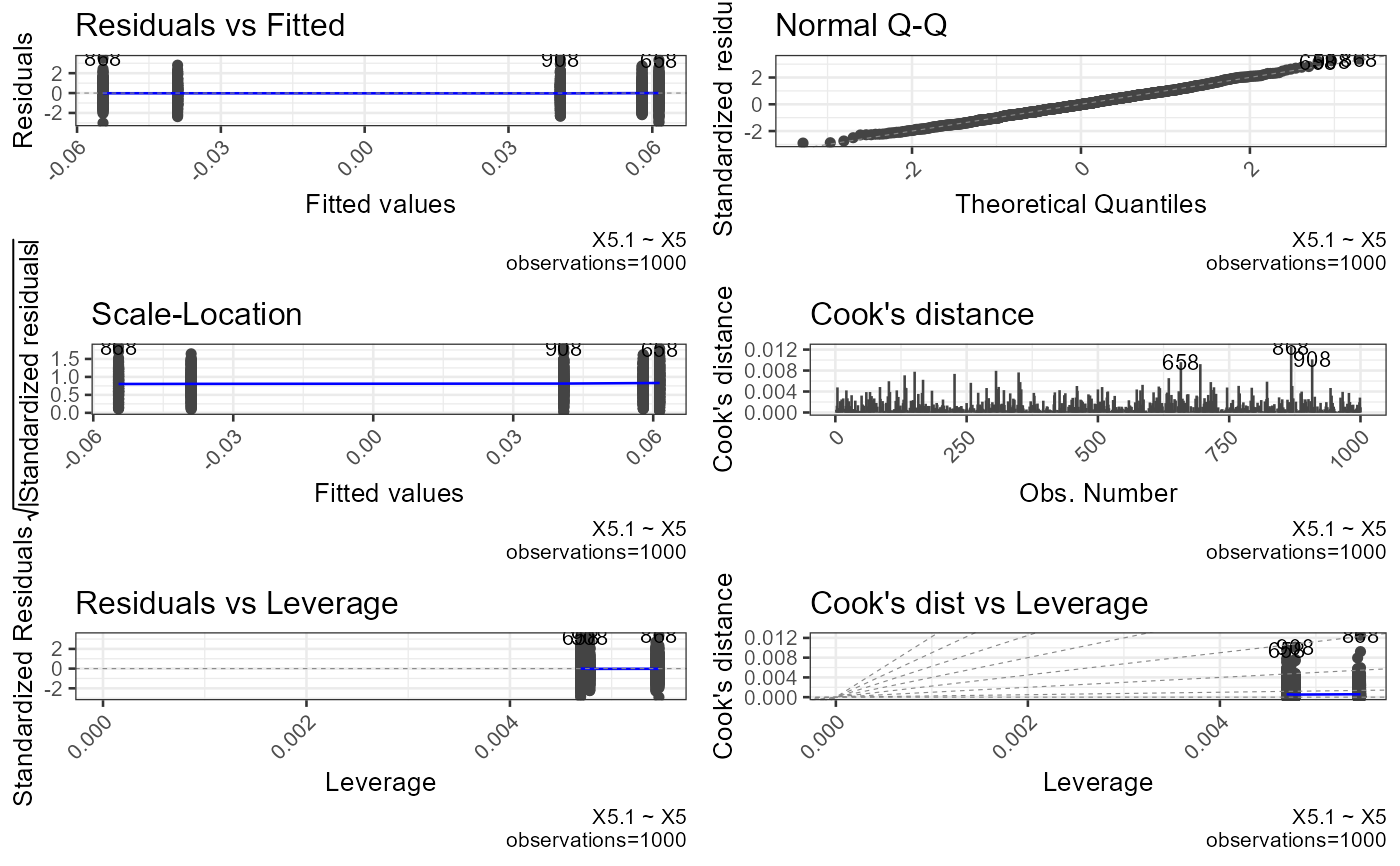
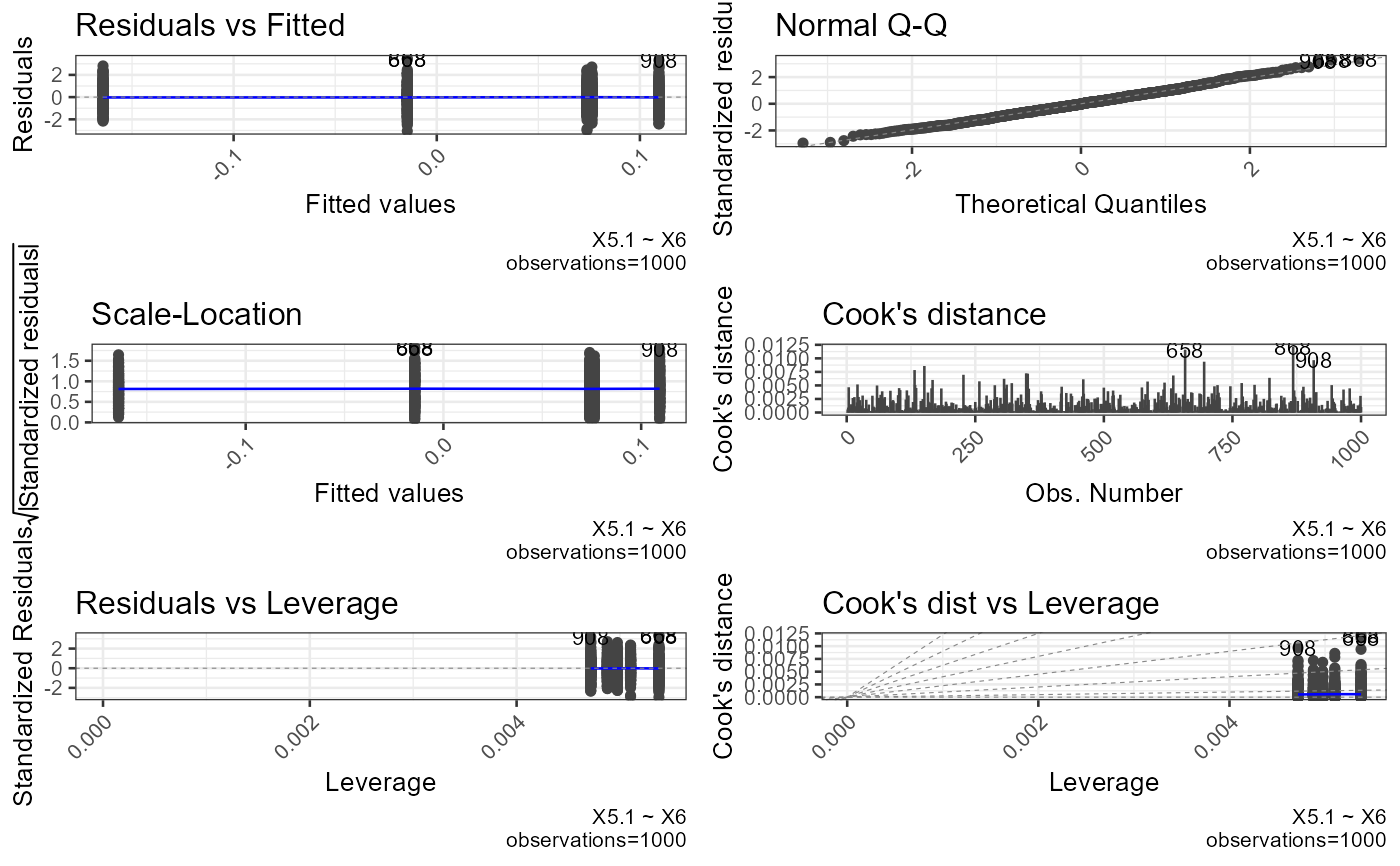
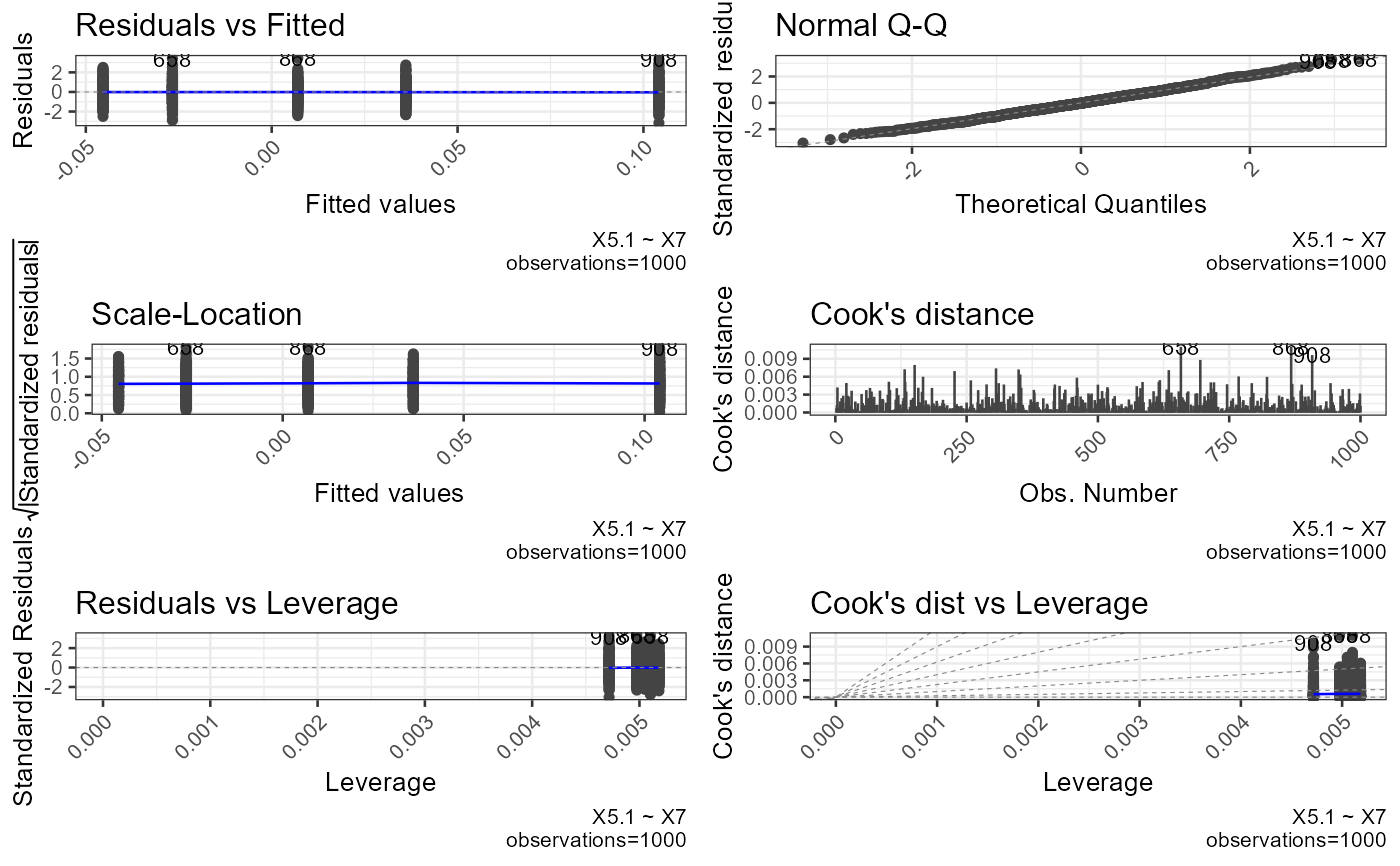
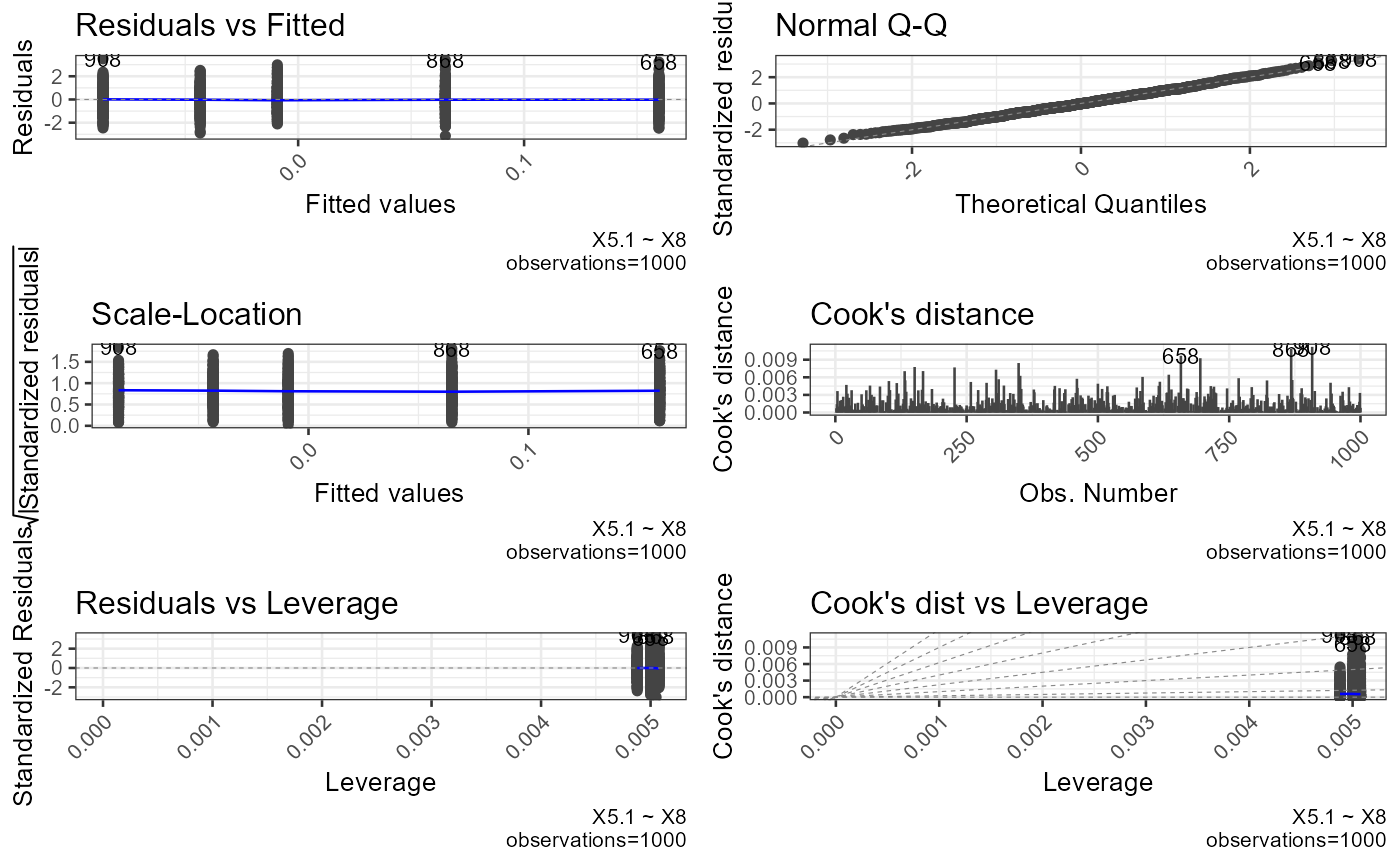
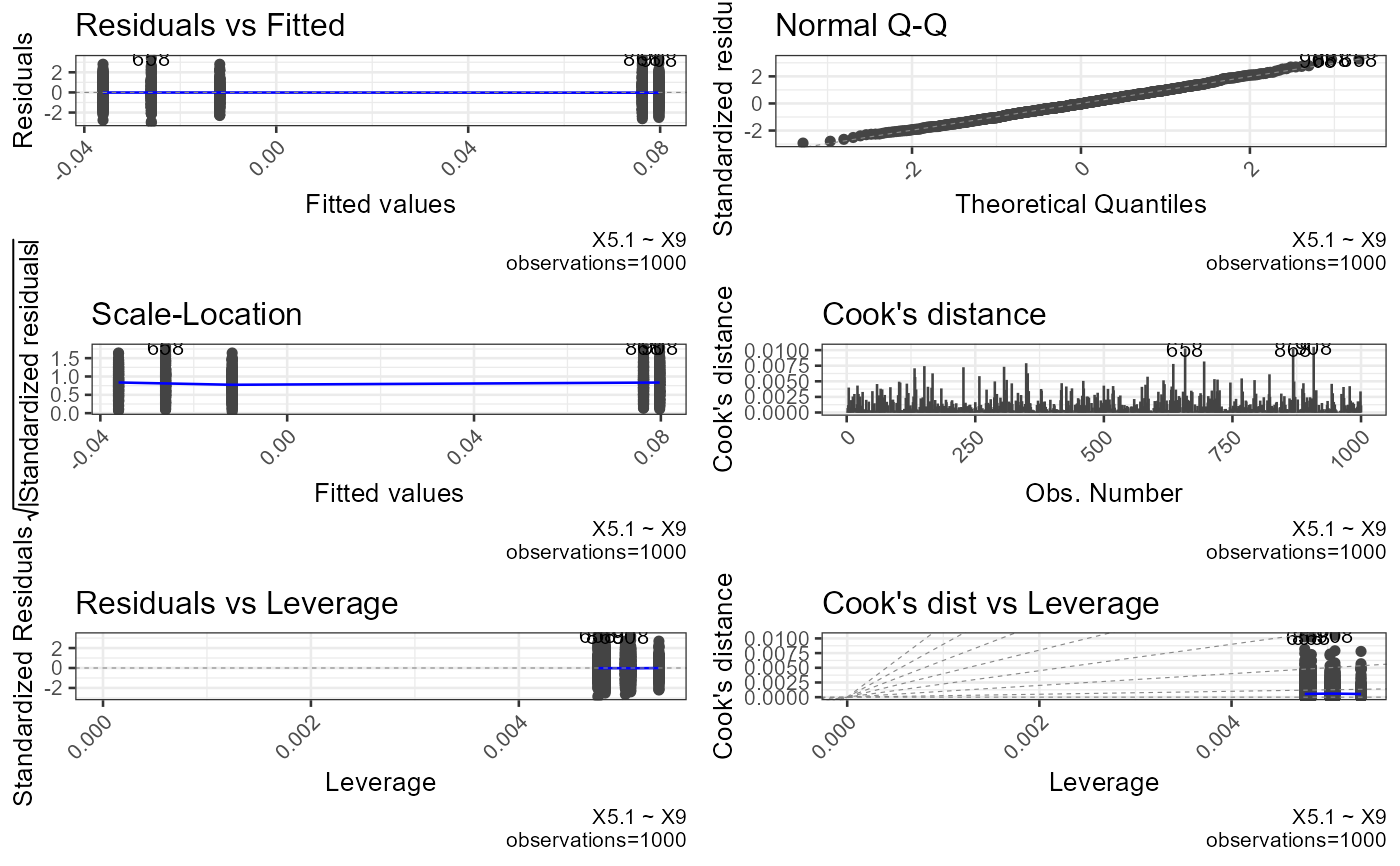
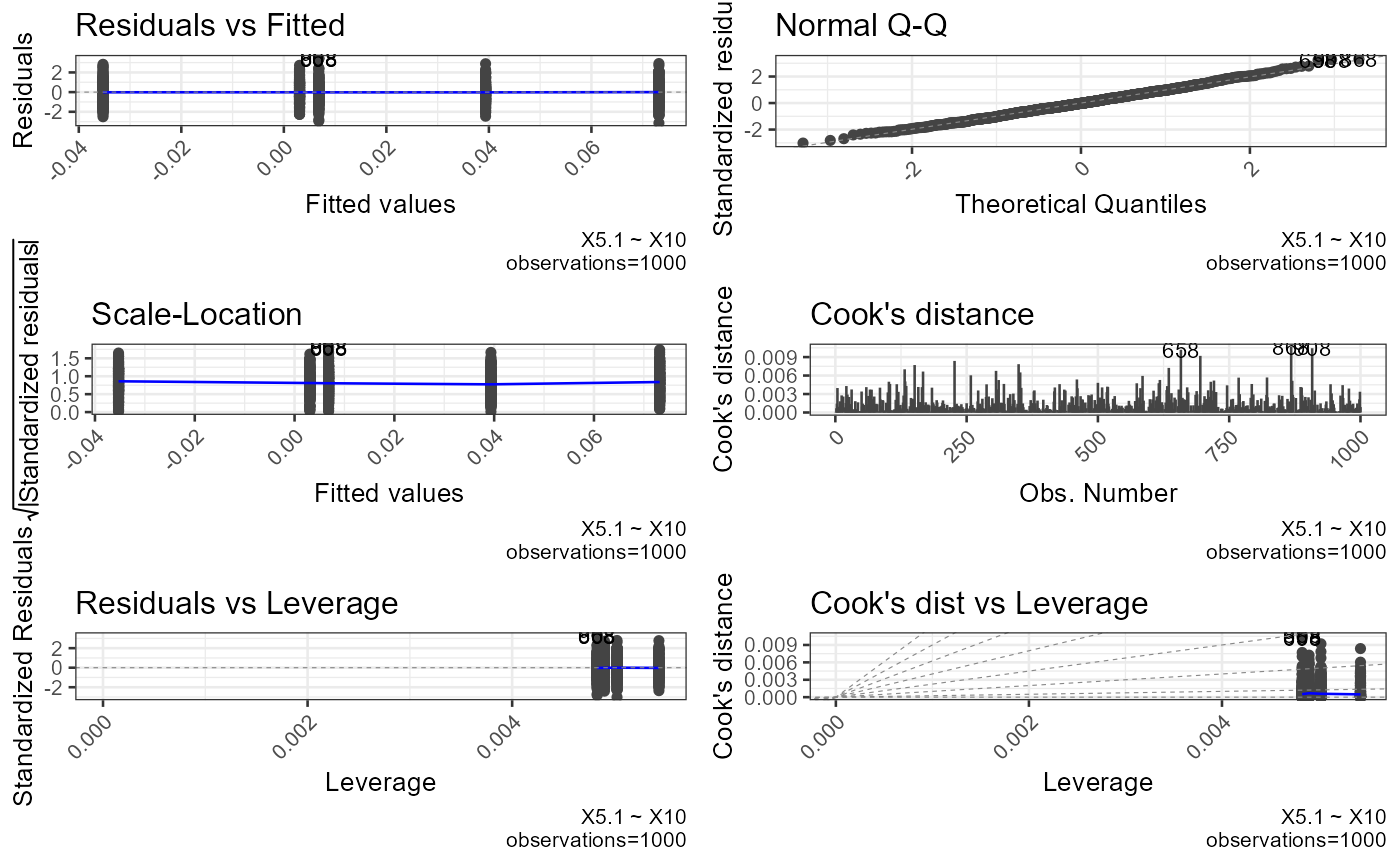
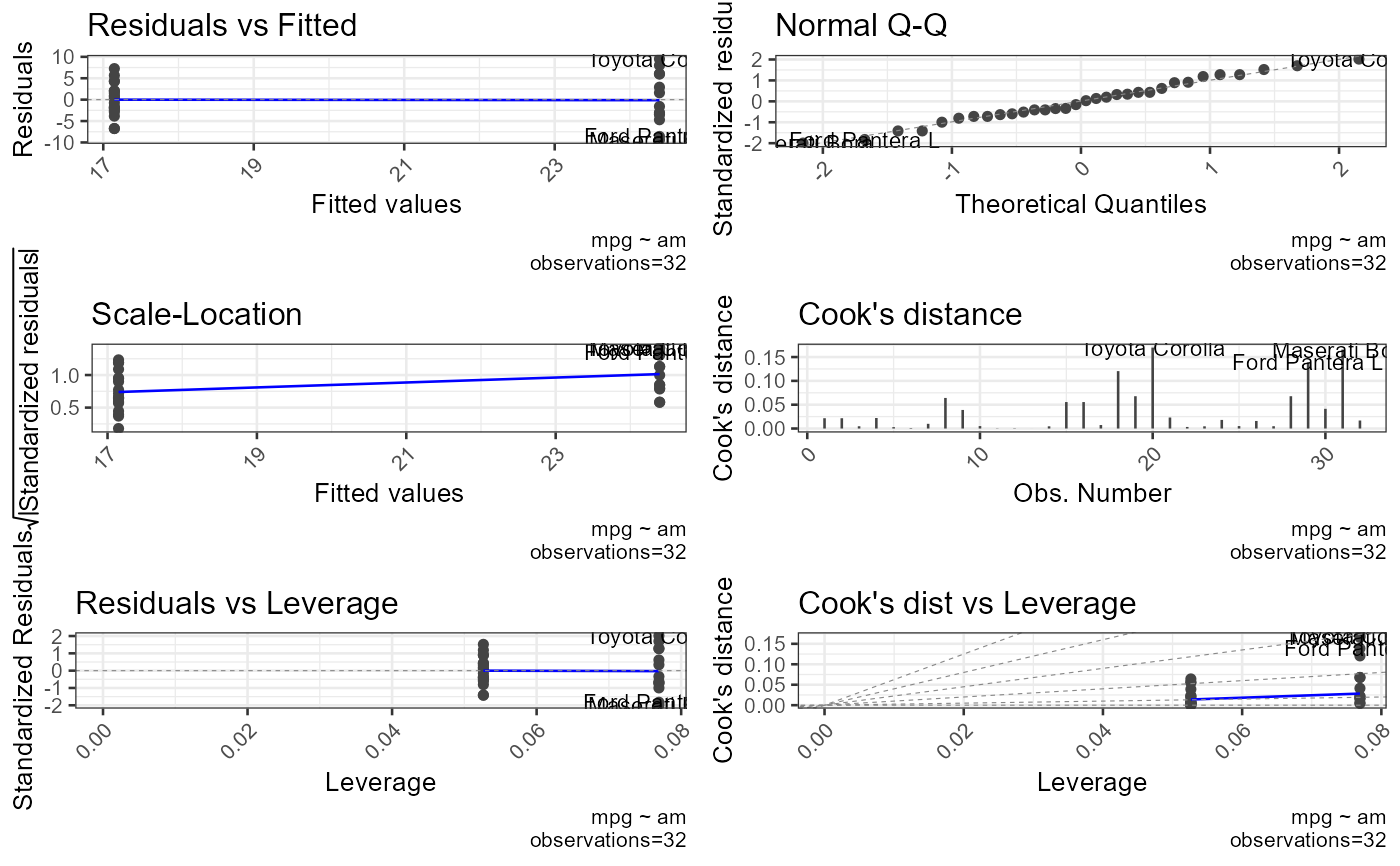
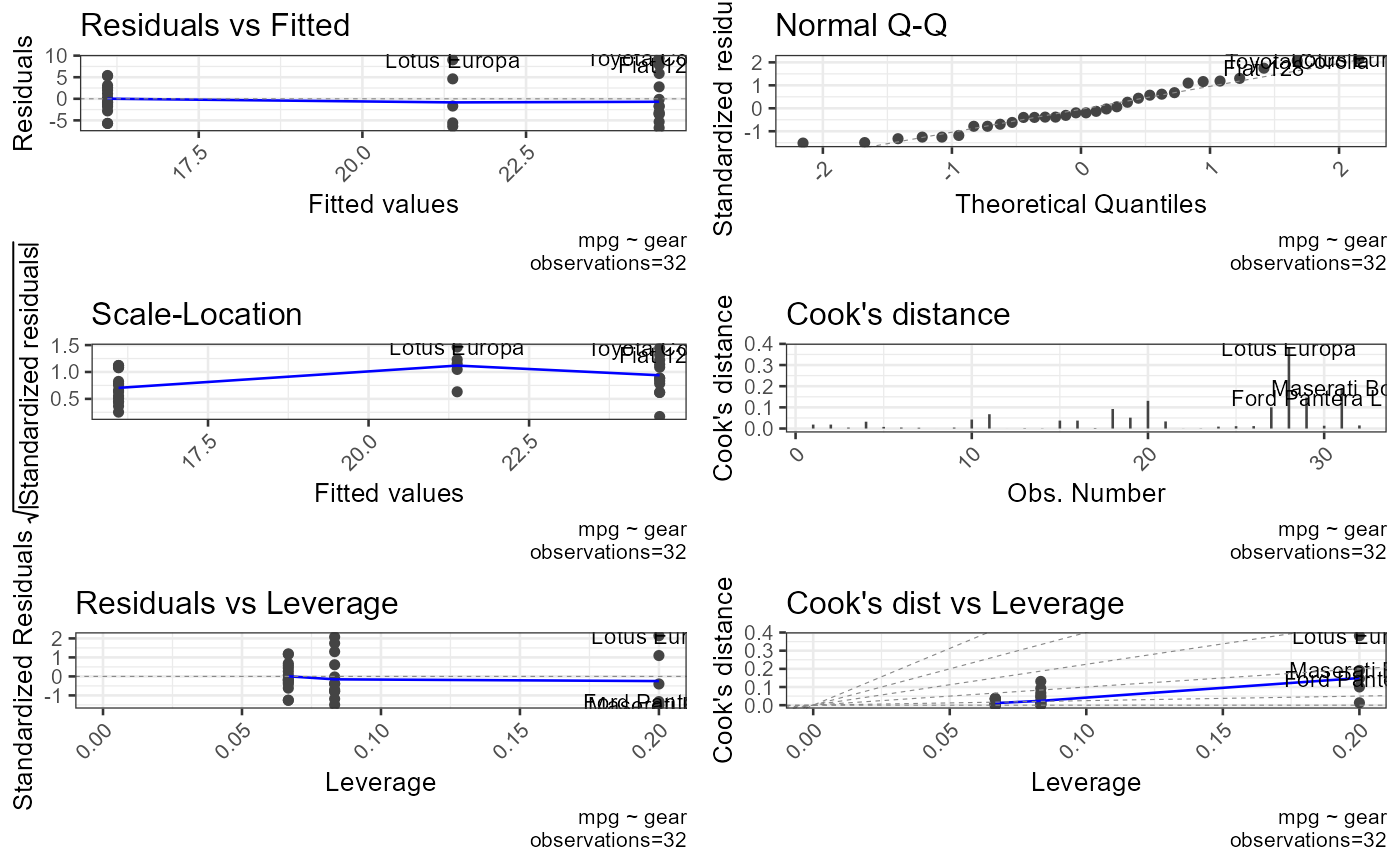
variable (DV), fits a linear model and produces a 6-panel diagnostic plot
via ggfortify::autoplot: Residuals vs Fitted, Normal Q-Q, Scale-Location,
Cook's Distance, Residuals vs Leverage, and Cook's Distance vs Leverage.
Interpretation:
Residuals vs Fitted — points should be randomly scattered with no pattern; a funnel shape indicates heteroscedasticity.
Normal Q-Q — points should follow the diagonal; large deviations indicate non-normality.
When the number of IV-DV combinations exceeds four times the available CPU
cores the plots are produced in parallel via future.apply, otherwise
sequentially.
Examples
nrows <- 1000
df <- data.frame(
generate_factor(vector = LETTERS[1:5], nrows = nrows, ncols = 10, type = "random"),
generate_data(nrows = nrows, ncols = 5, type = "normal")
)
result <- plot_oneway_diagnostics(df = df, dv = 11:15, iv = 1:10)
#> Warning: `fortify(<lm>)` was deprecated in ggplot2 4.0.0.
#> ℹ Please use `broom::augment(<lm>)` instead.
#> ℹ The deprecated feature was likely used in the ggfortify package.
#> Please report the issue at <https://github.com/sinhrks/ggfortify/issues>.
 # Single DV, multiple IVs
plot_oneway_diagnostics(df = mtcars, dv = 1, iv = 9:10)
 # Multiple DVs and IVs
plot_oneway_diagnostics(df = mtcars, dv = 1:2, iv = 9:10)