Plot group means with error bars for all IV-DV combinations
Source:R/GLM_ANOVA_PLOT.R
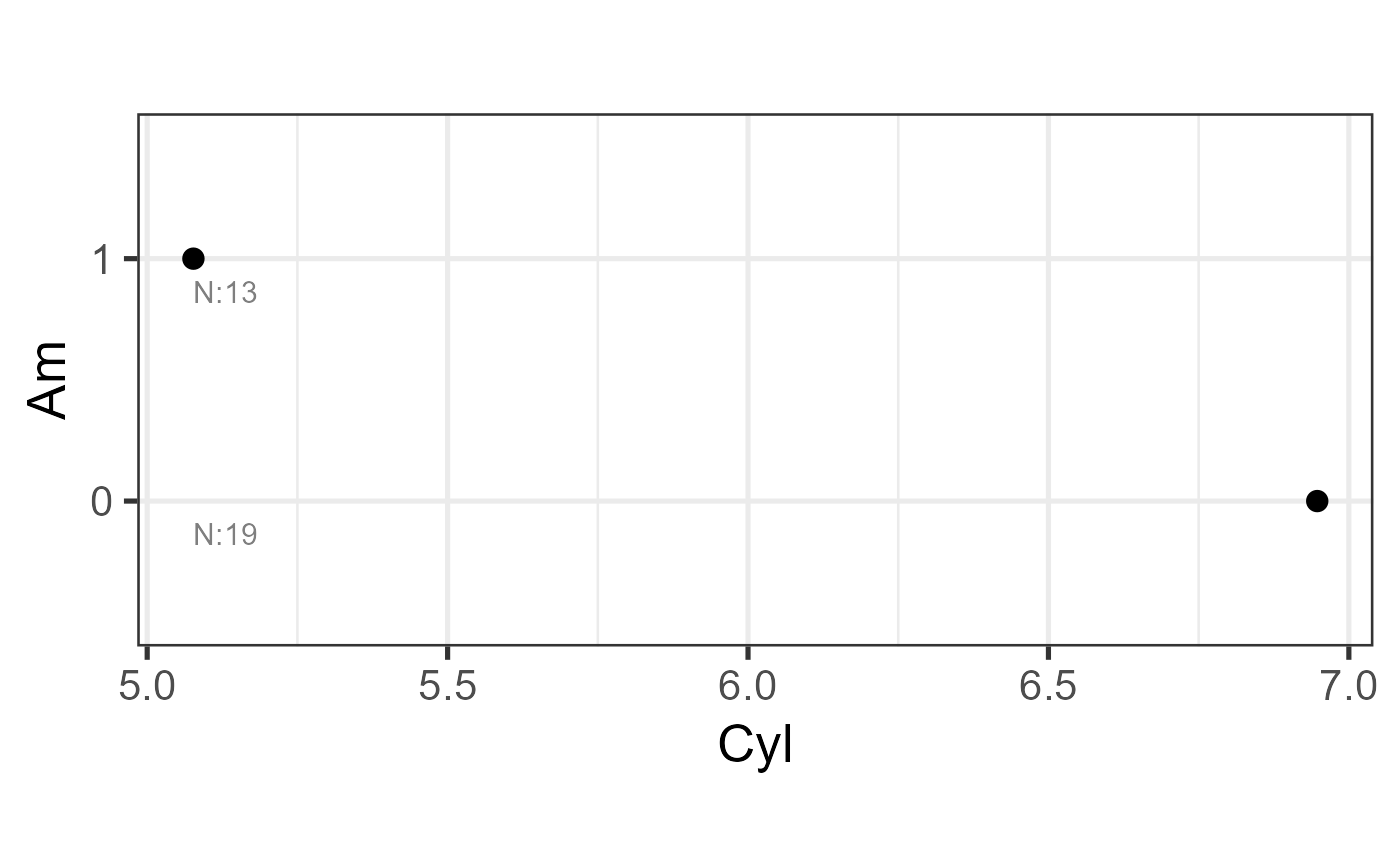
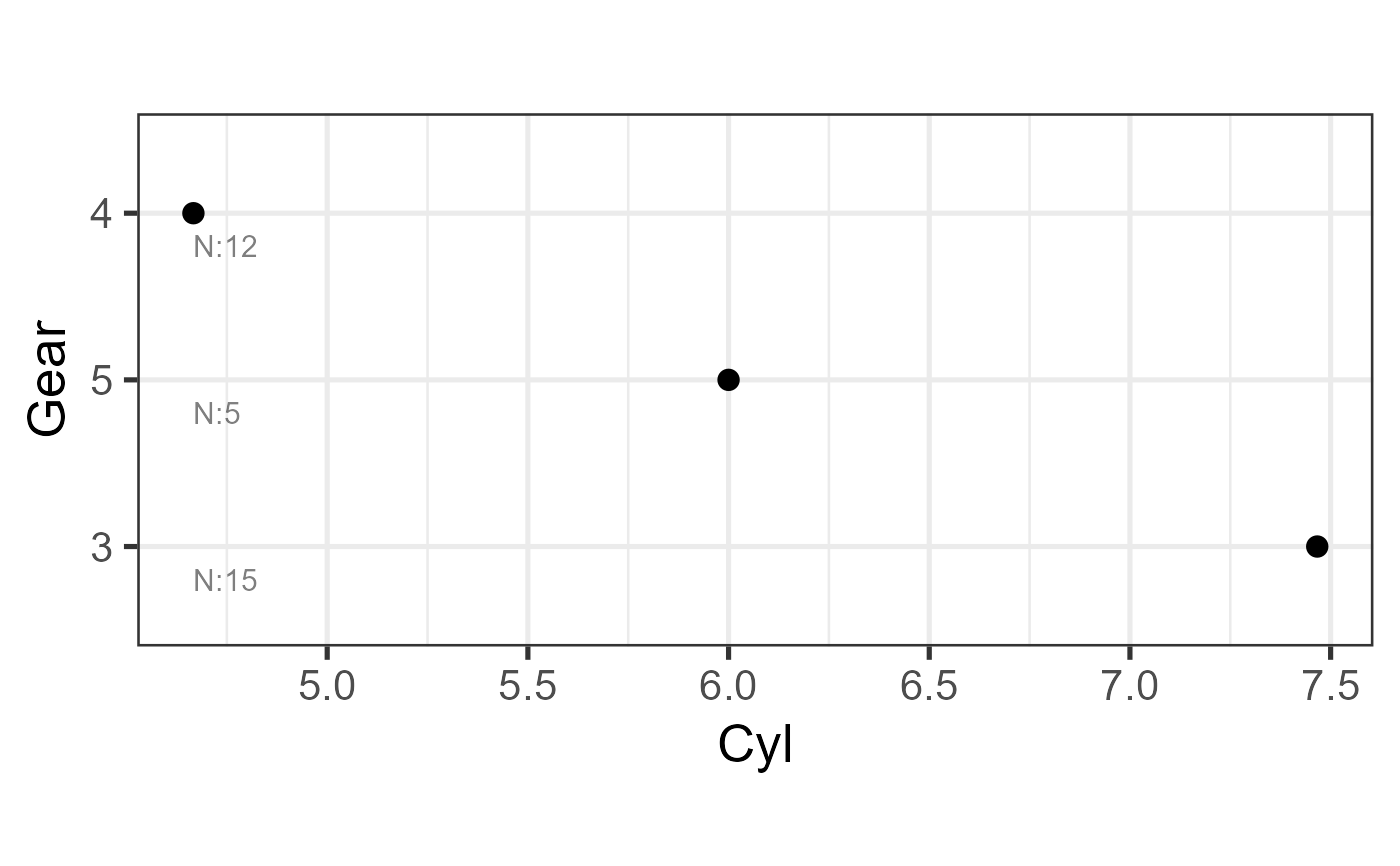
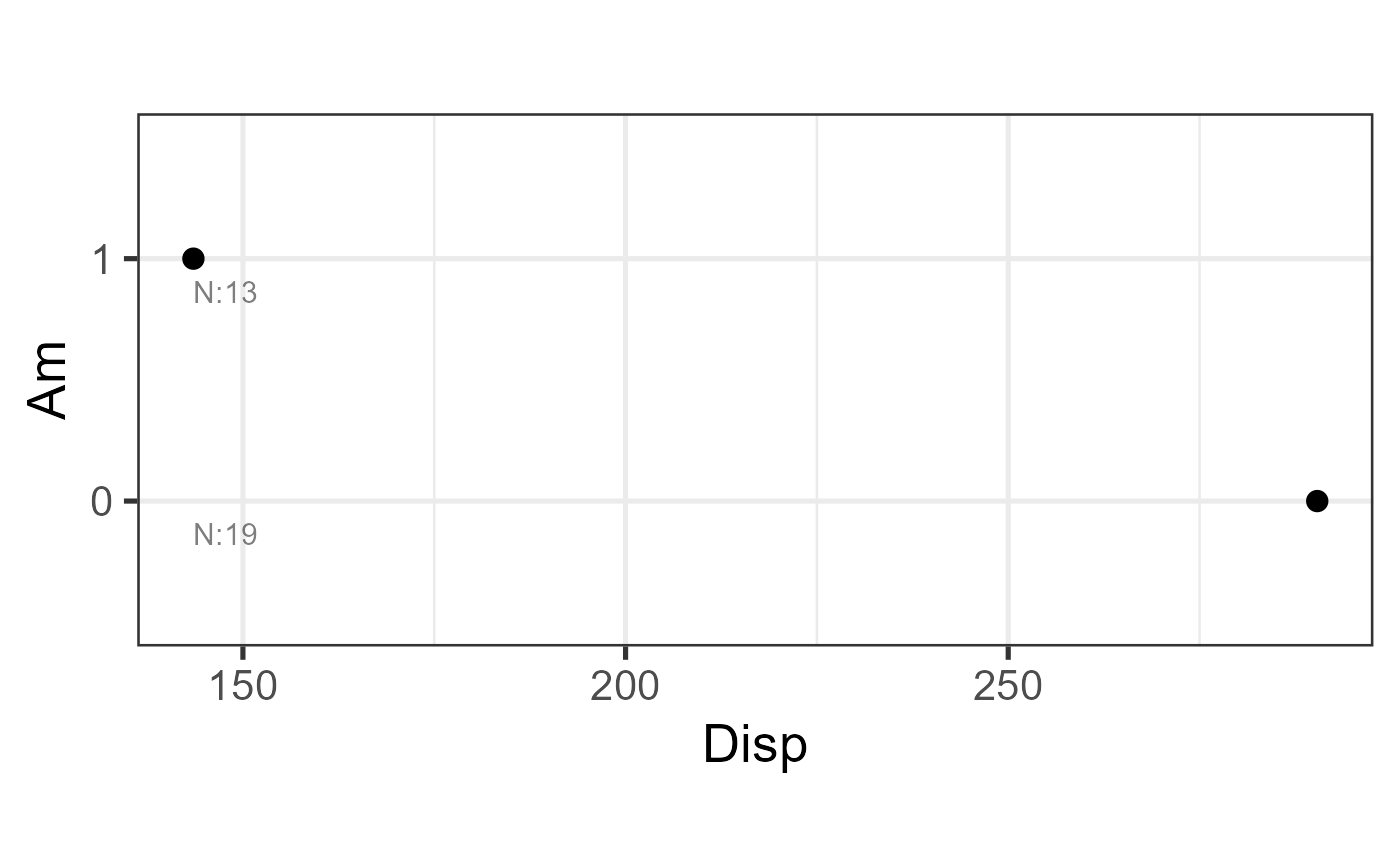
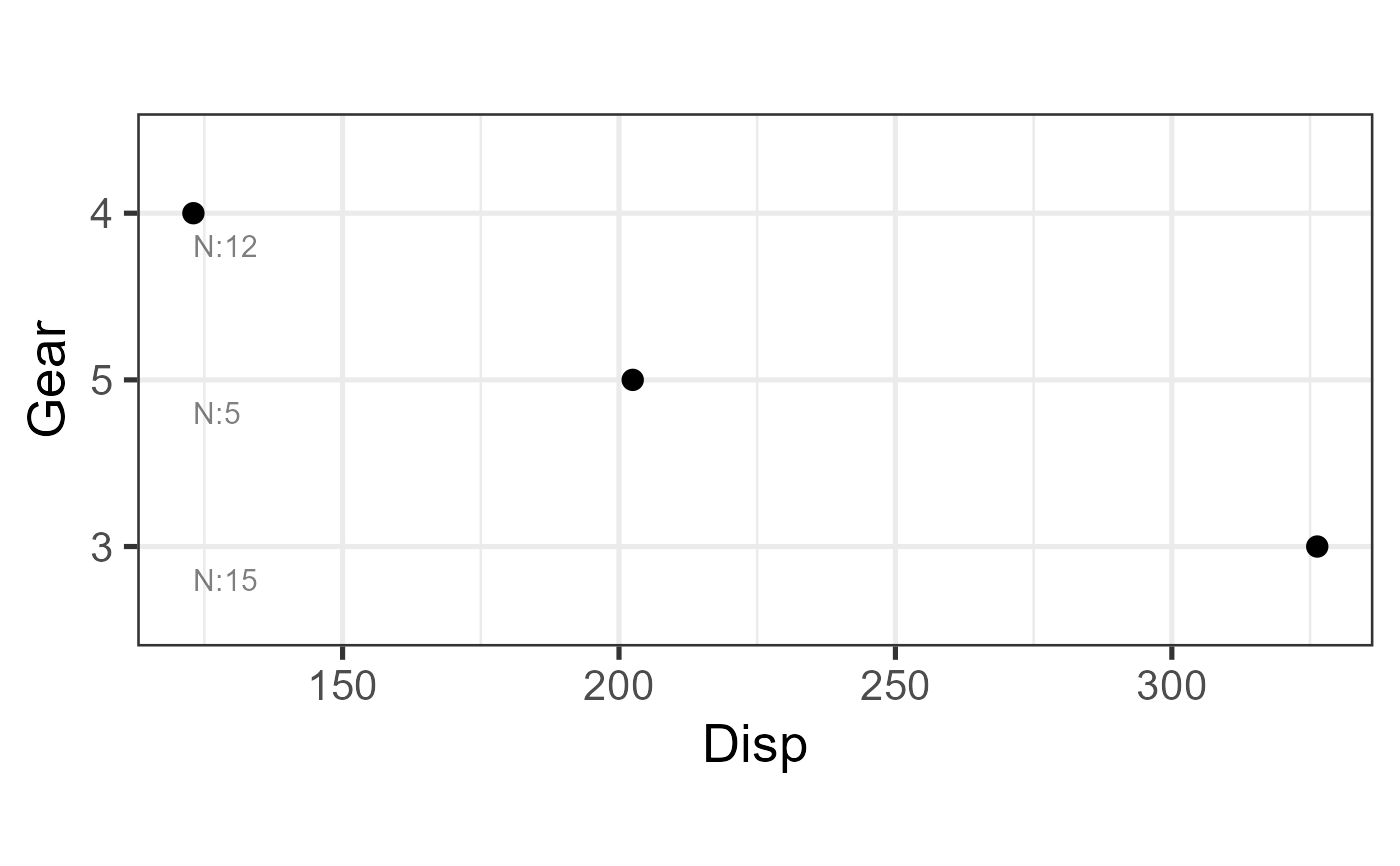
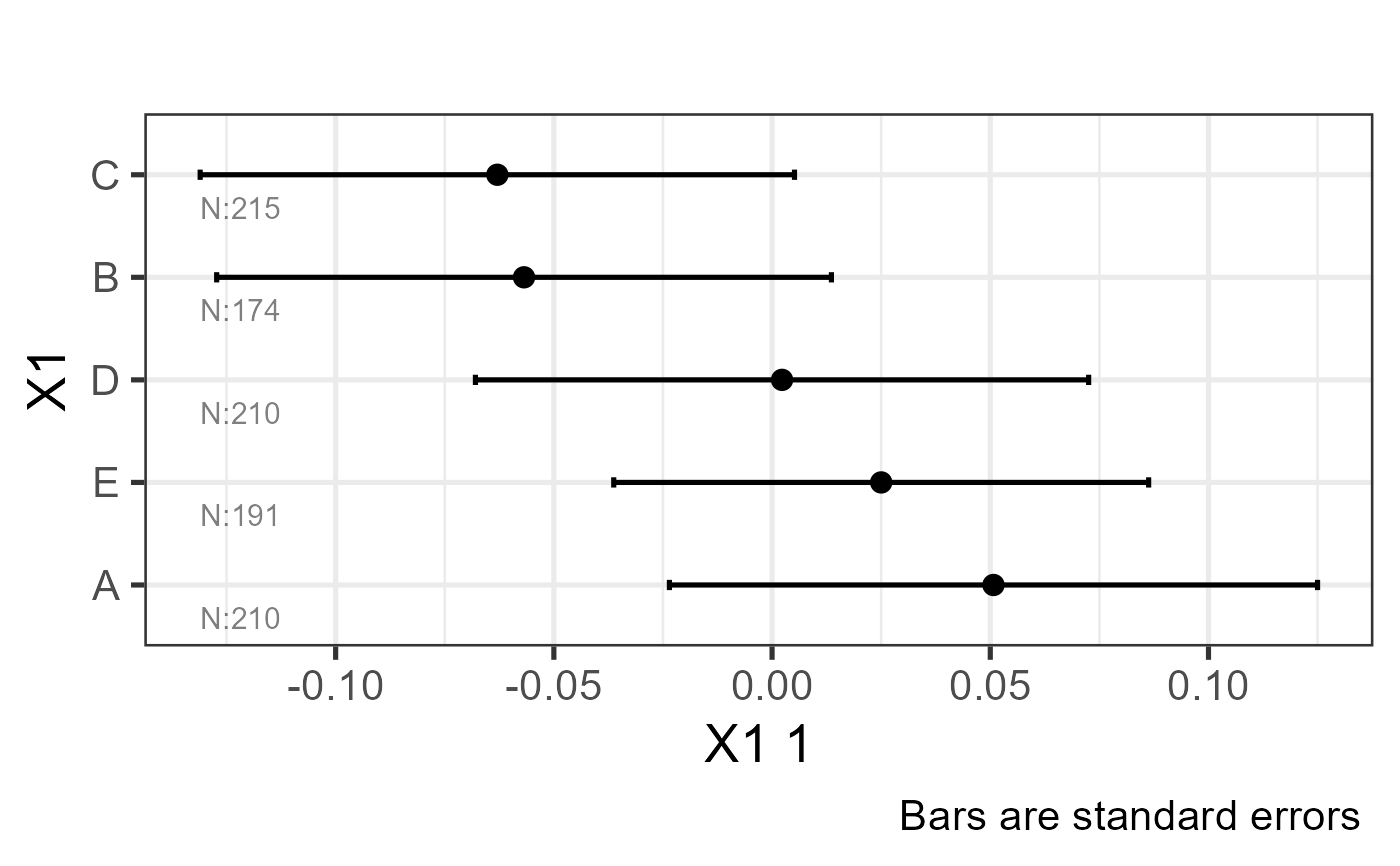
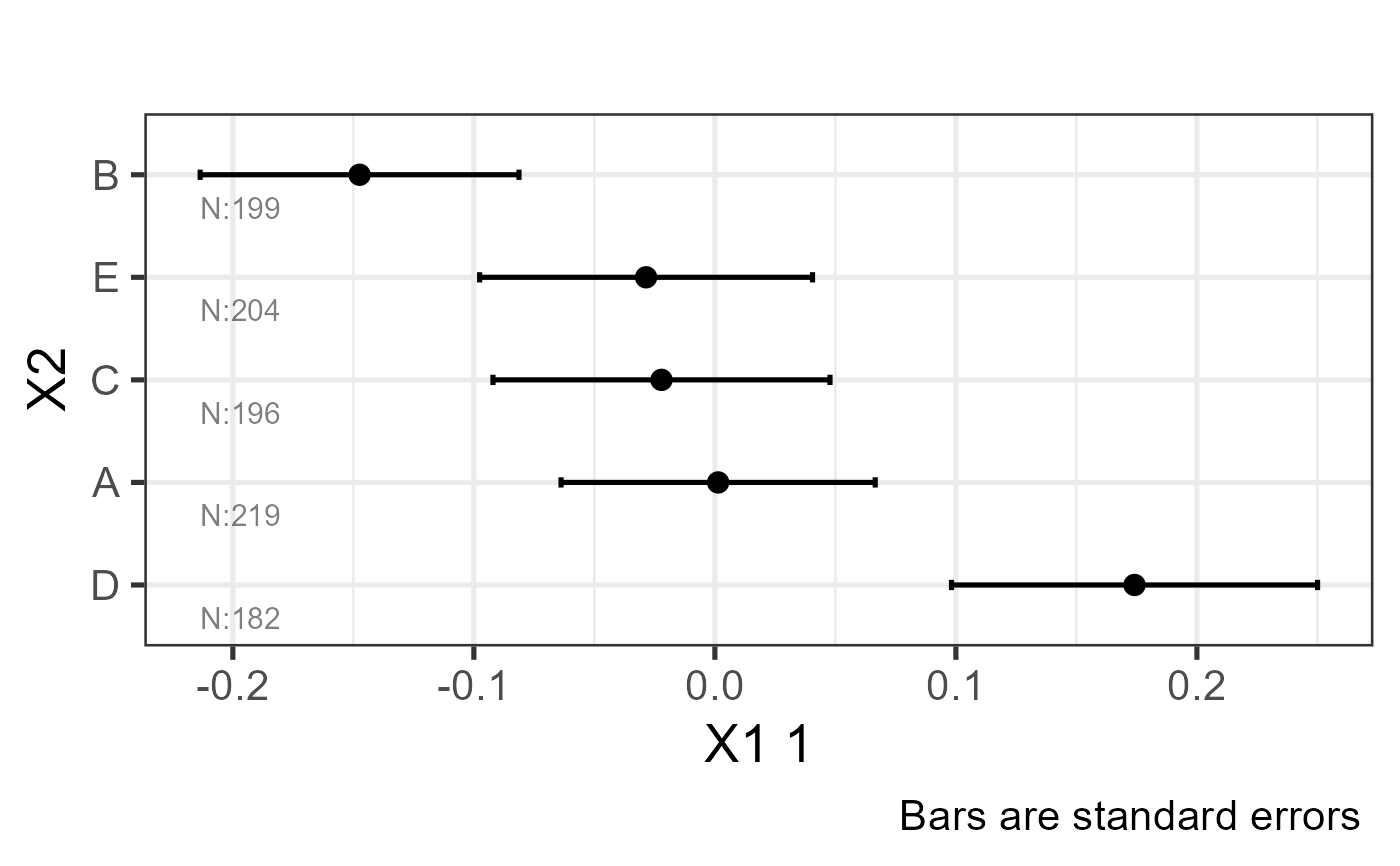
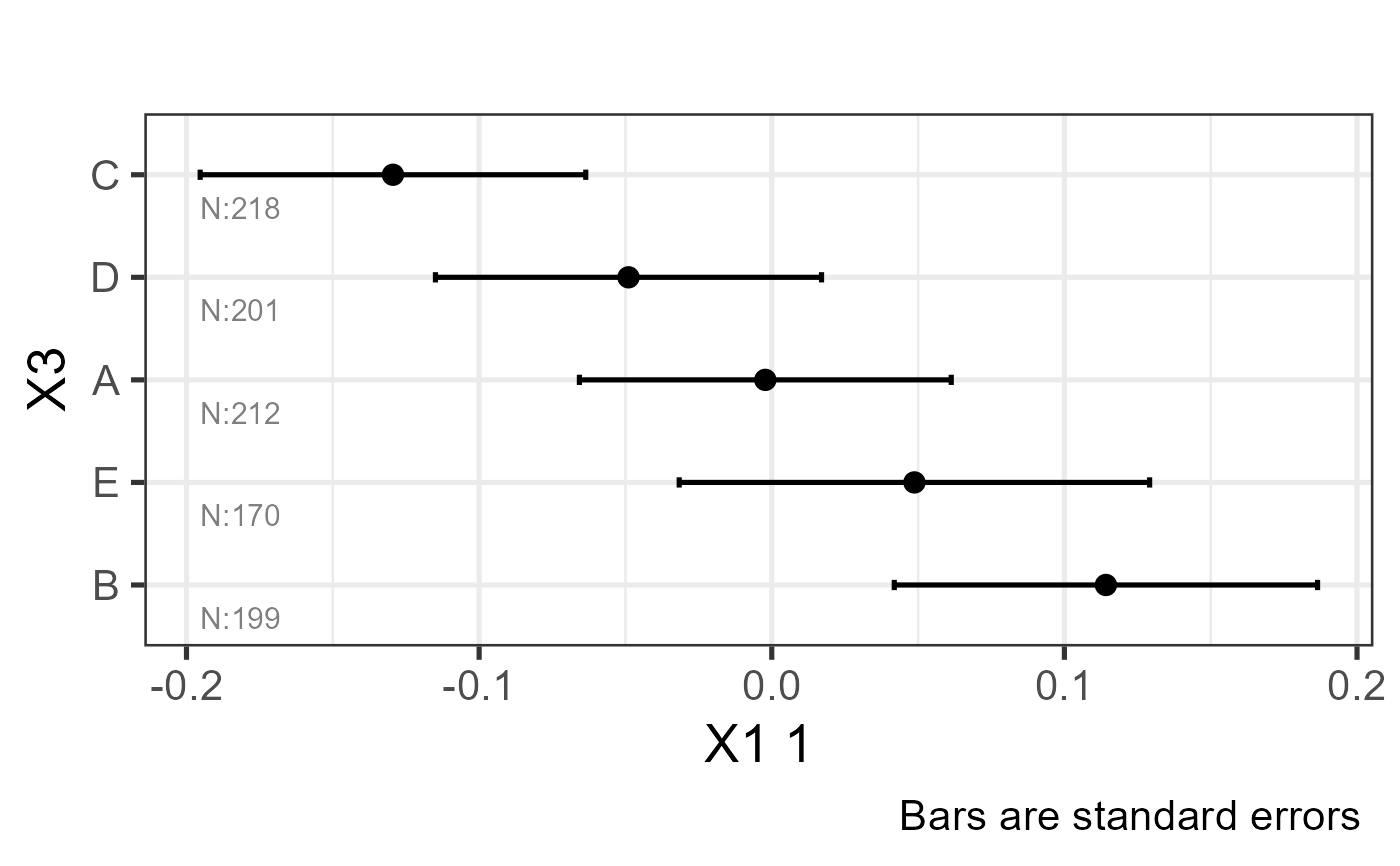
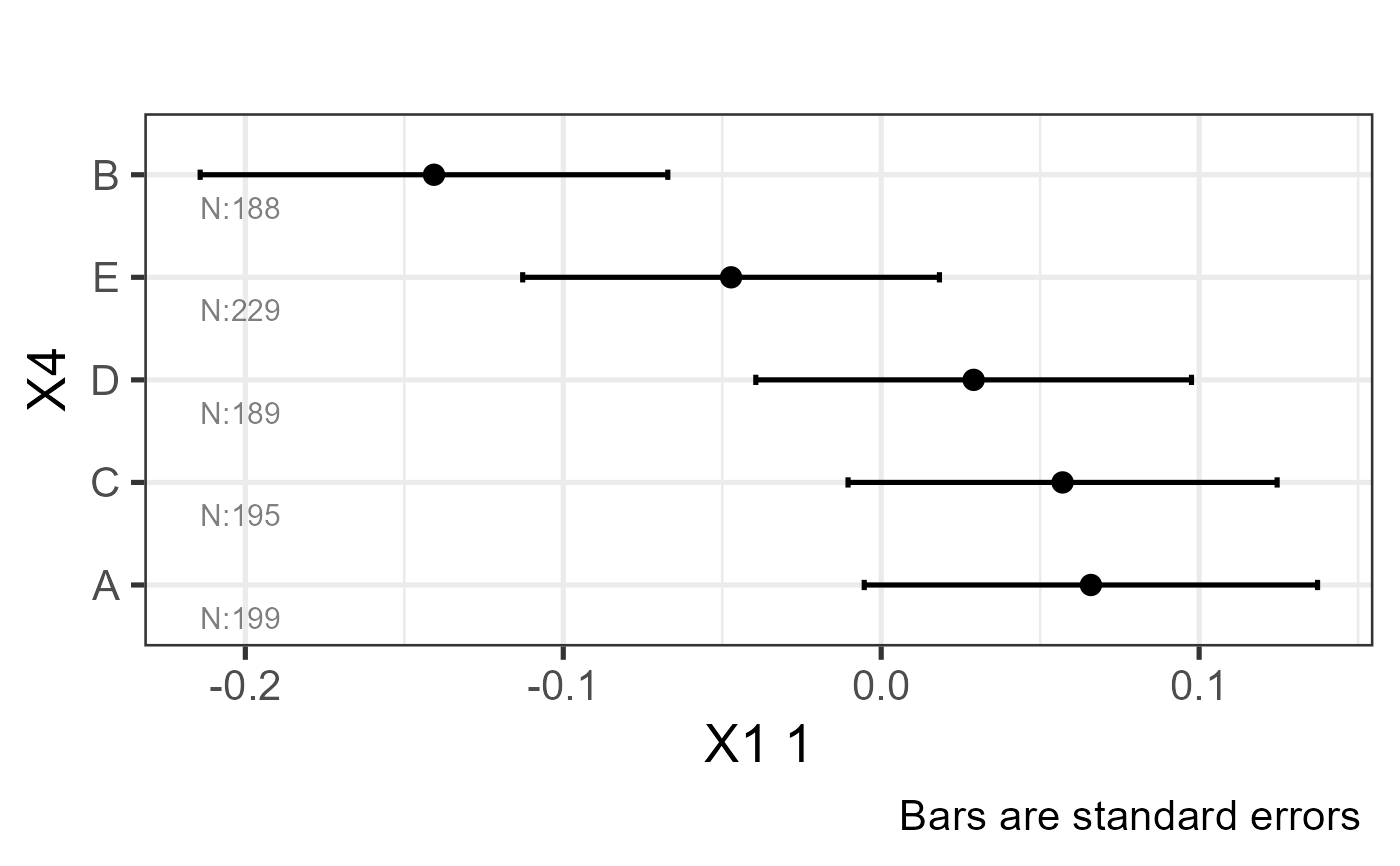
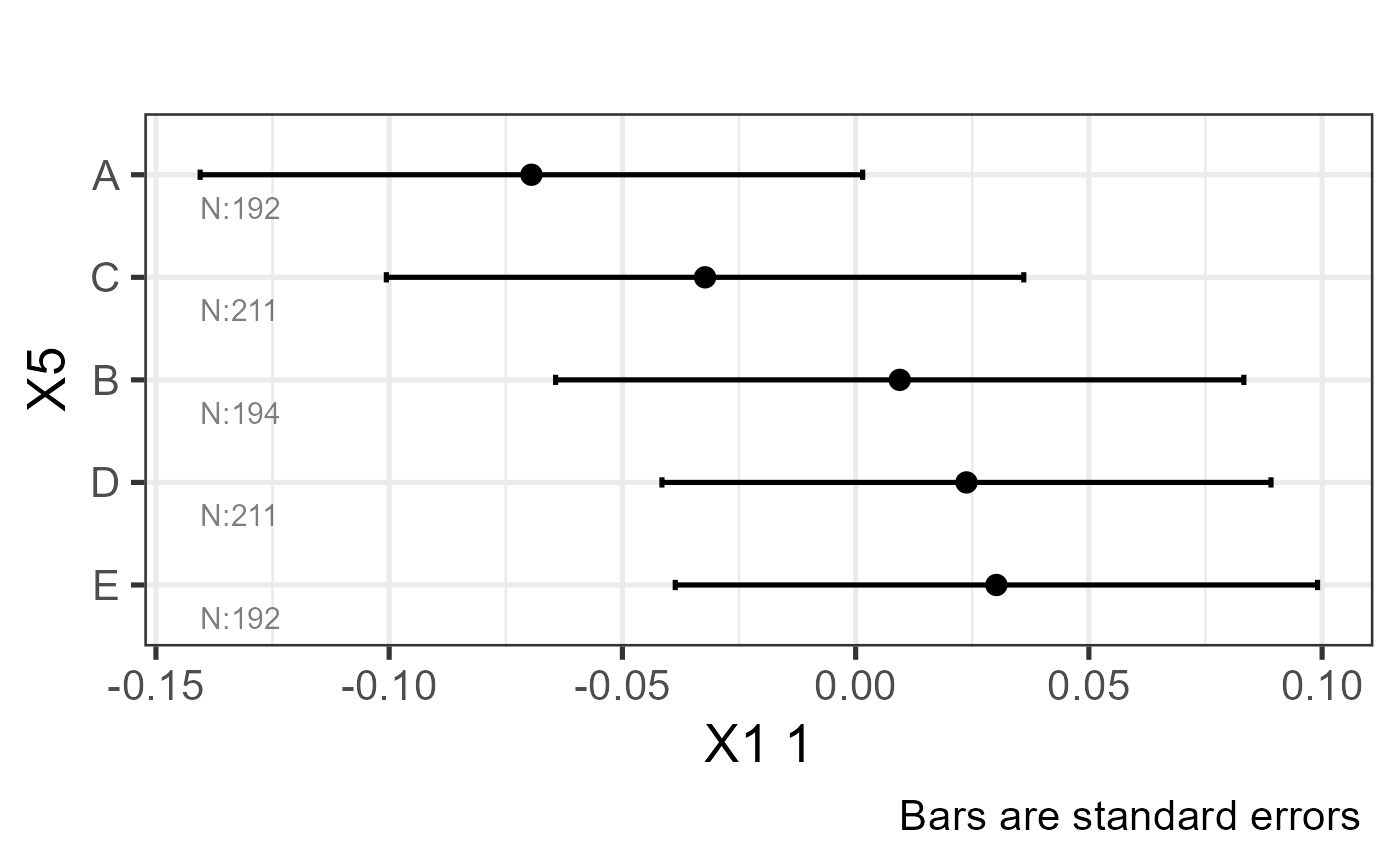
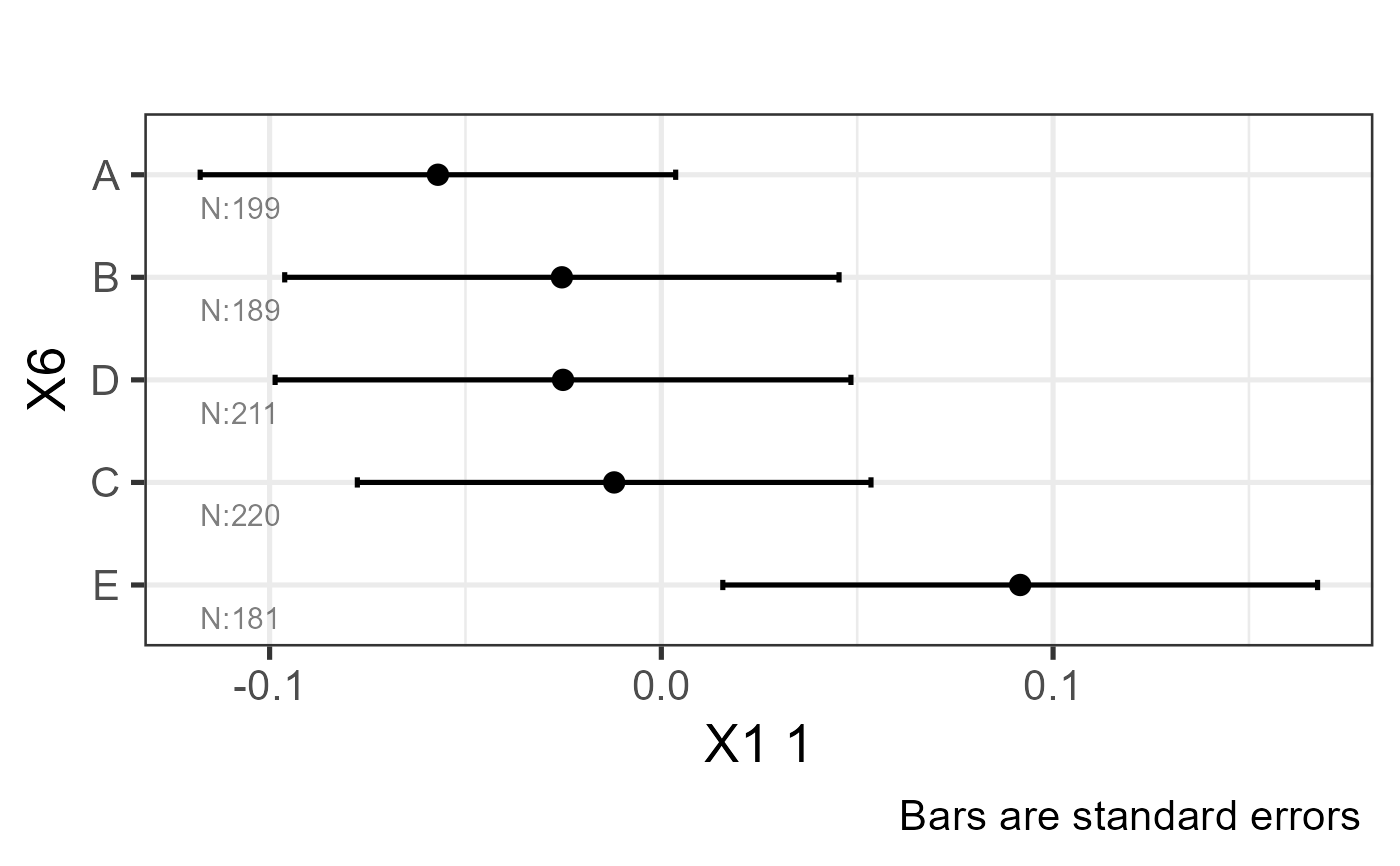
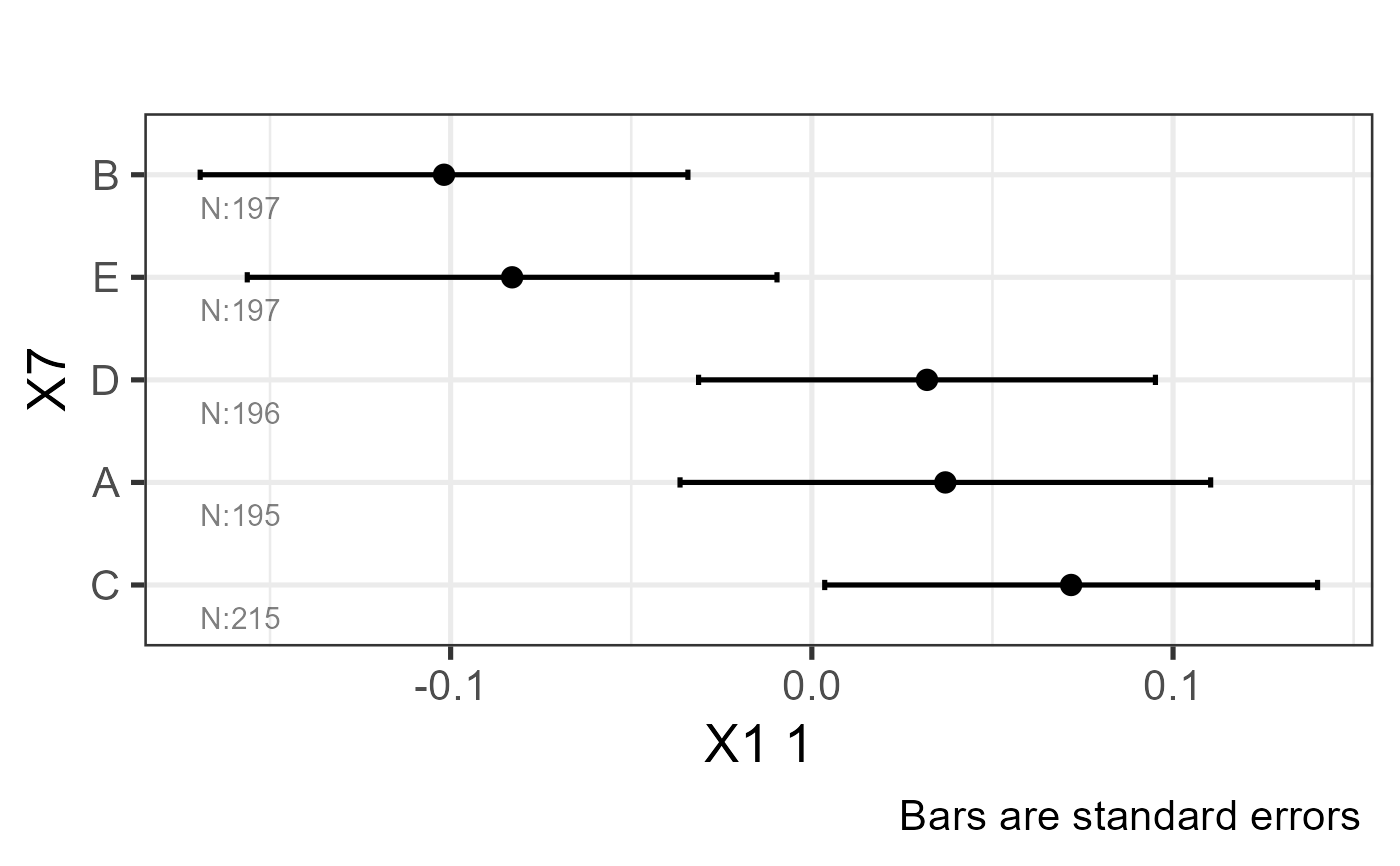
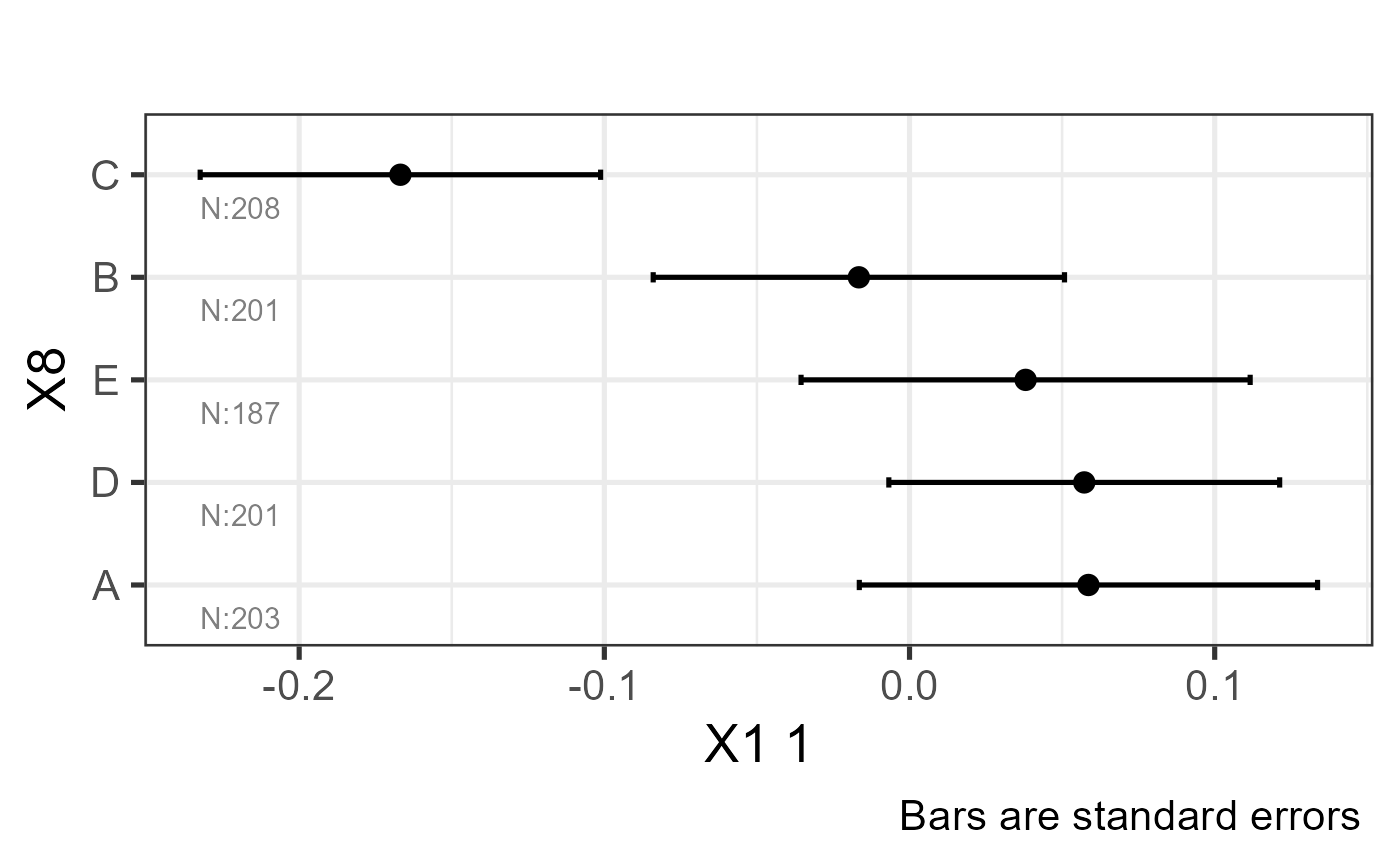
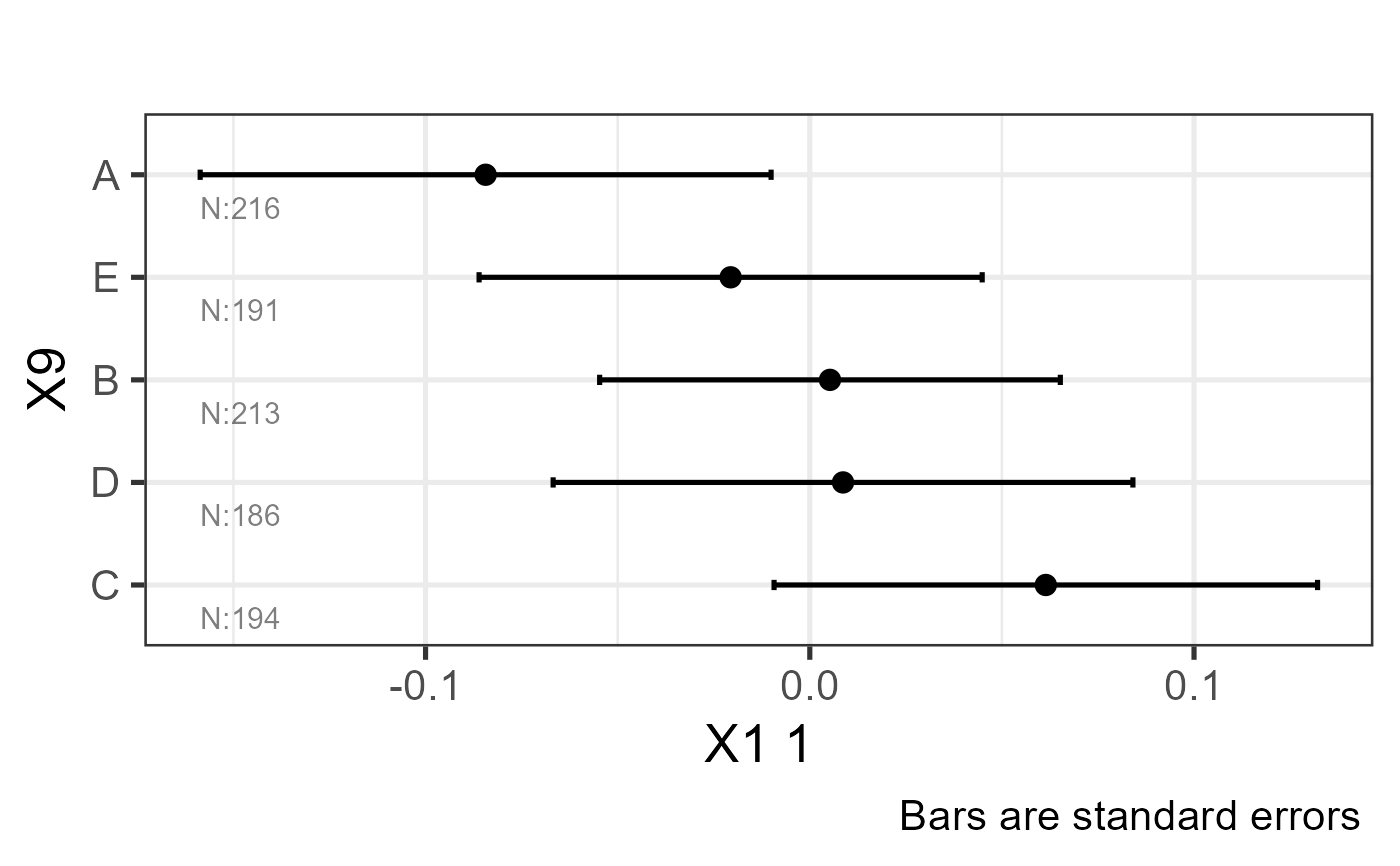
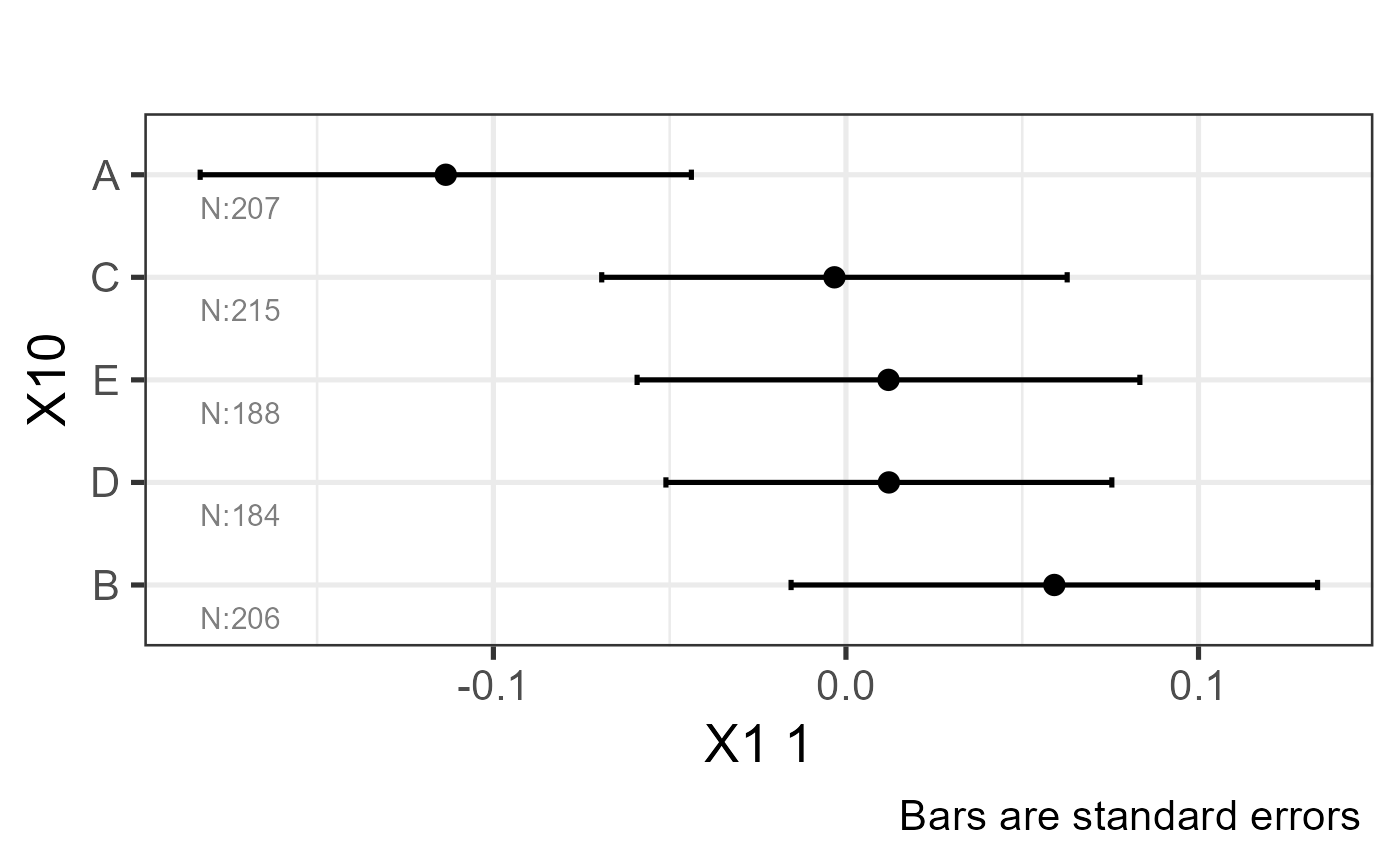
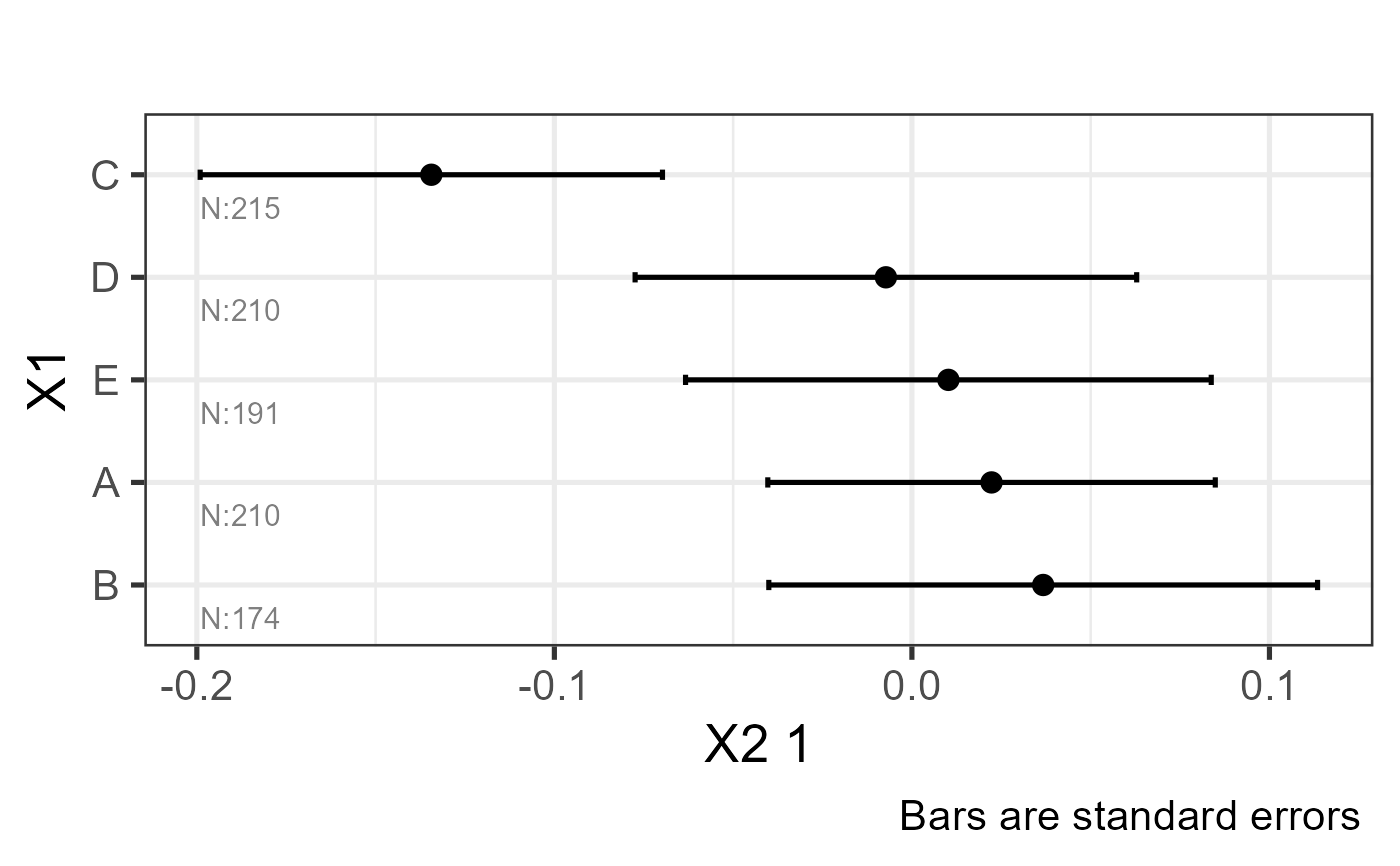
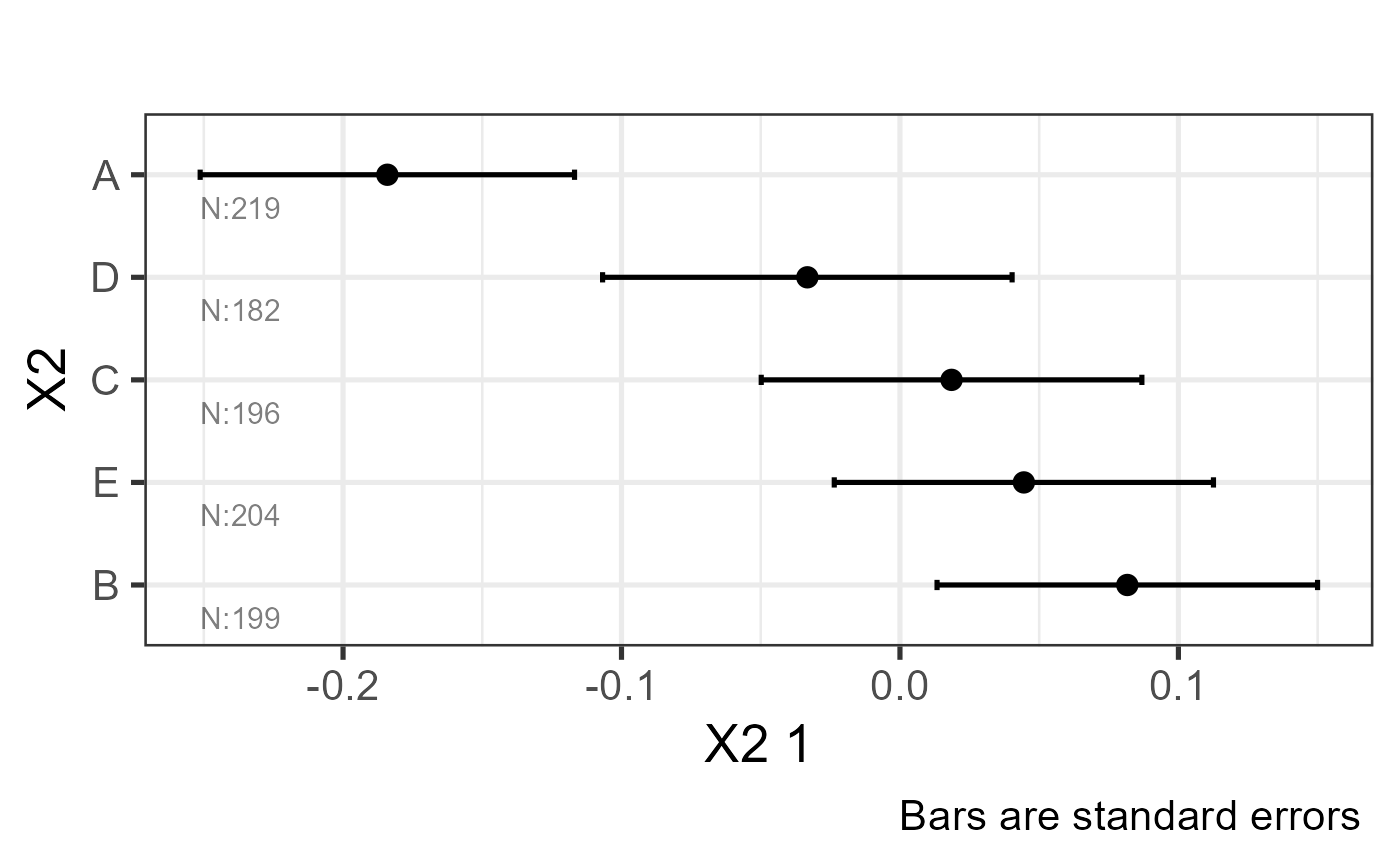
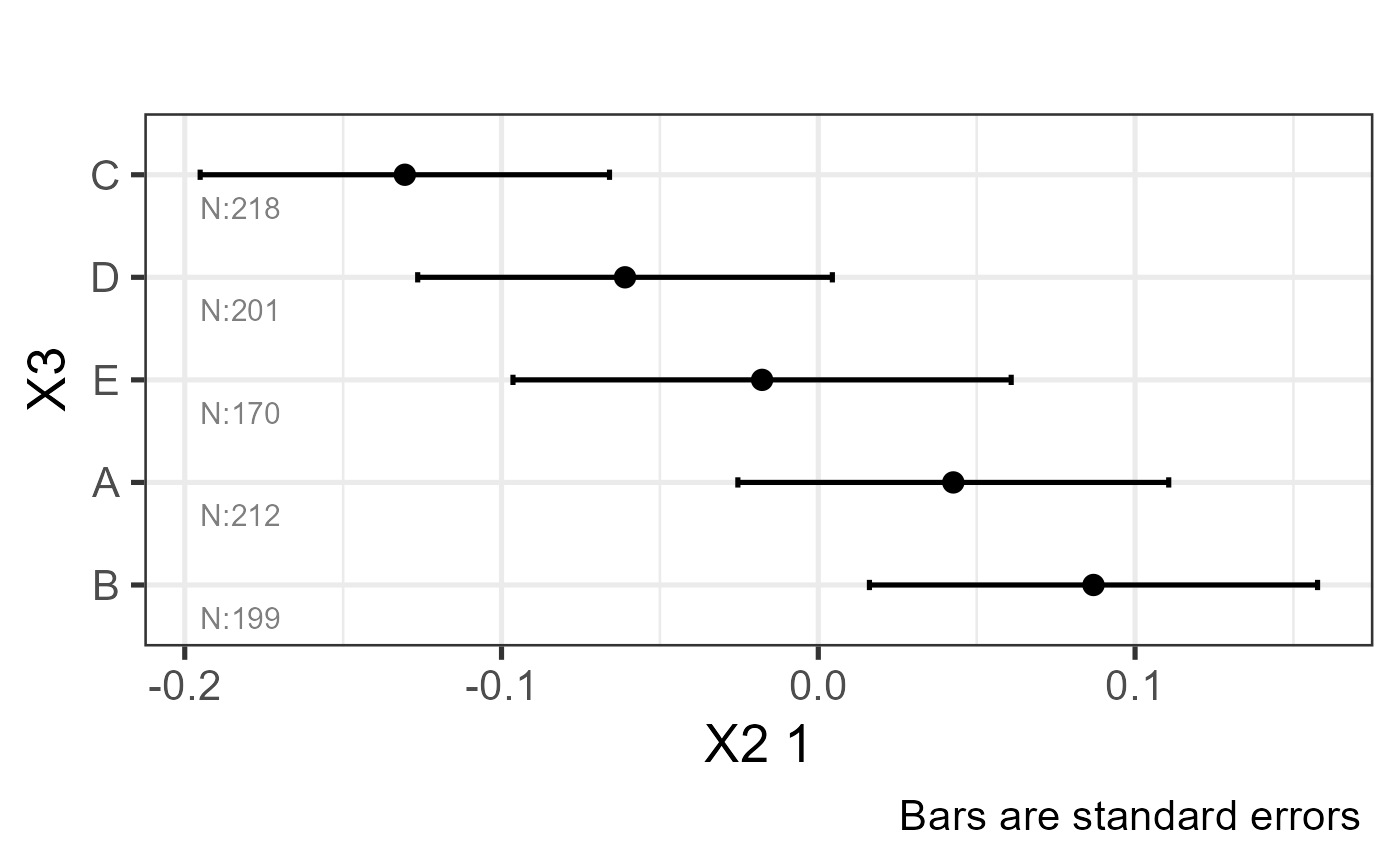
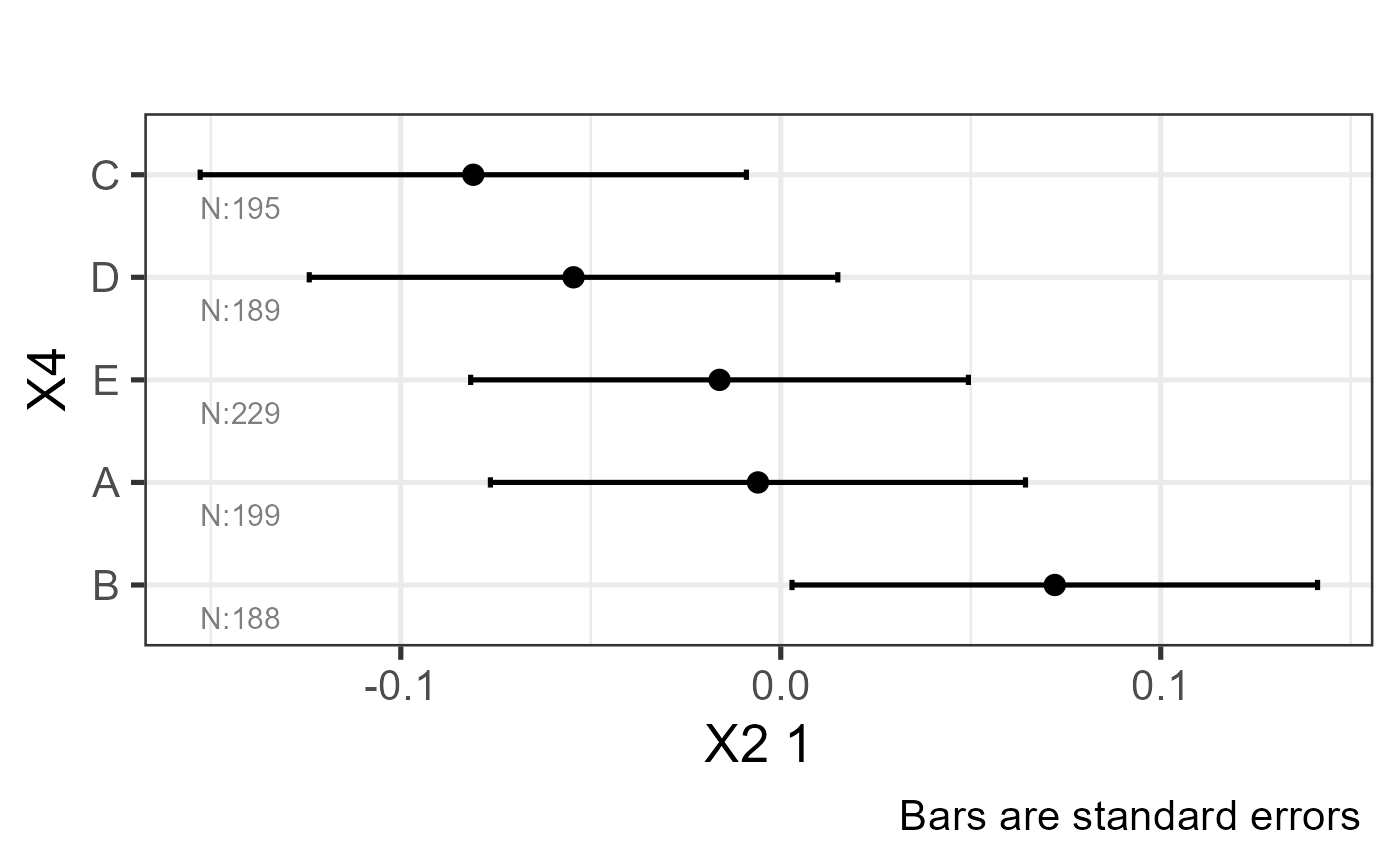
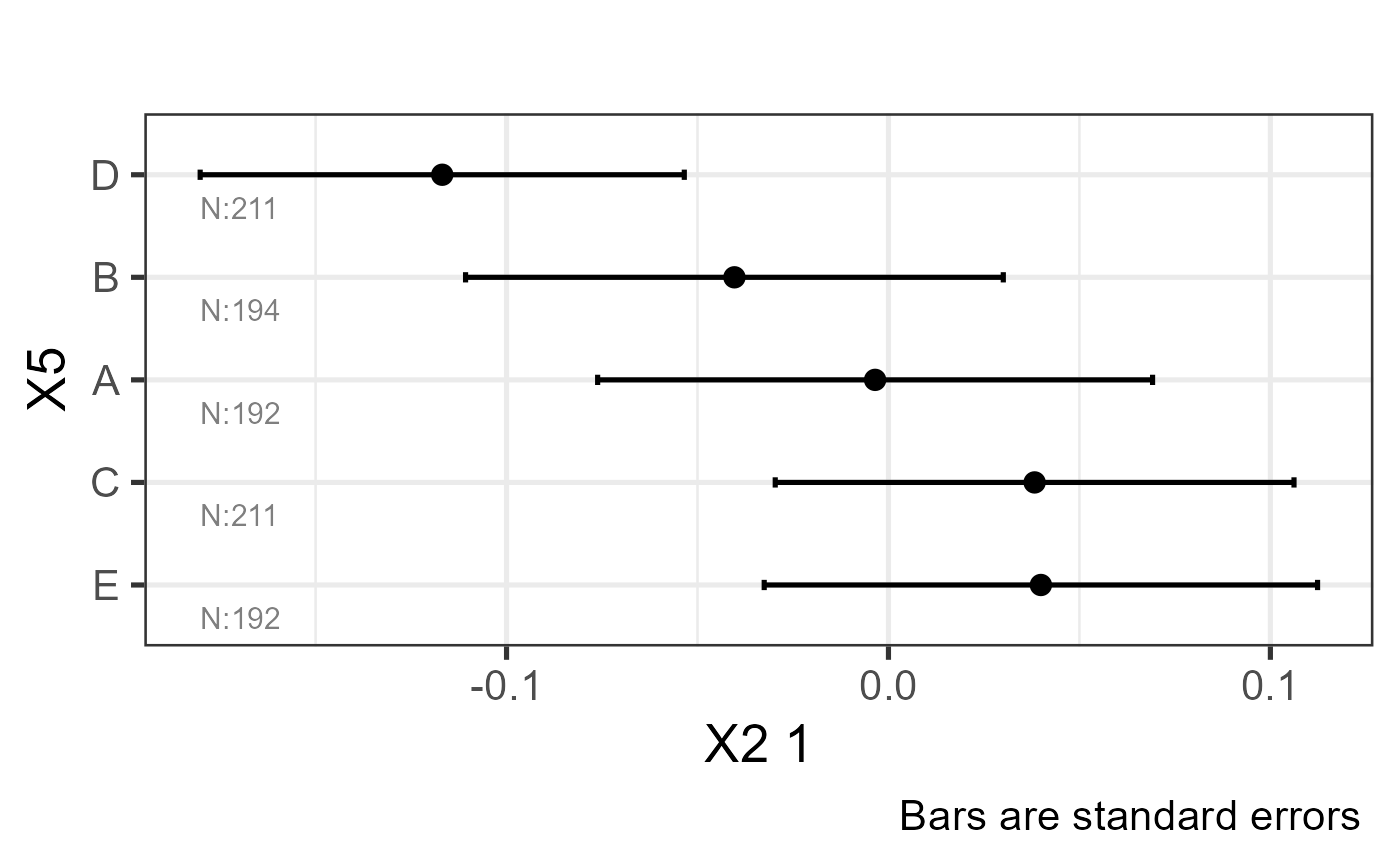
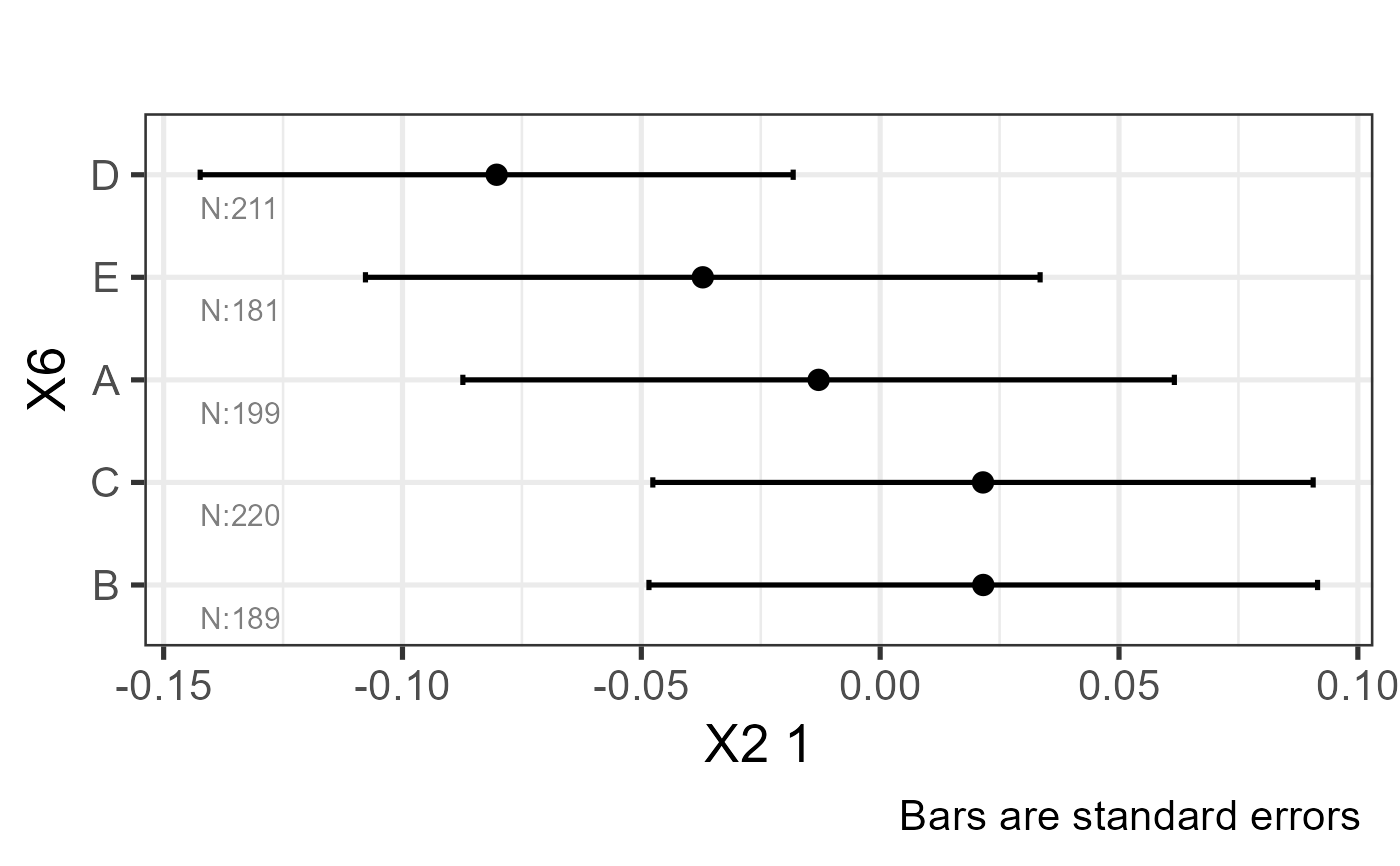
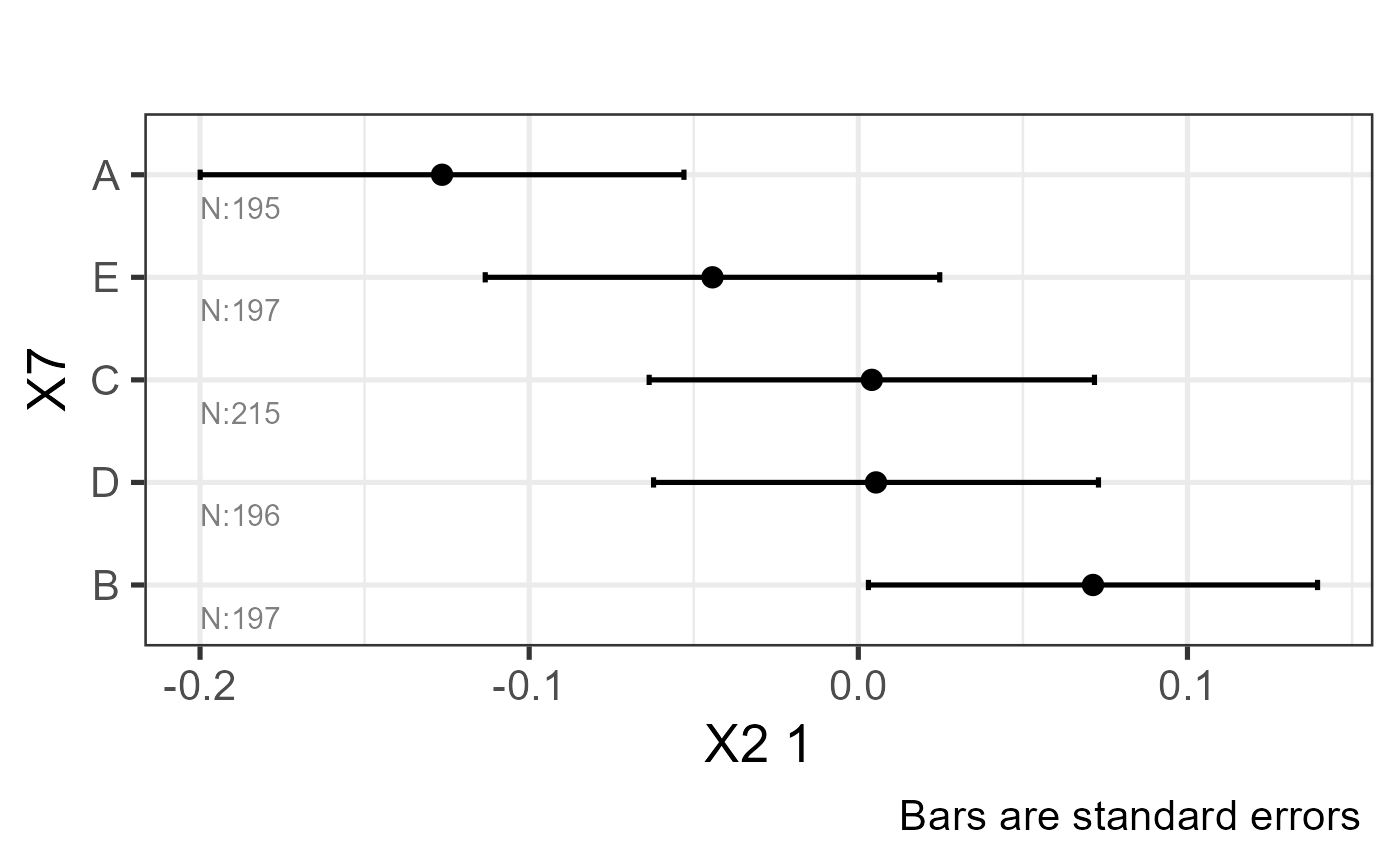
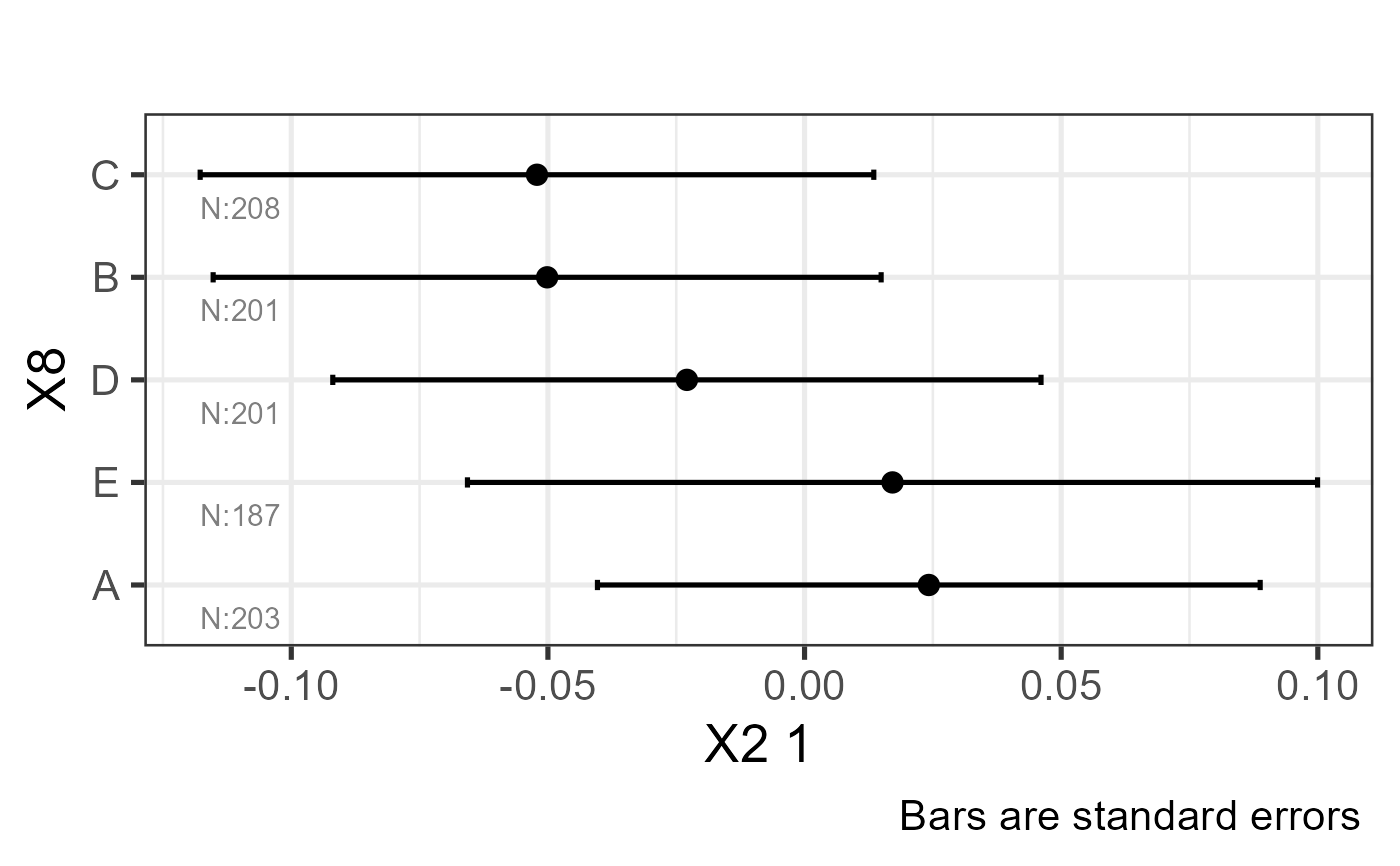
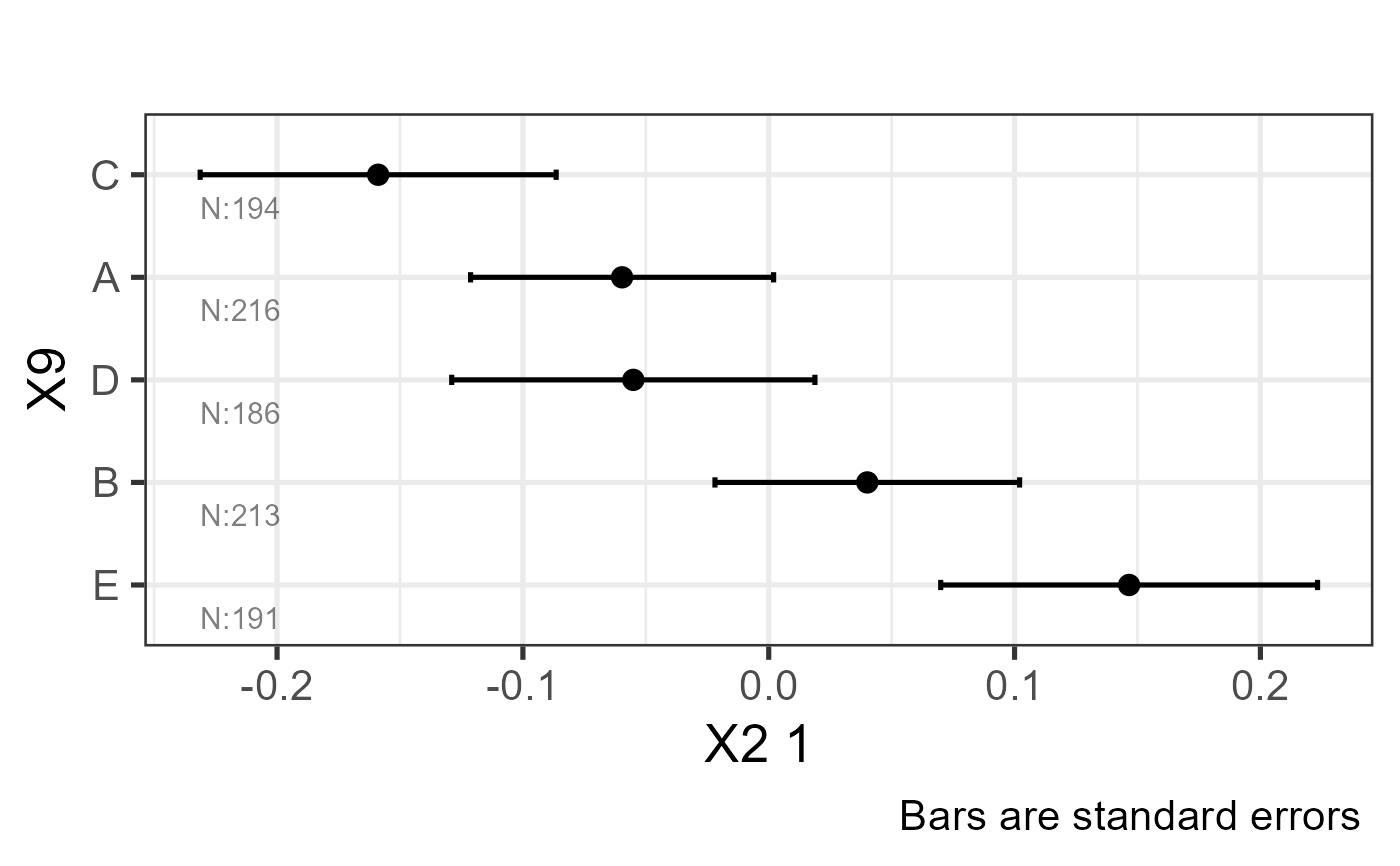
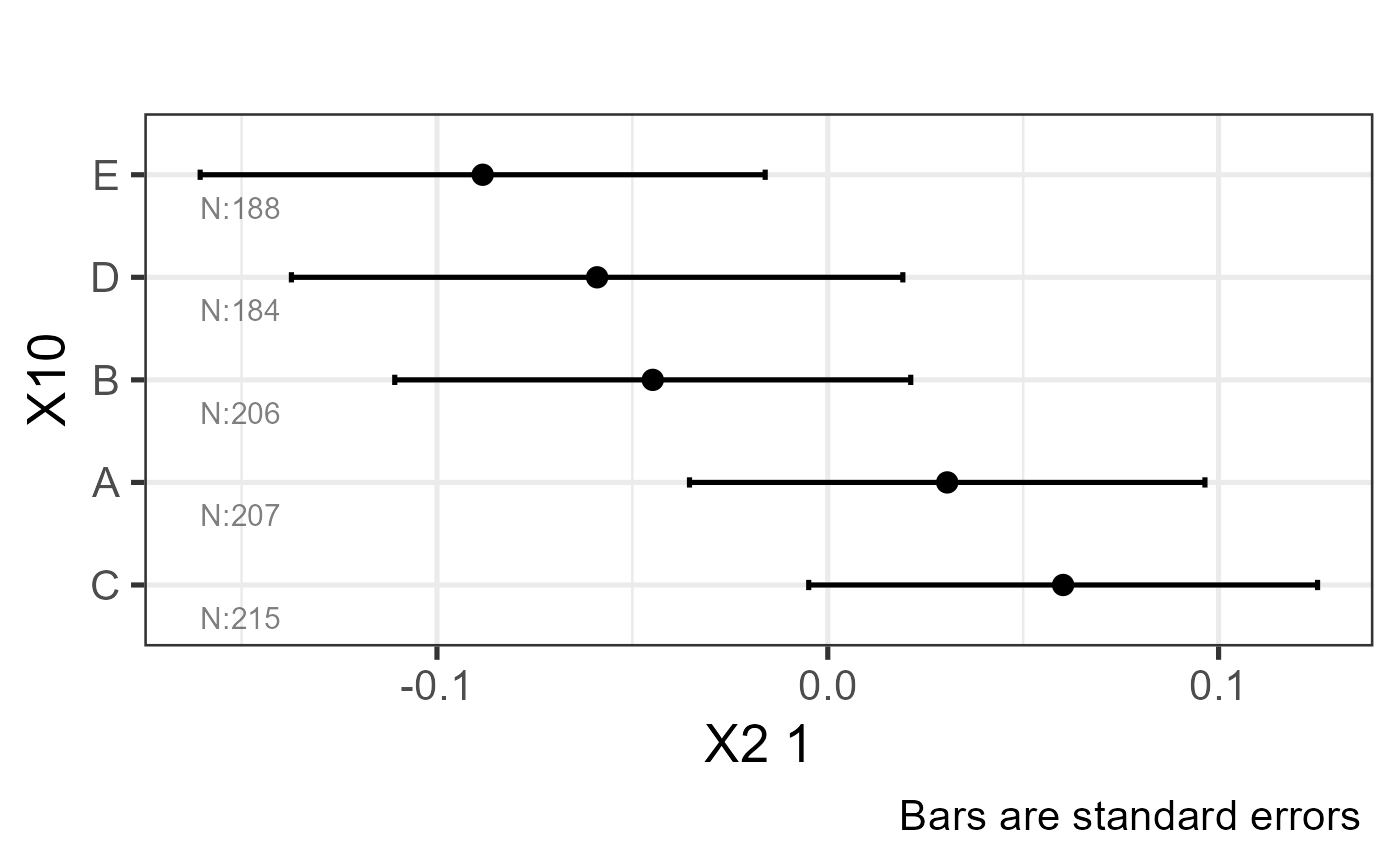
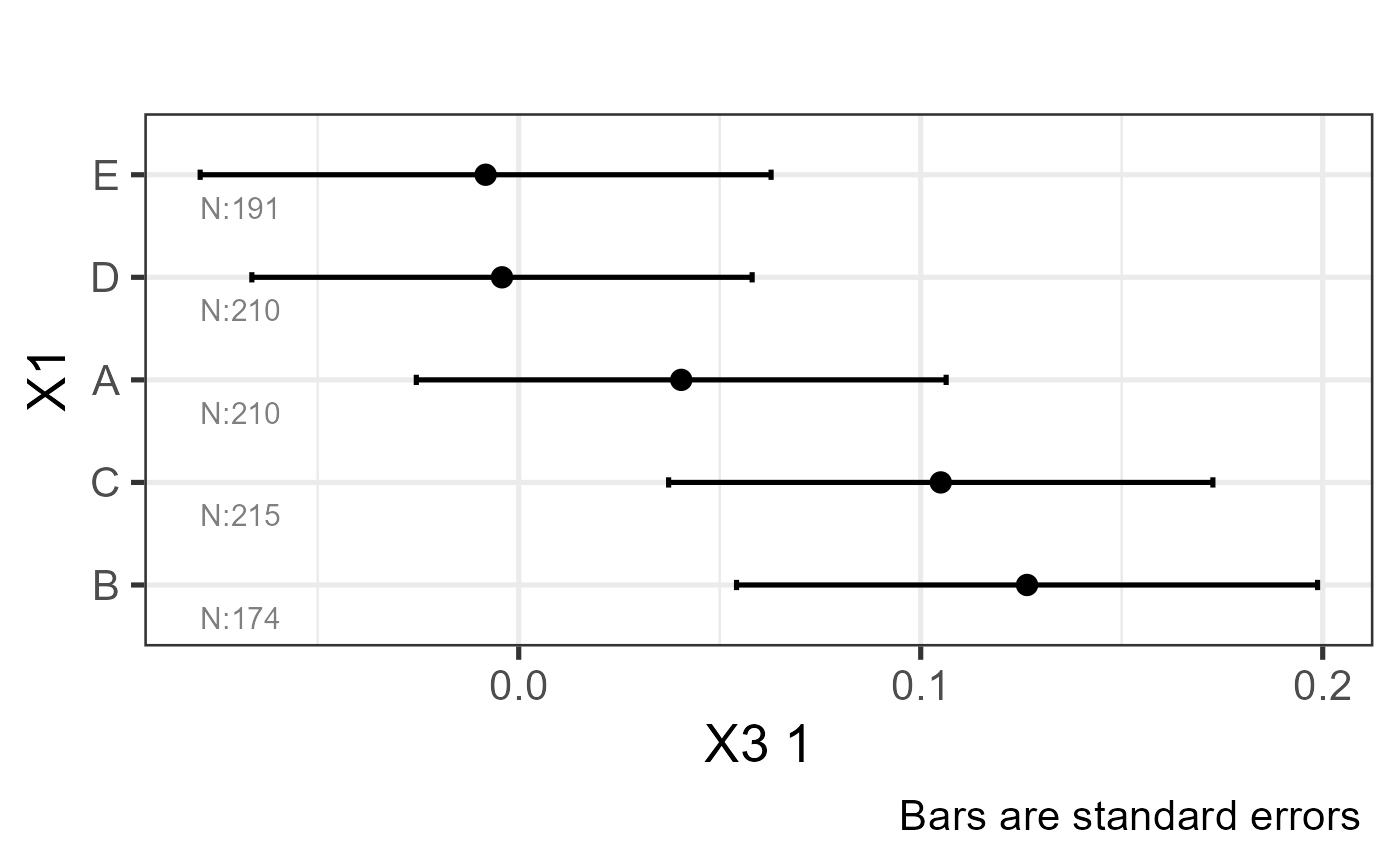
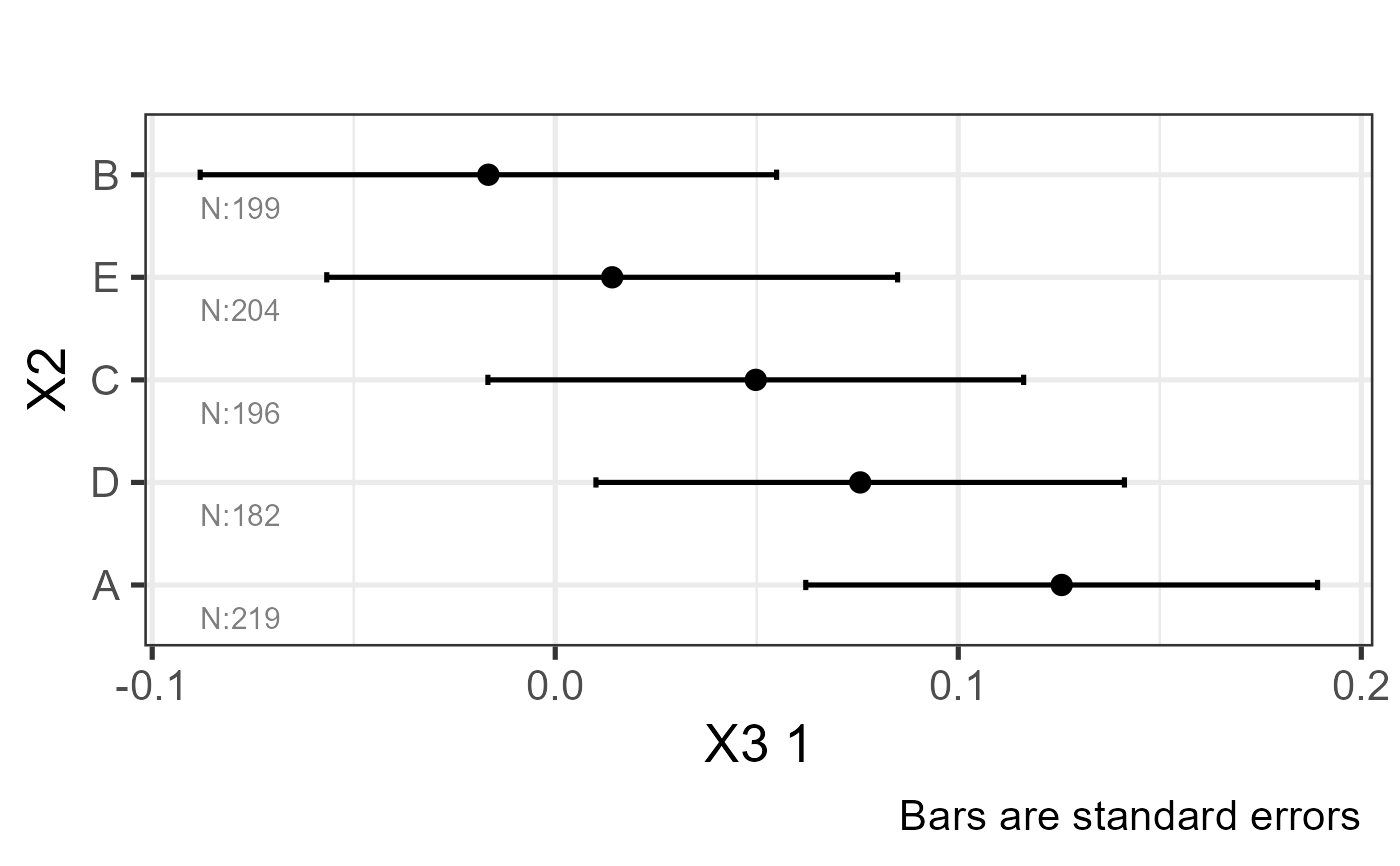
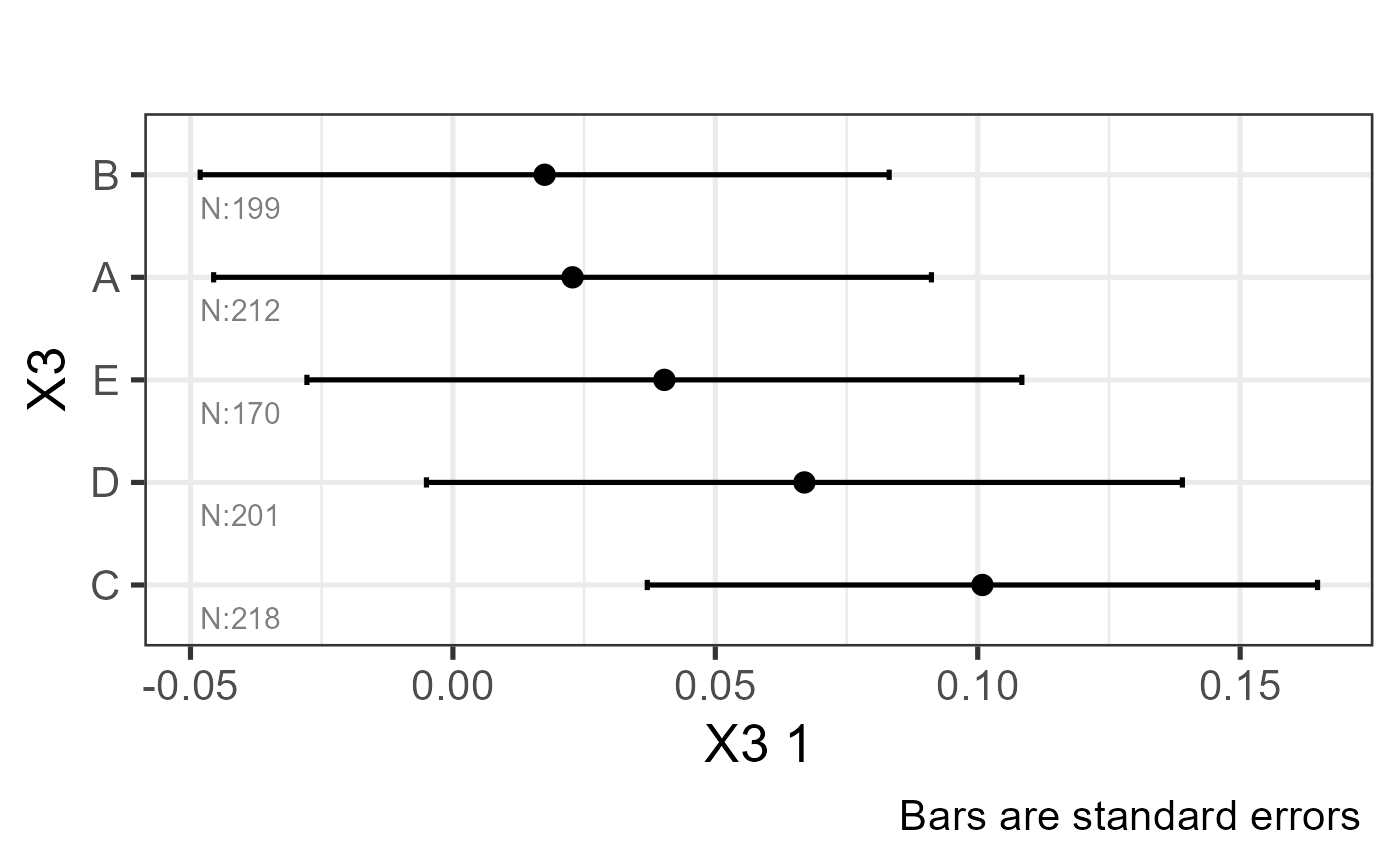
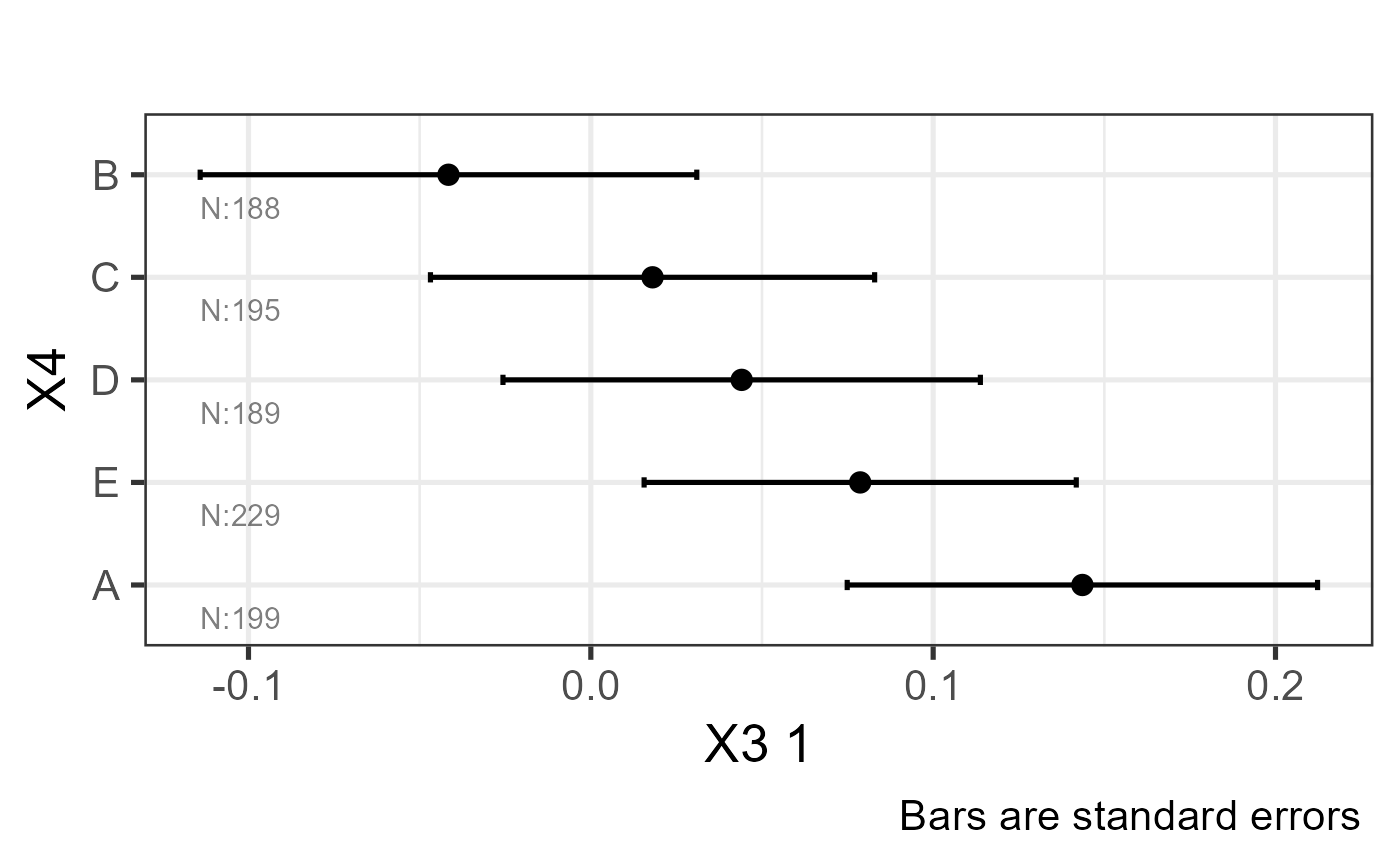
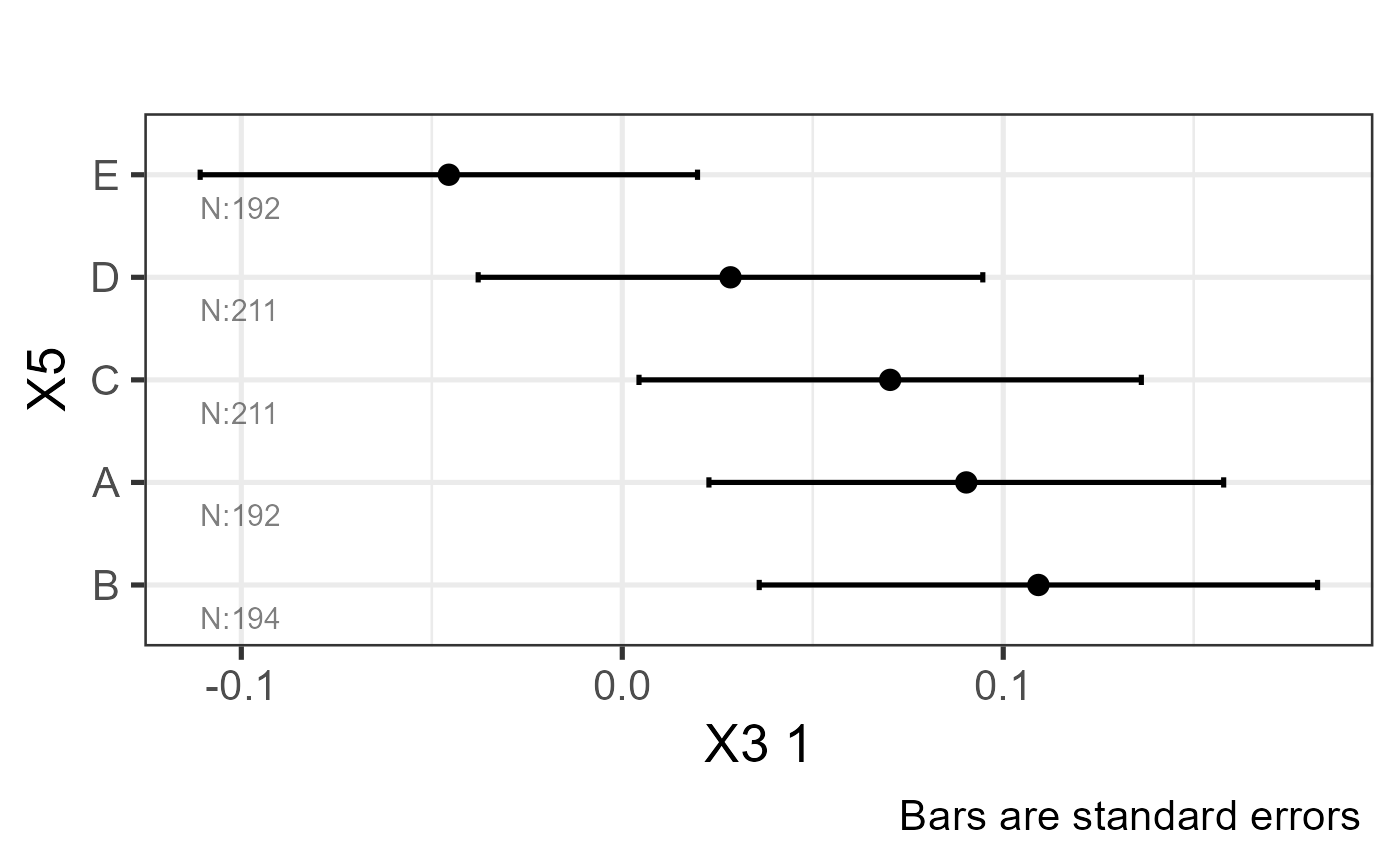
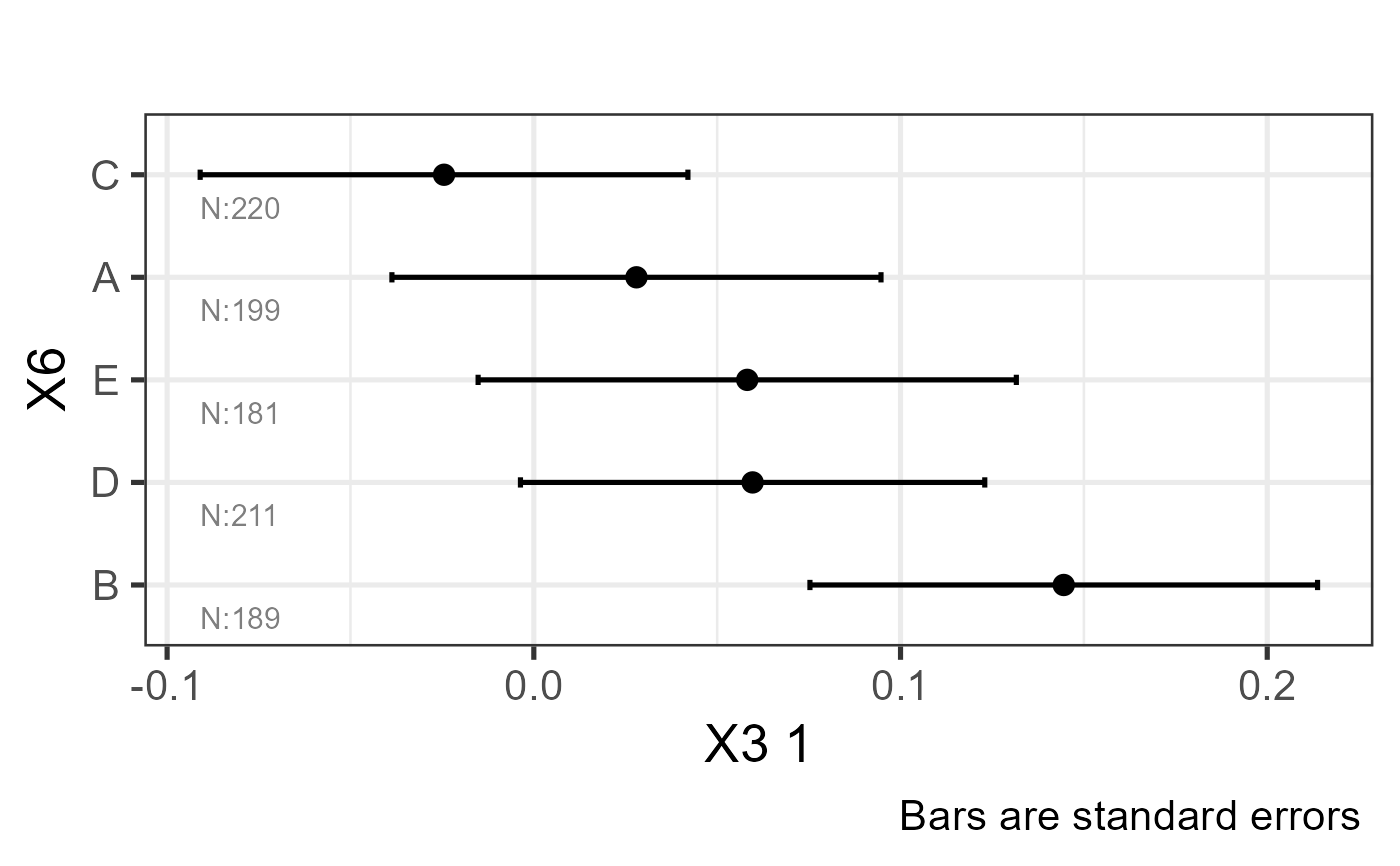
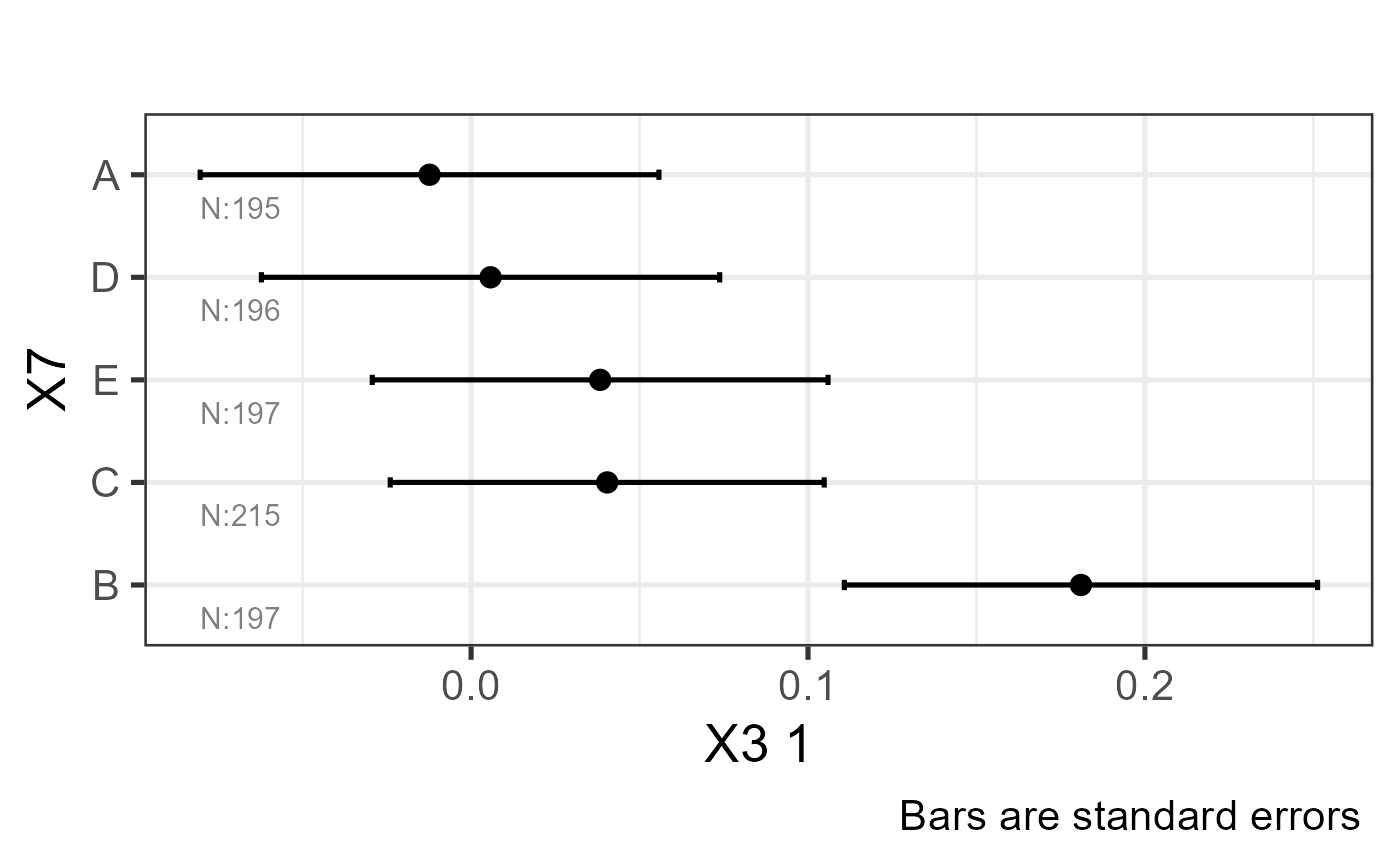
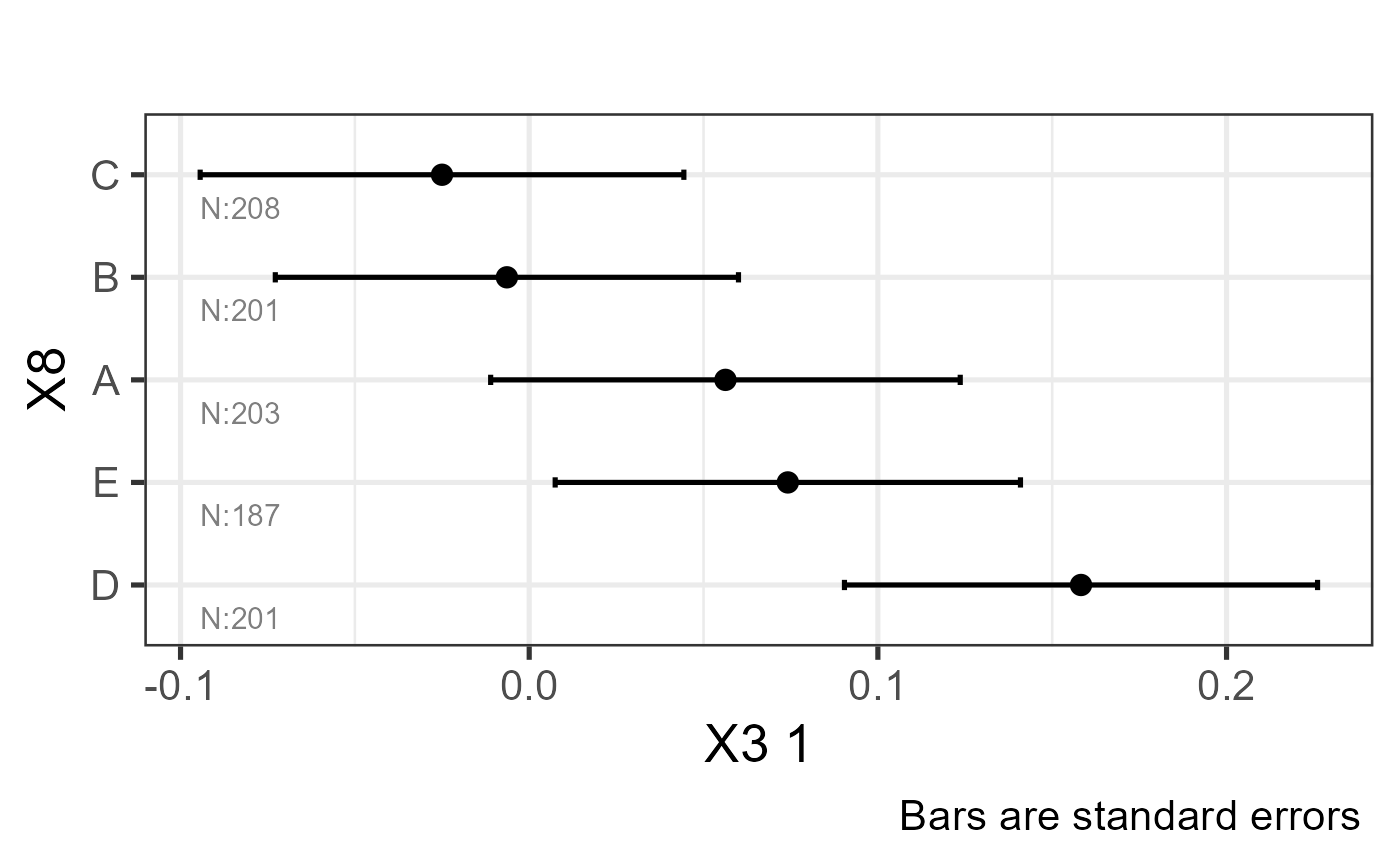
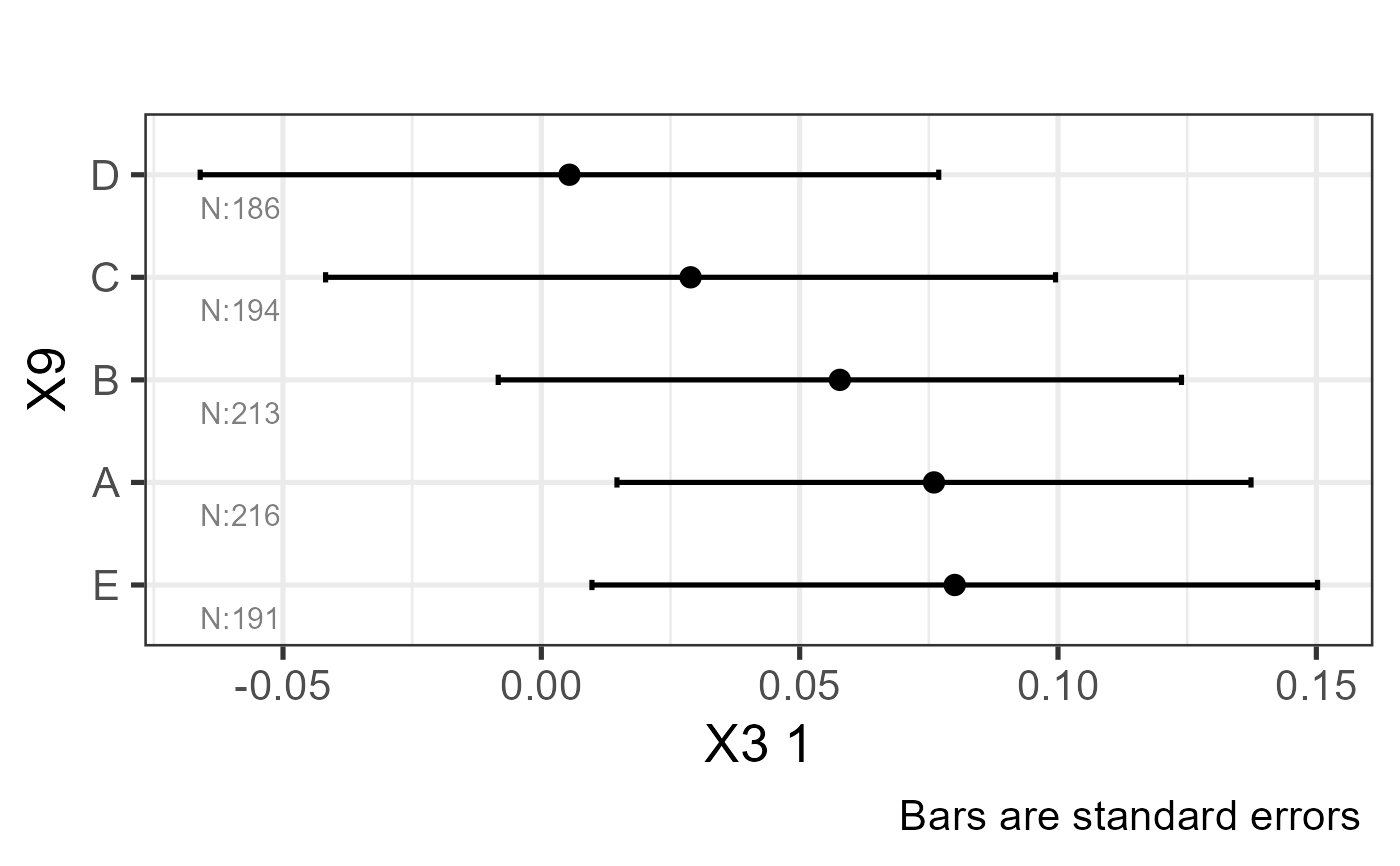
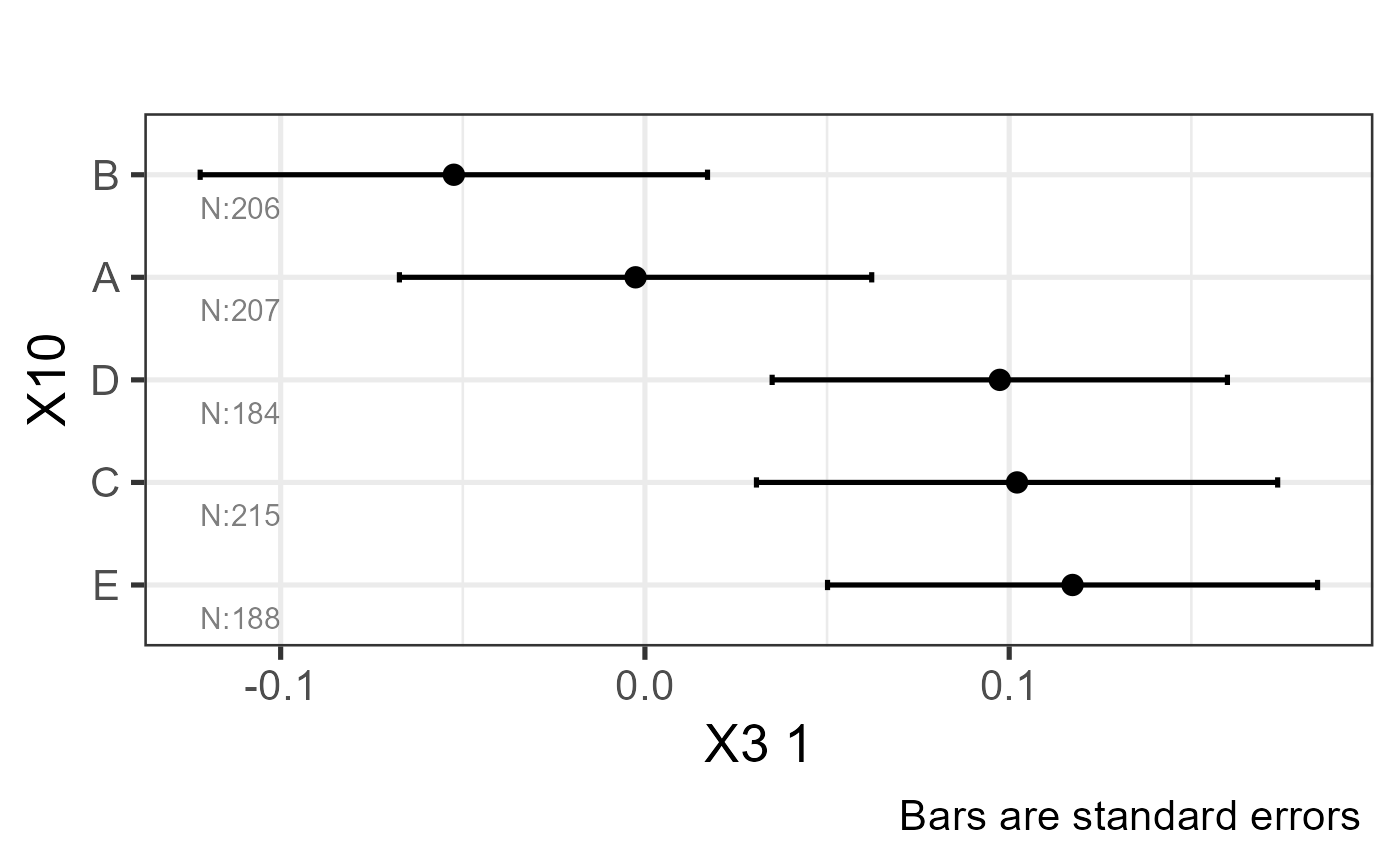
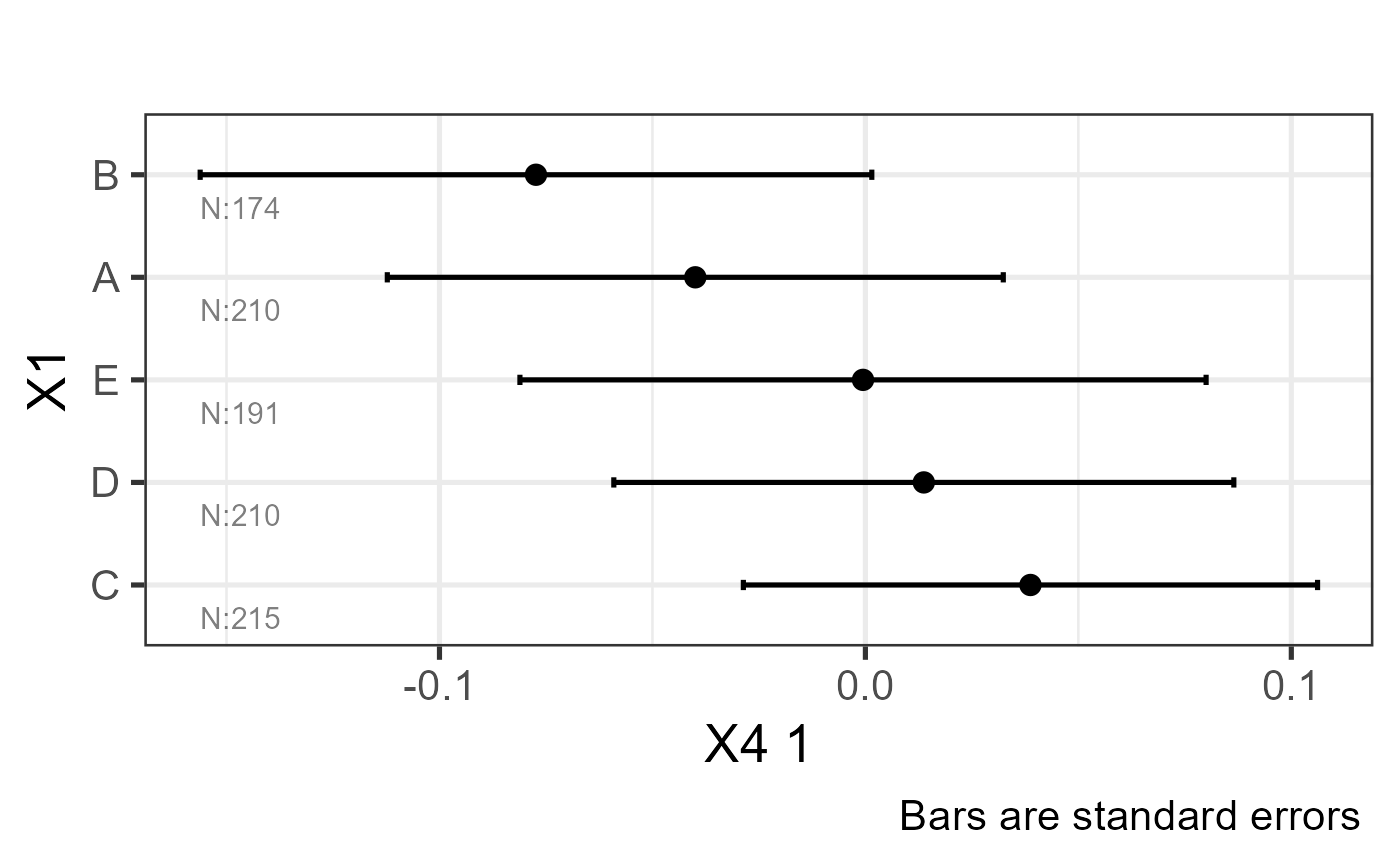
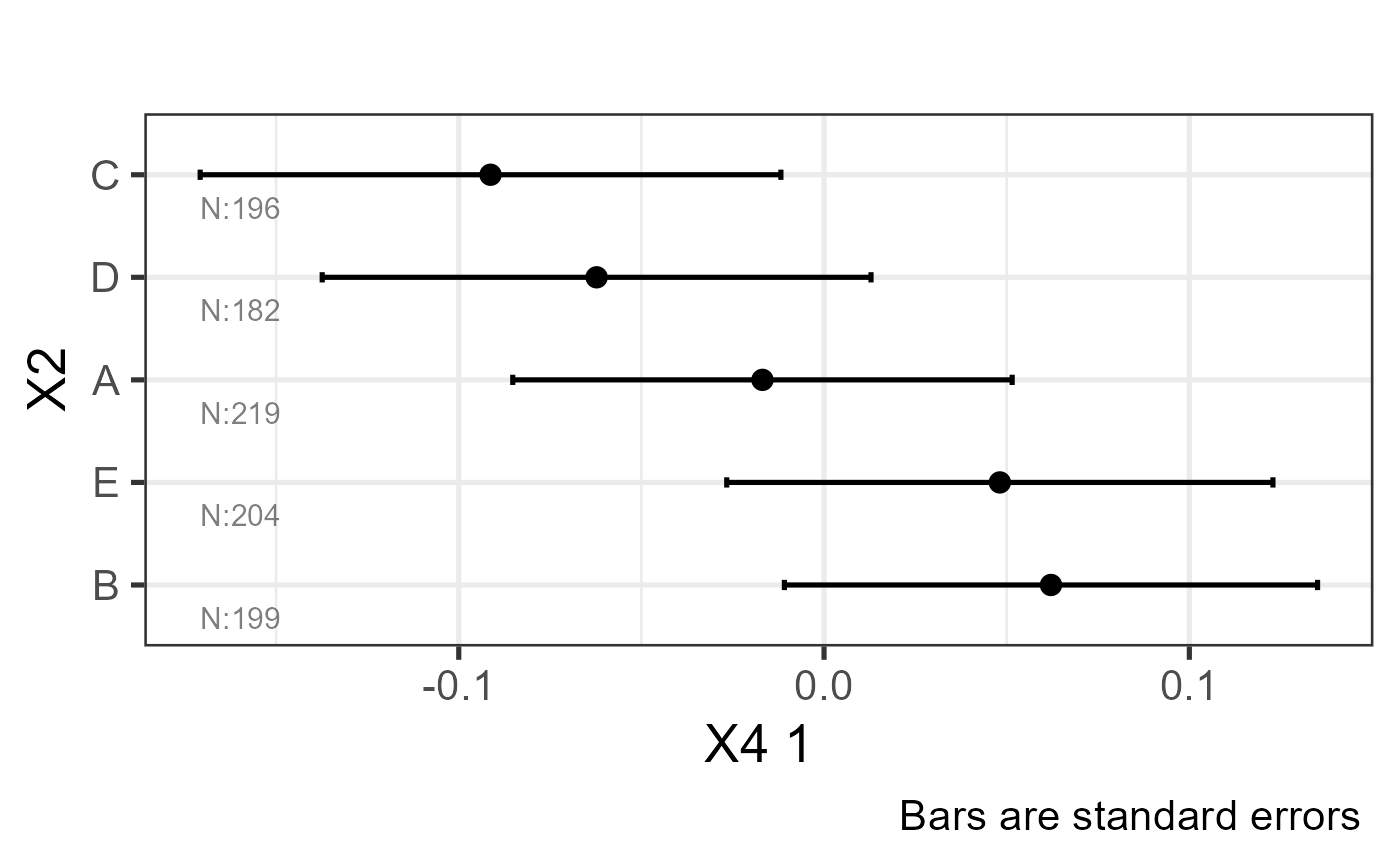
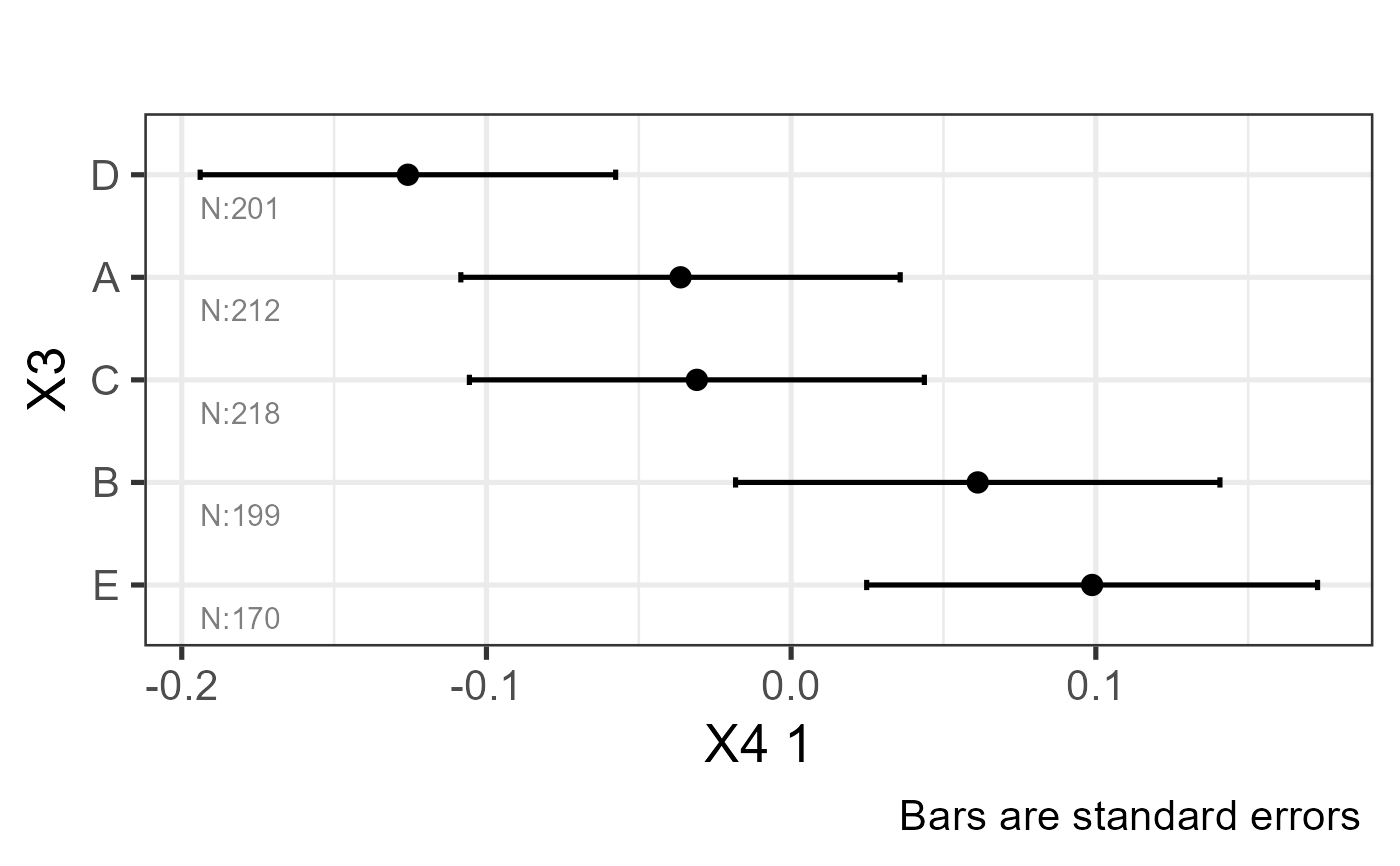
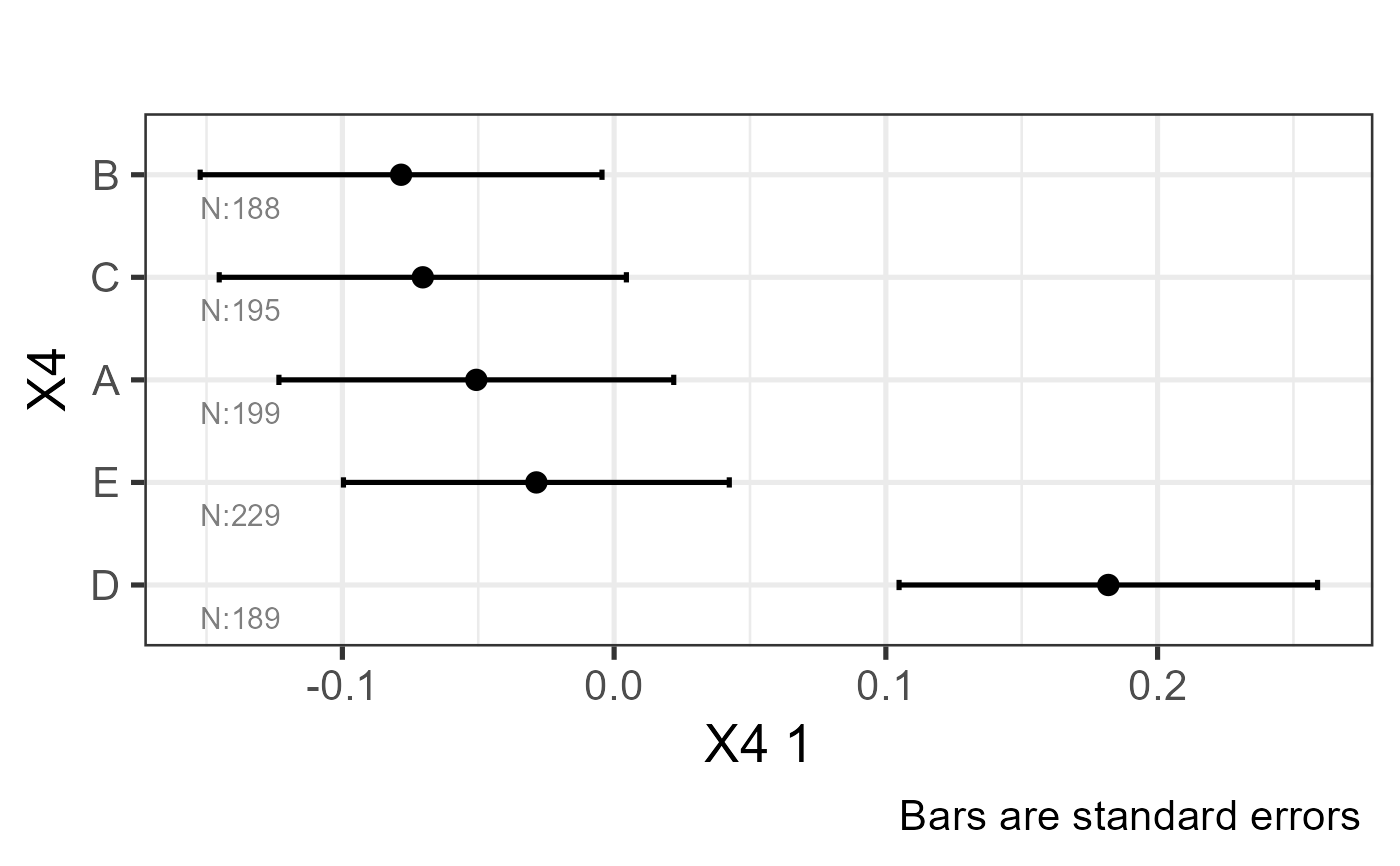
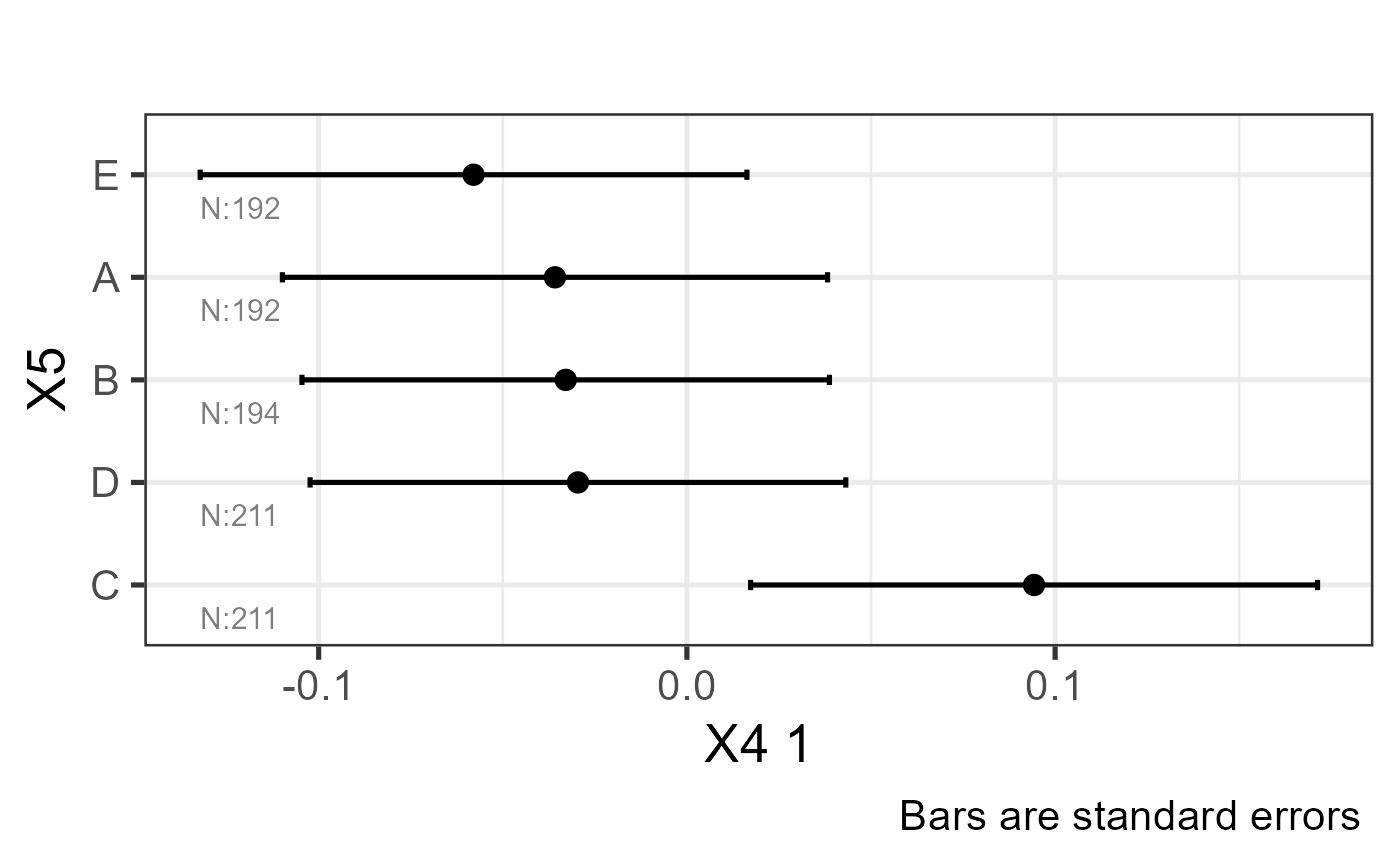
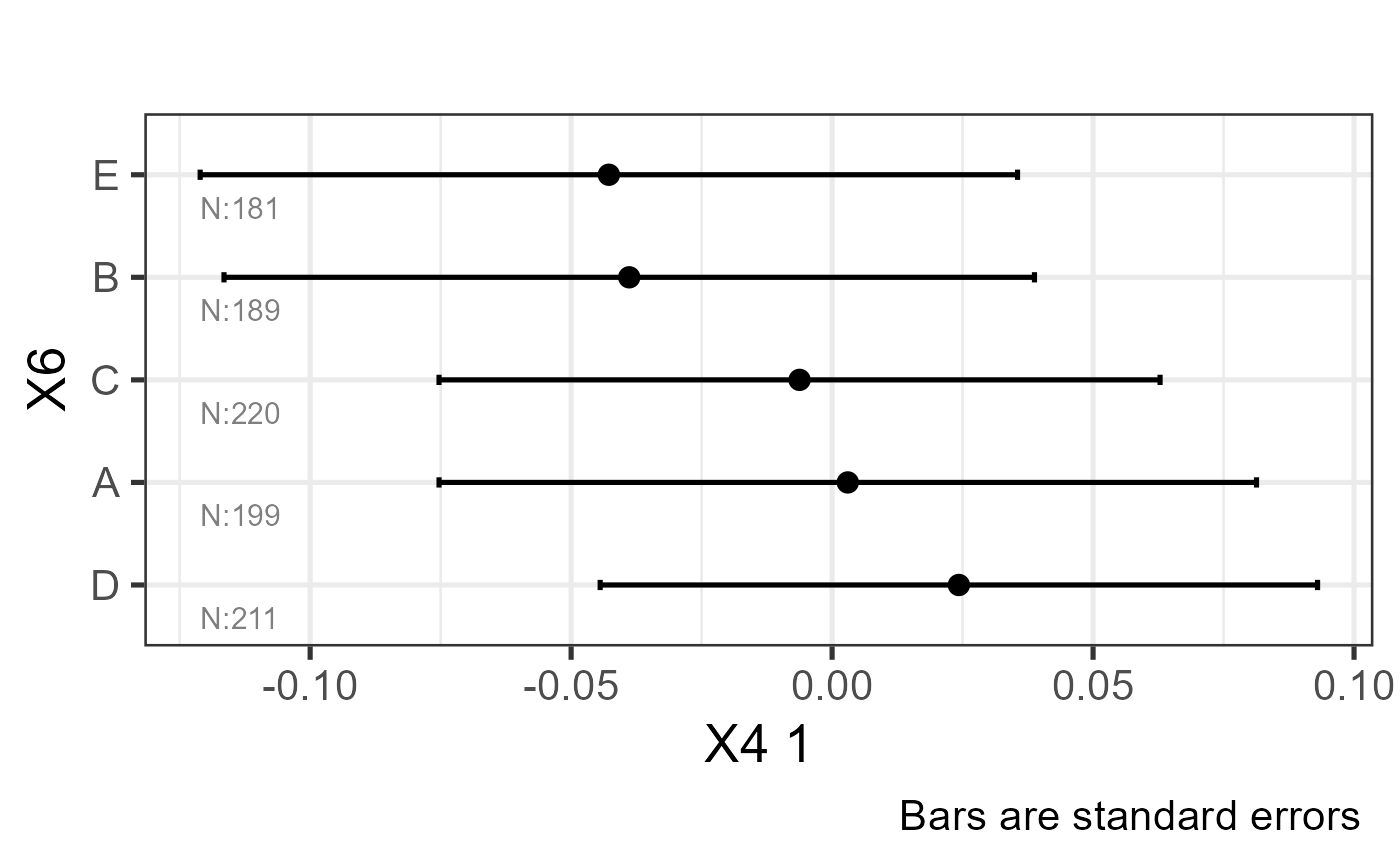
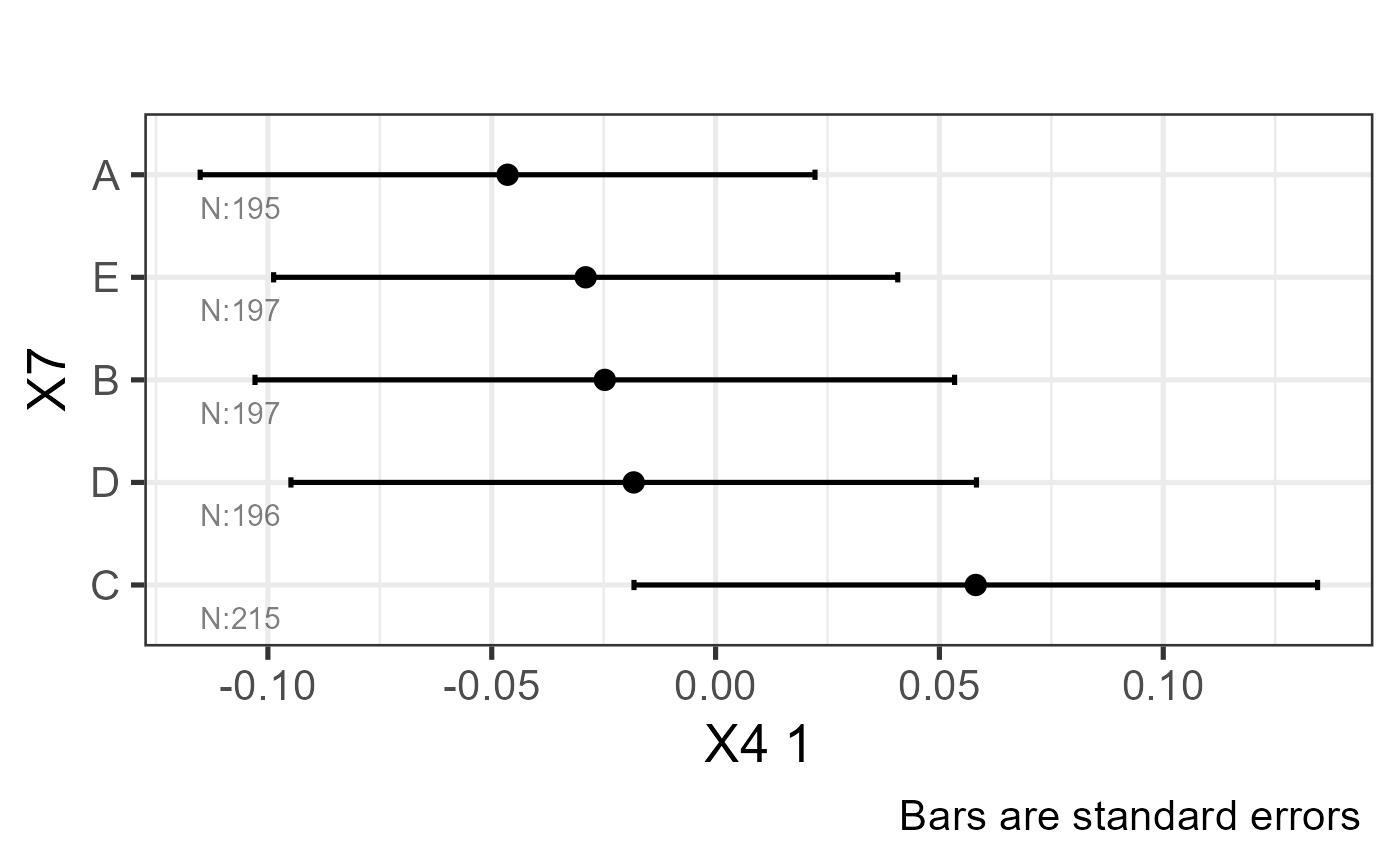
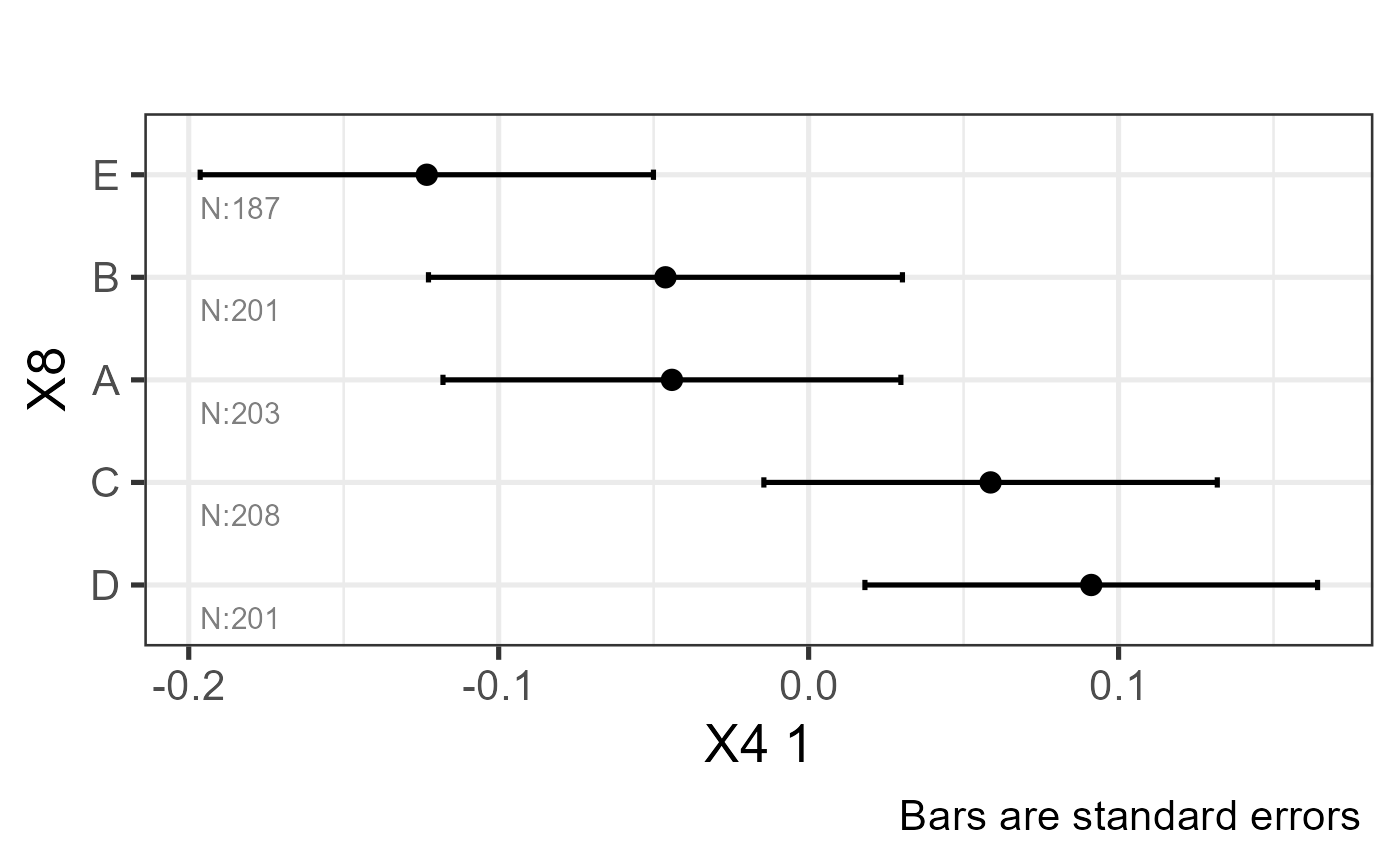
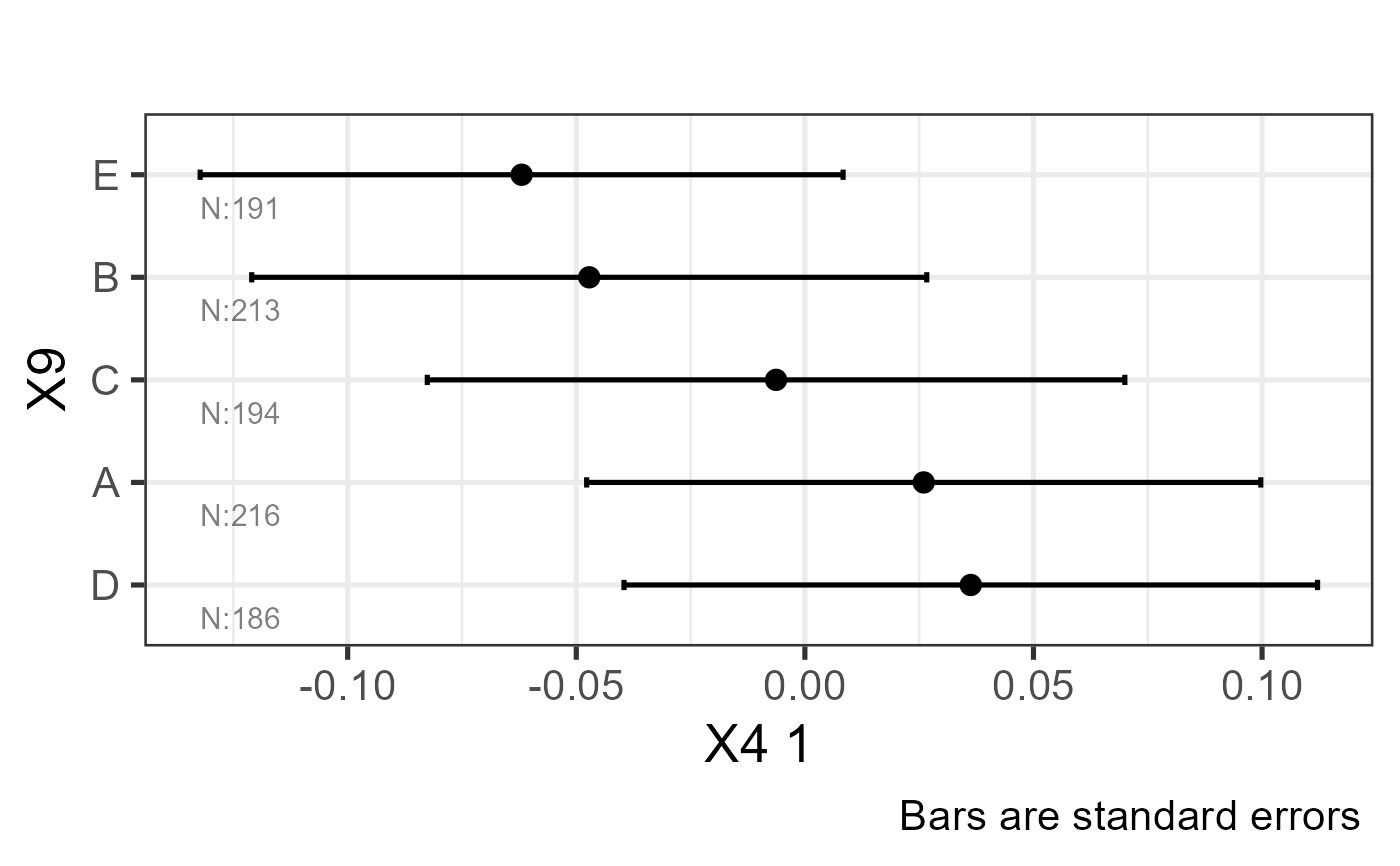
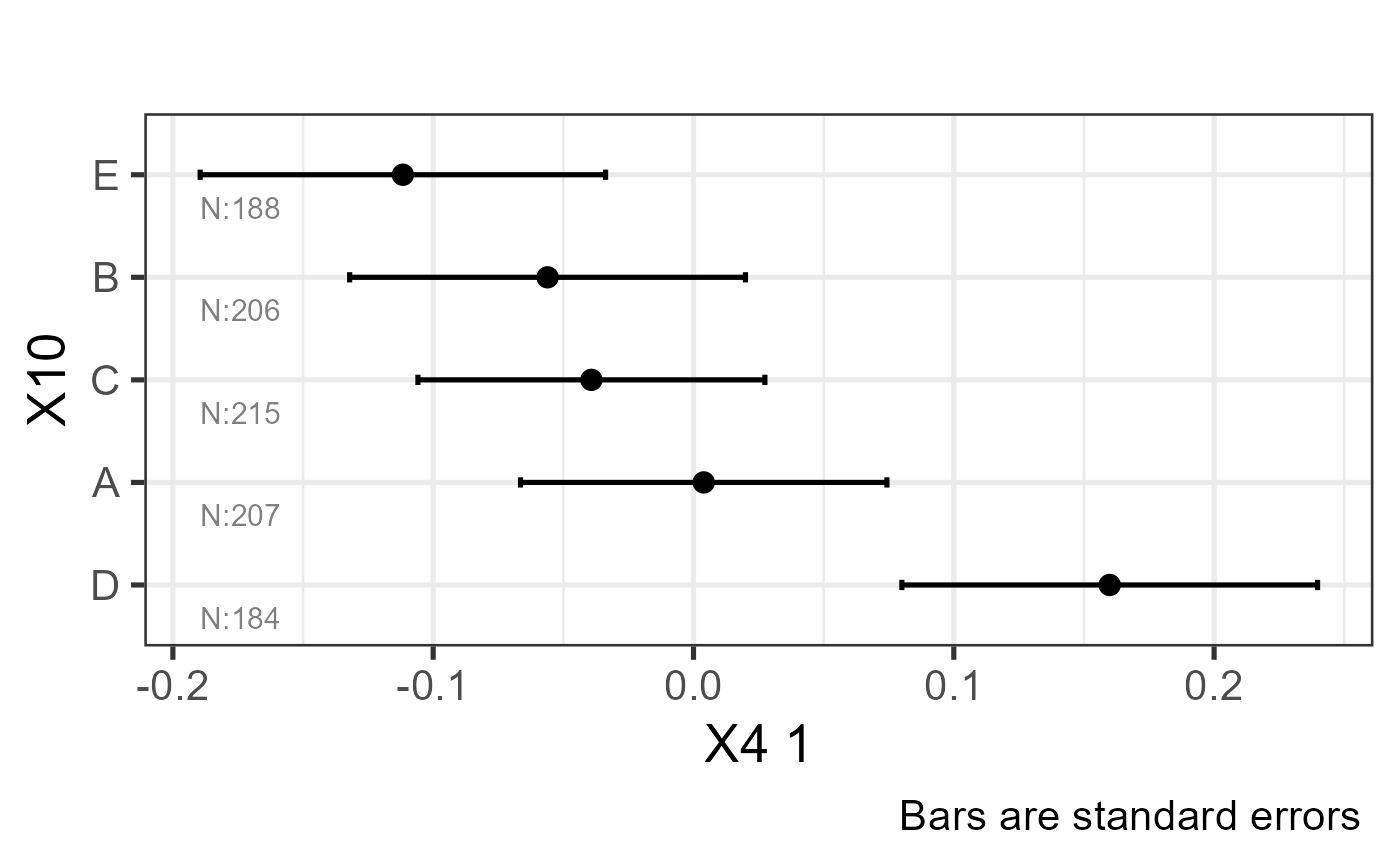
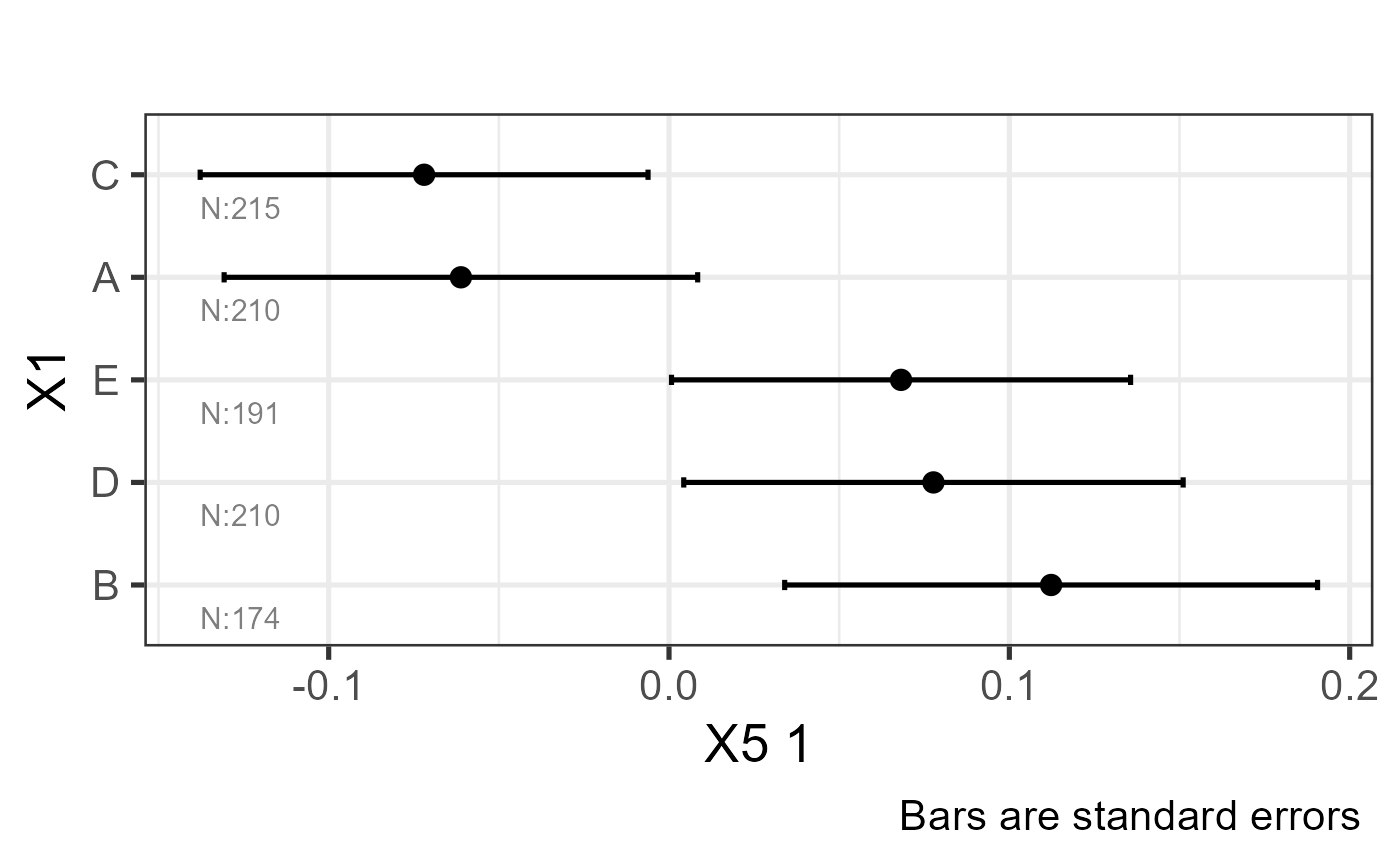
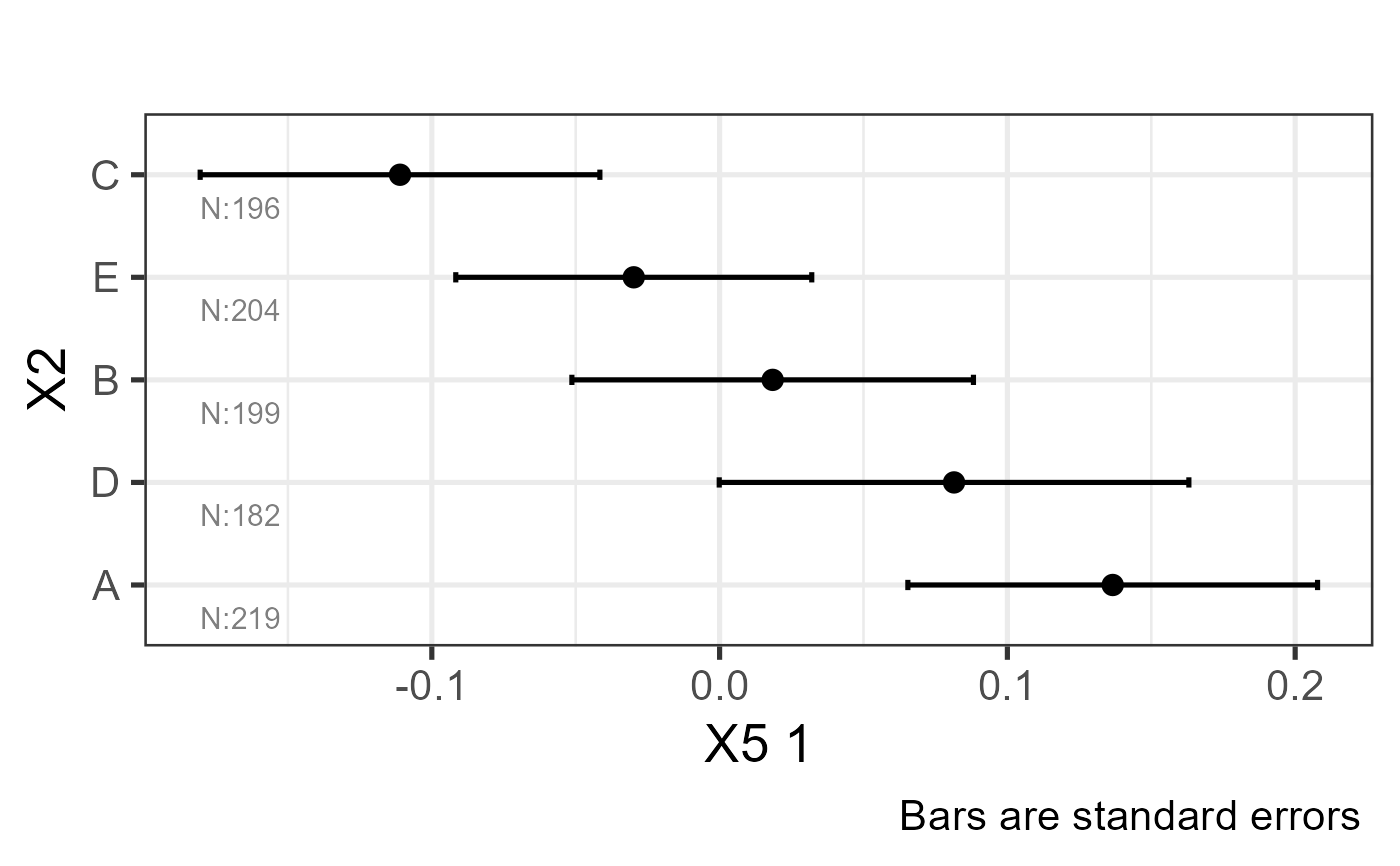
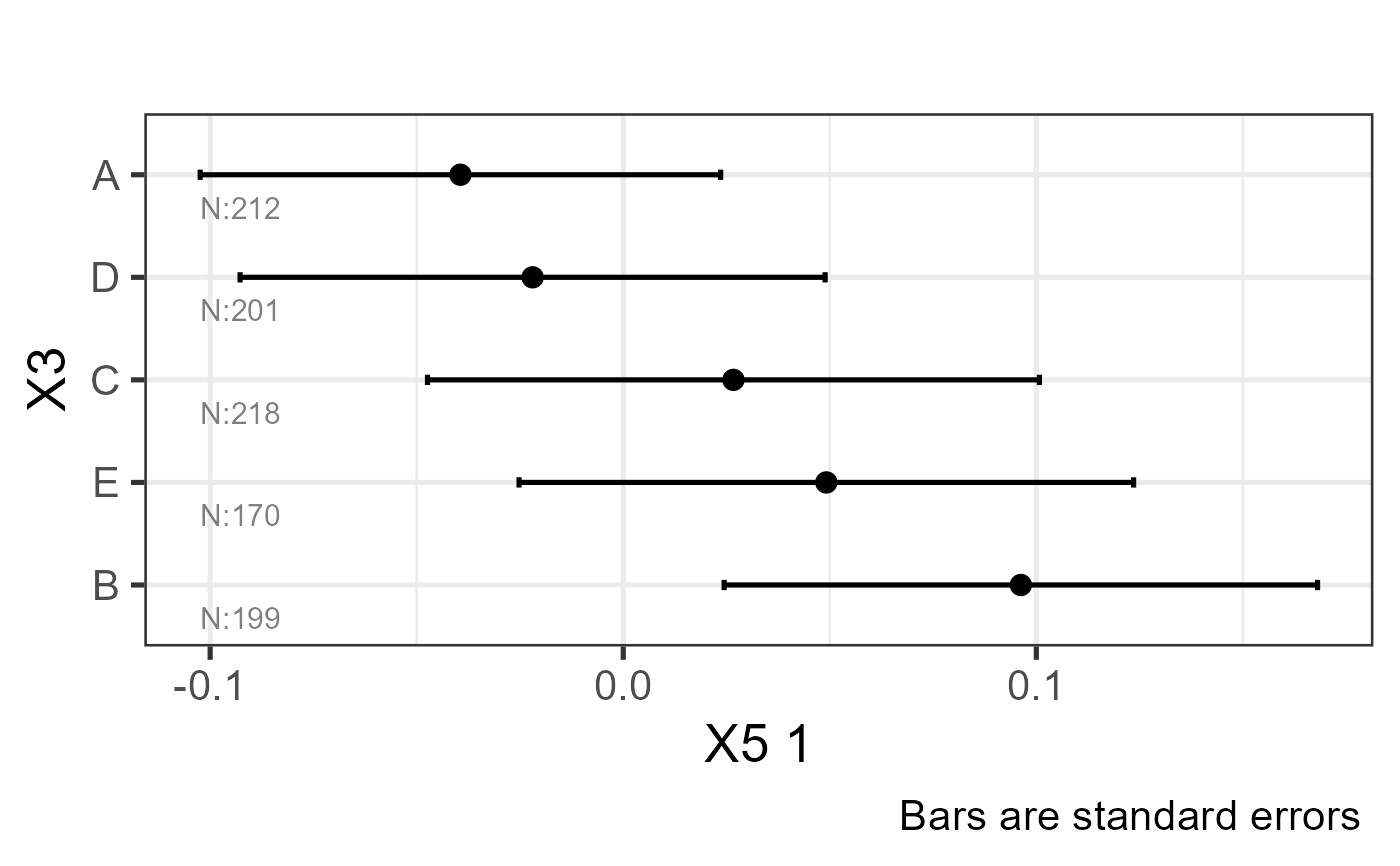
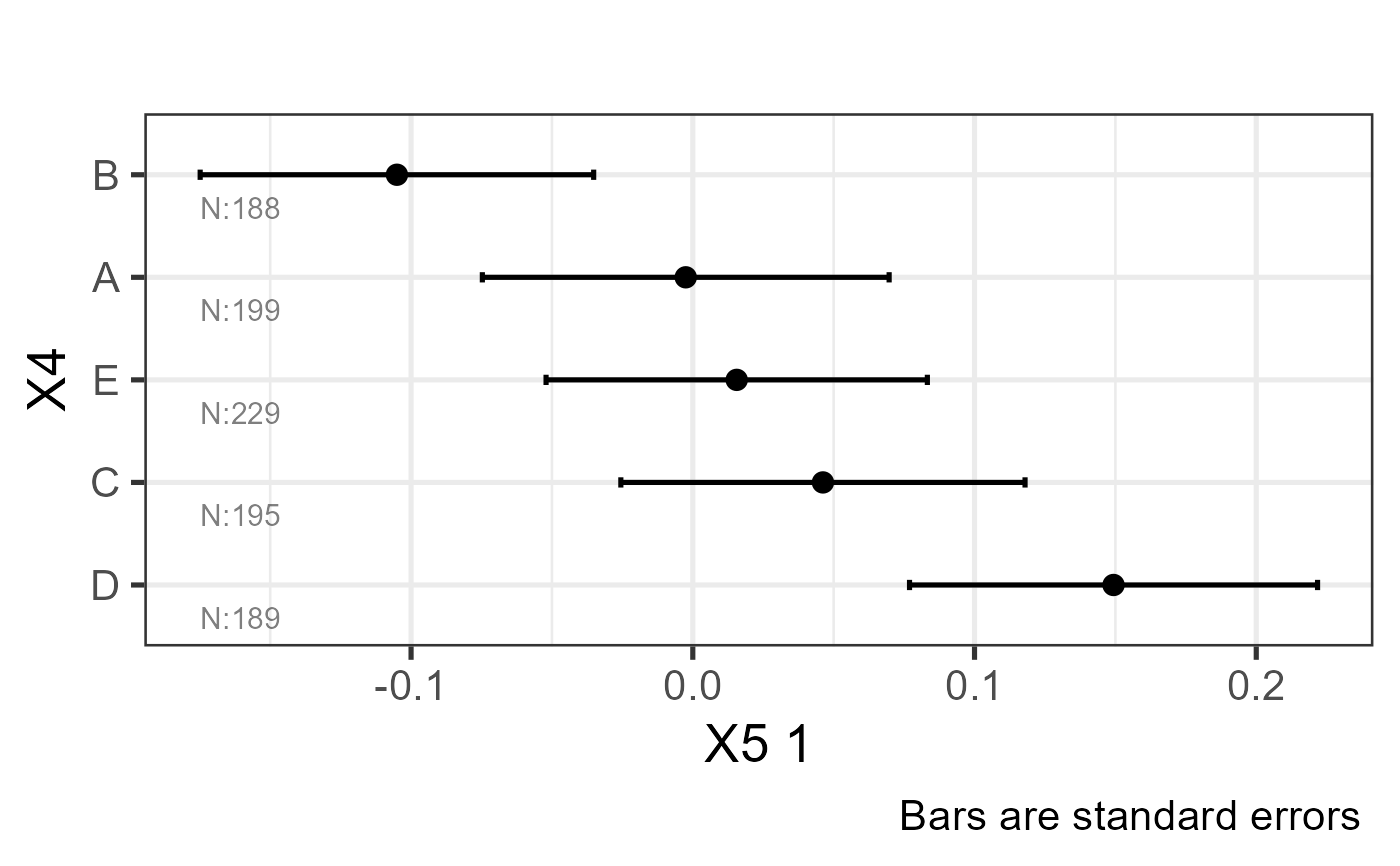
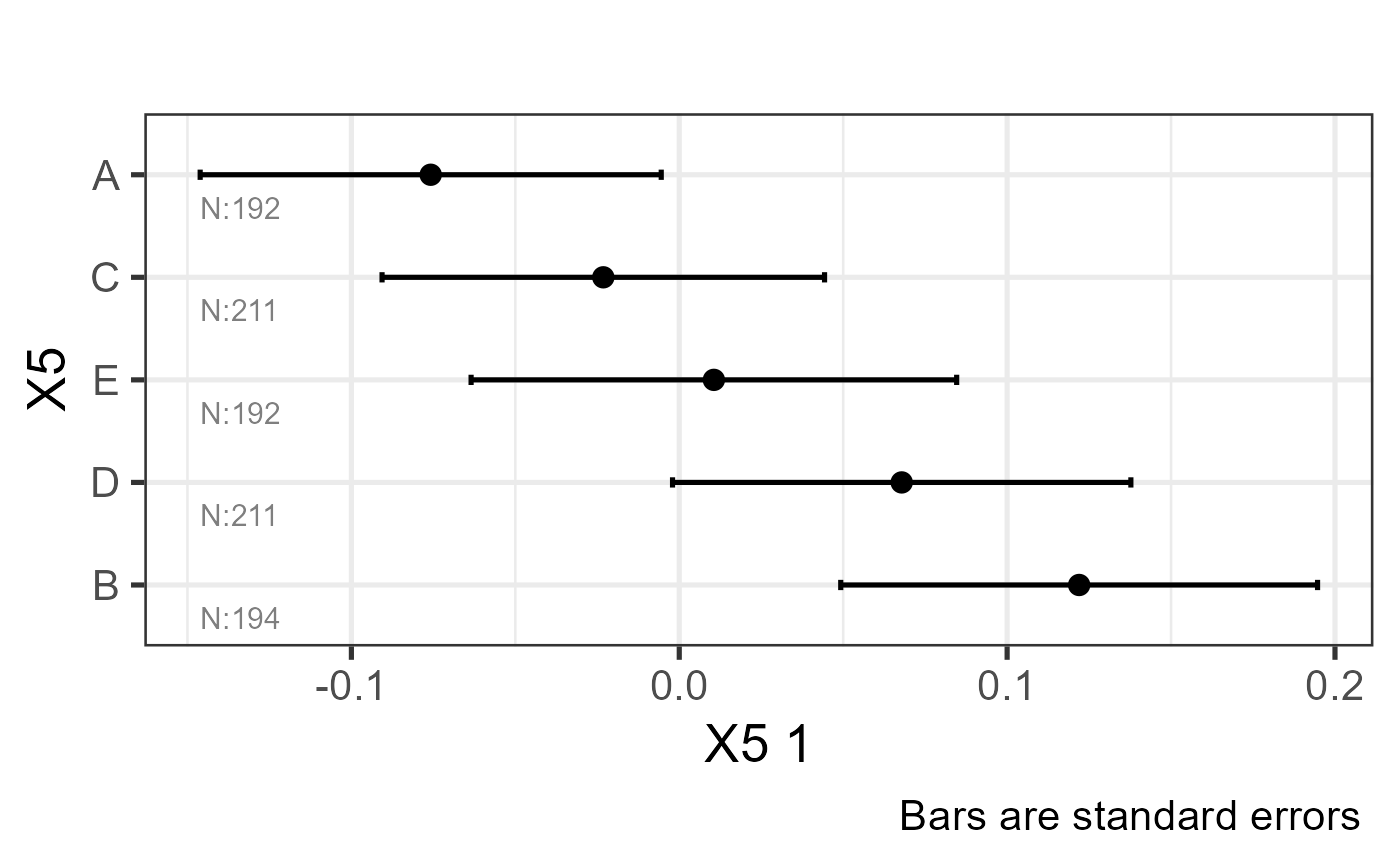
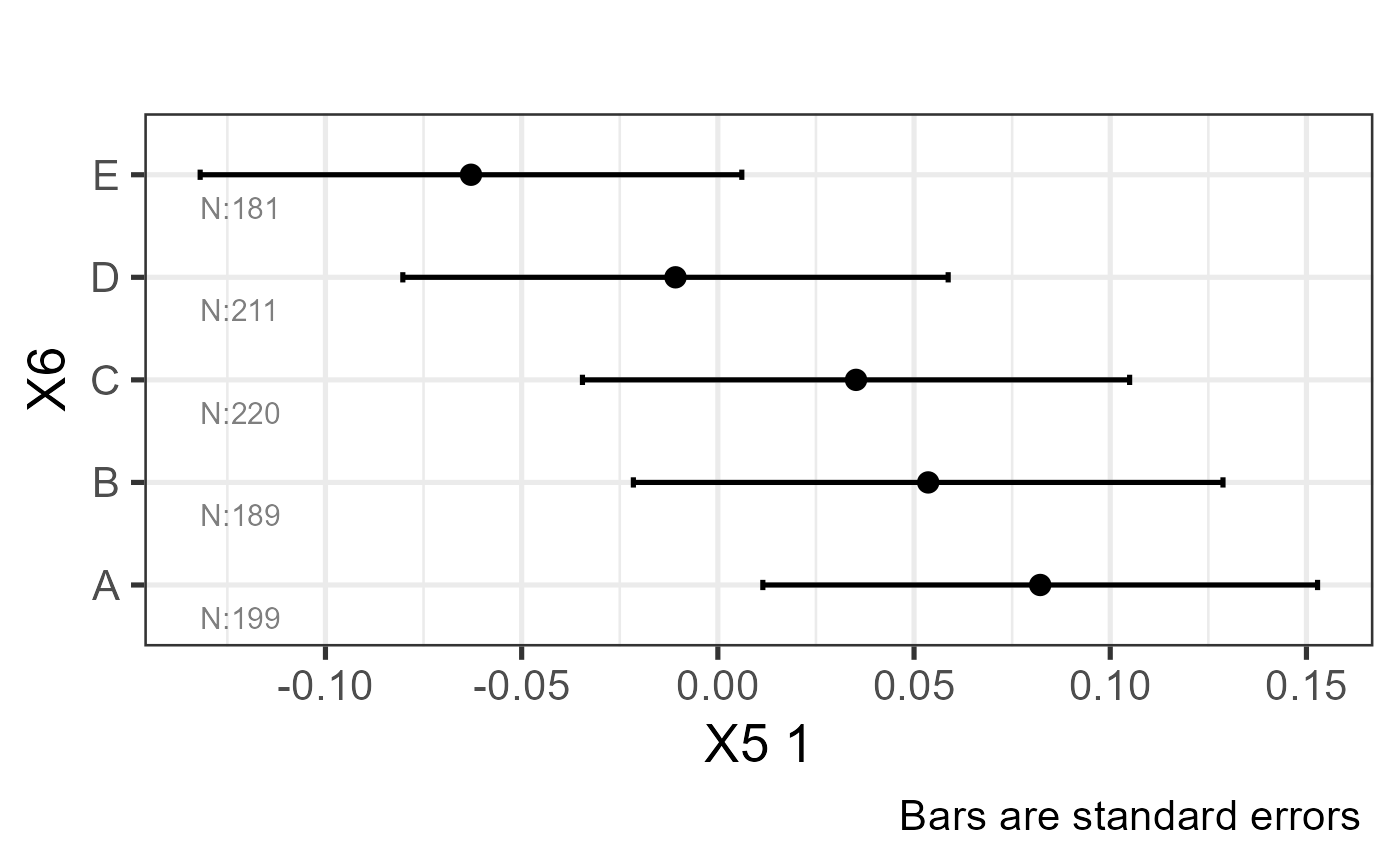
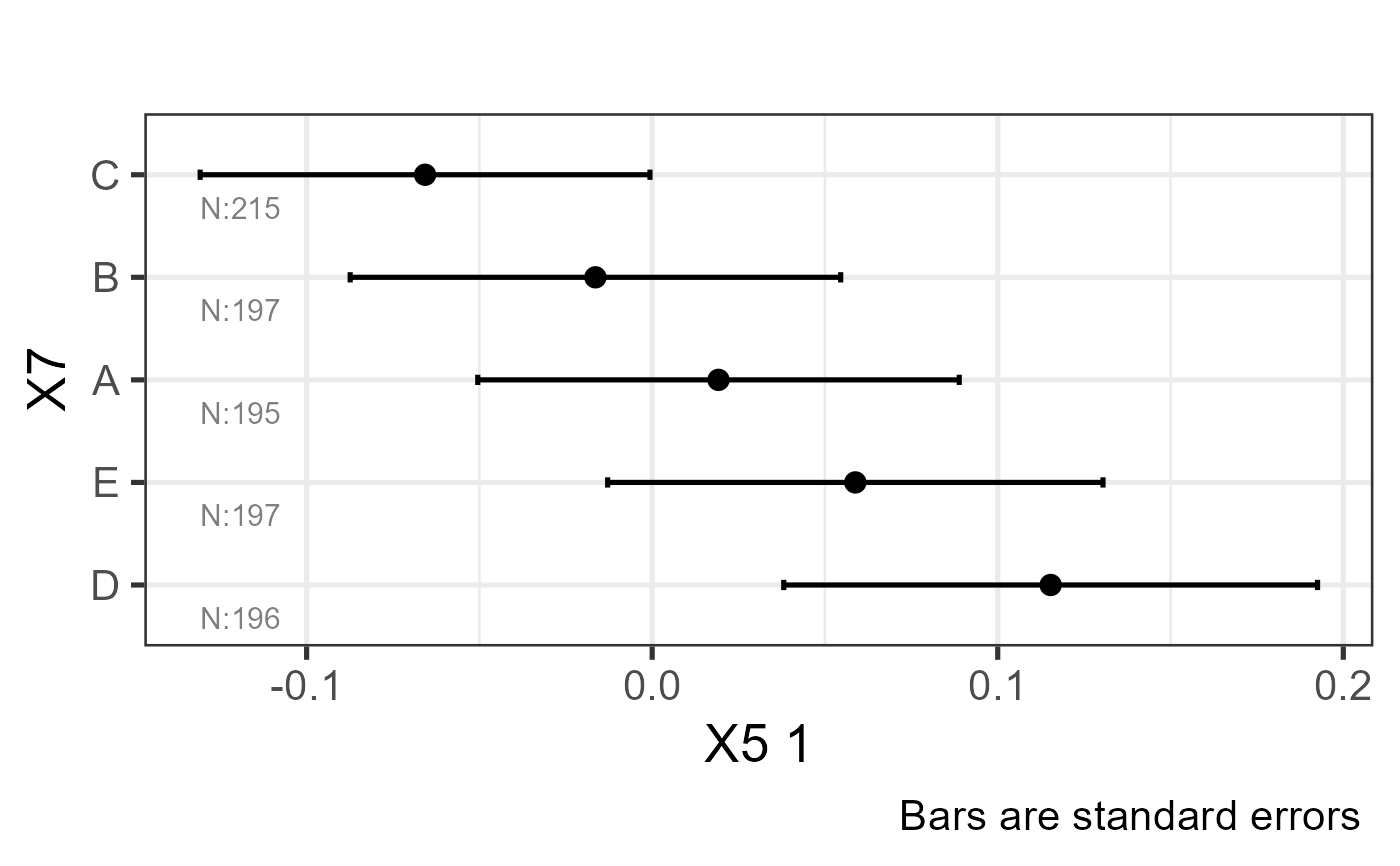
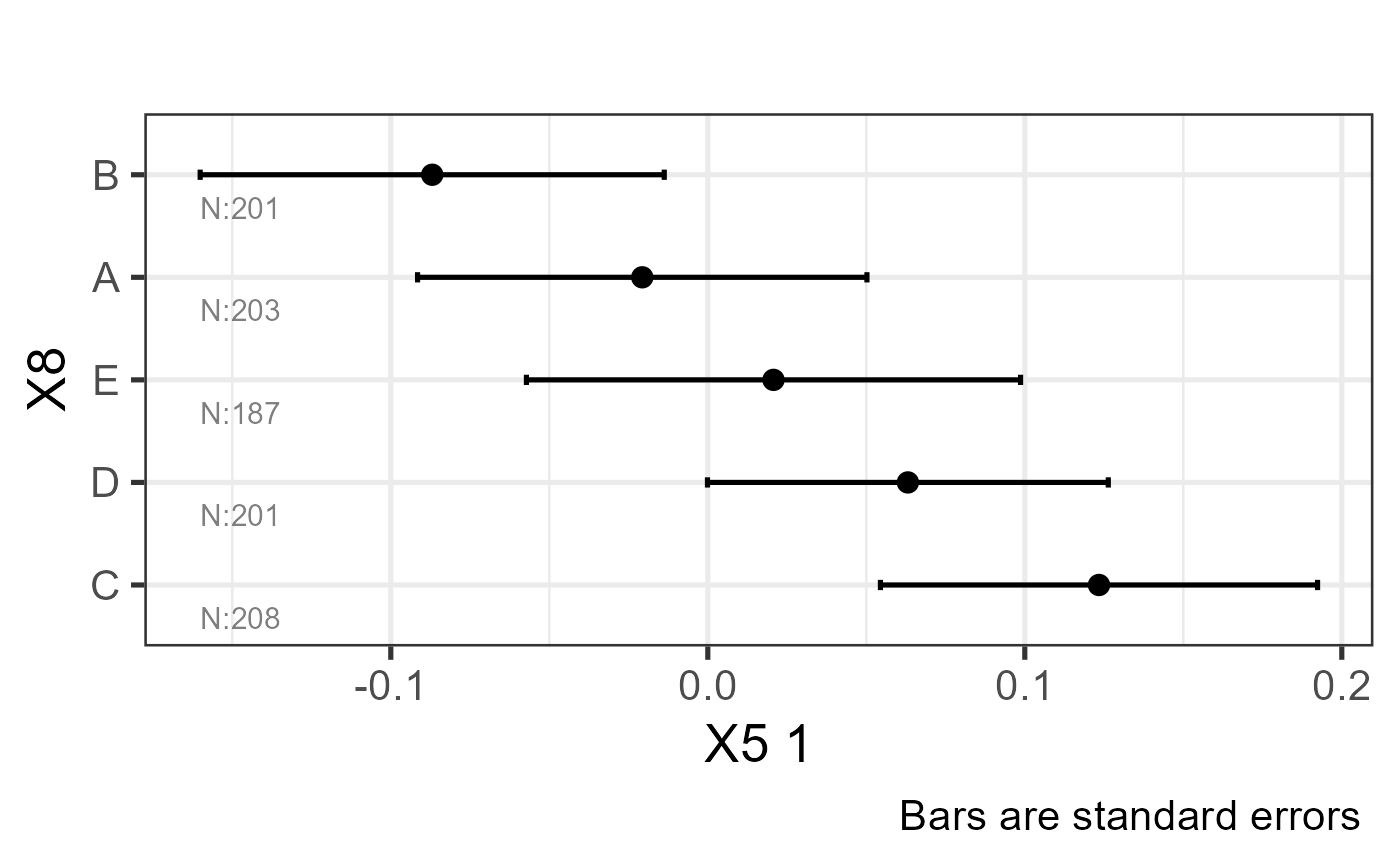
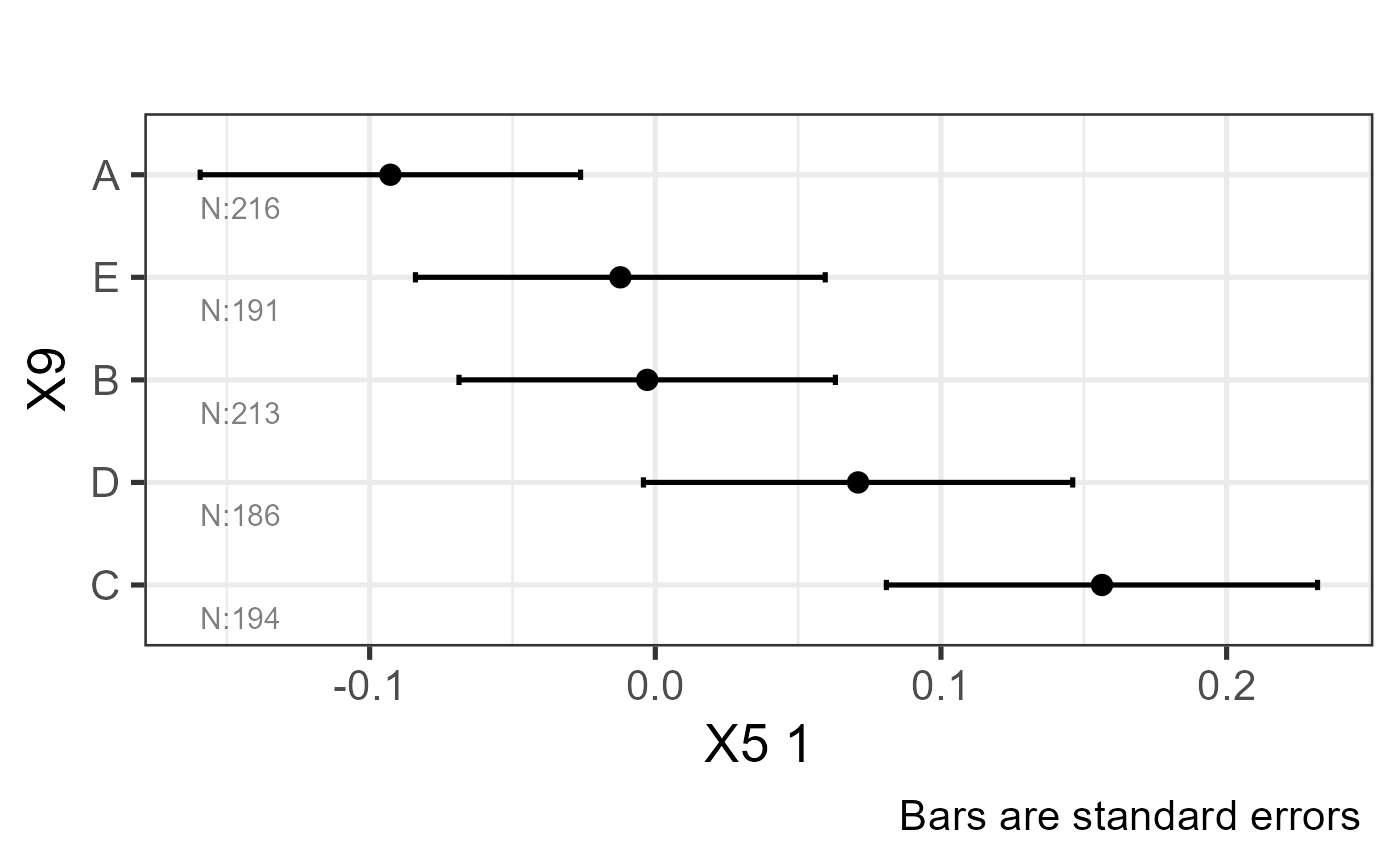
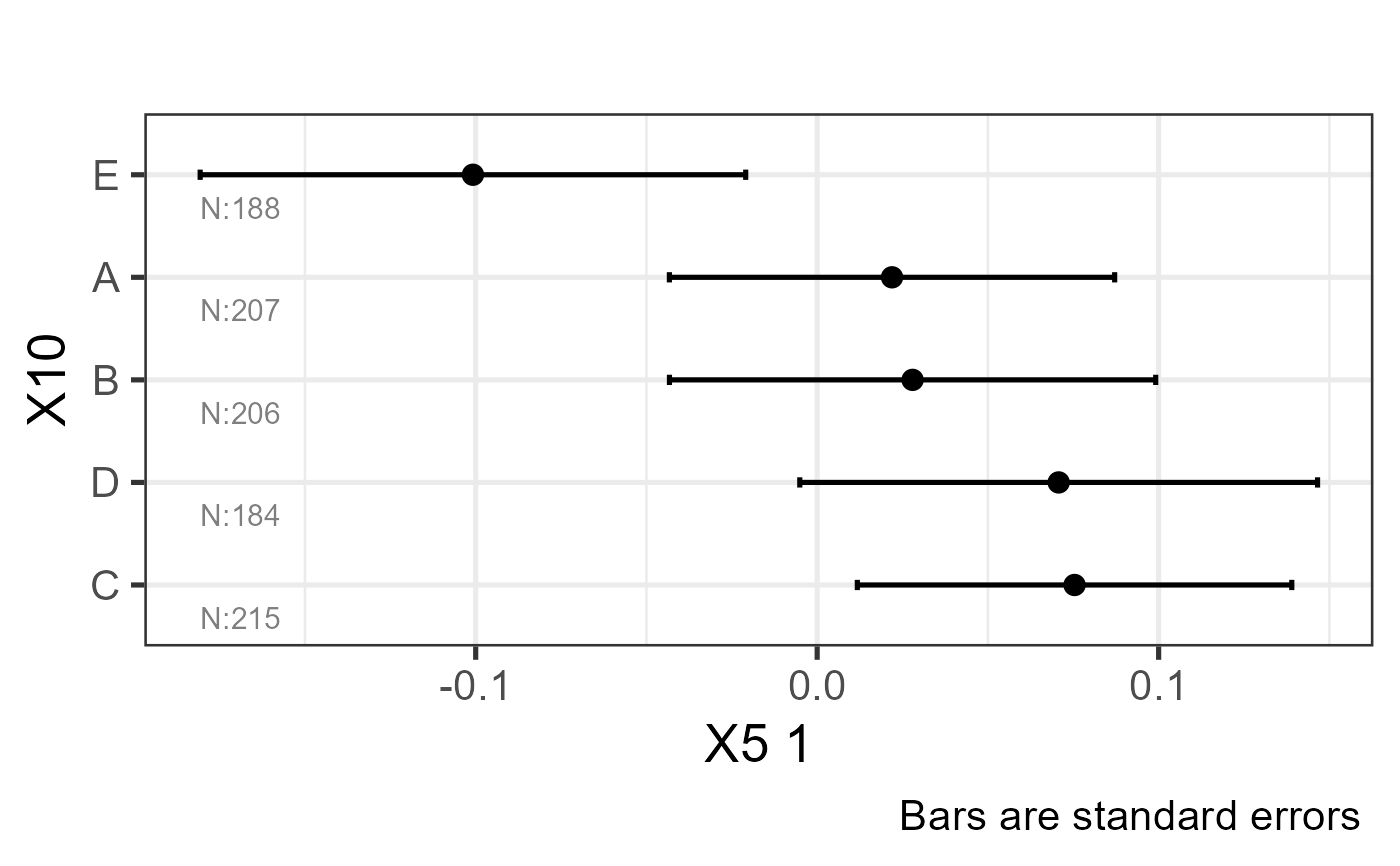
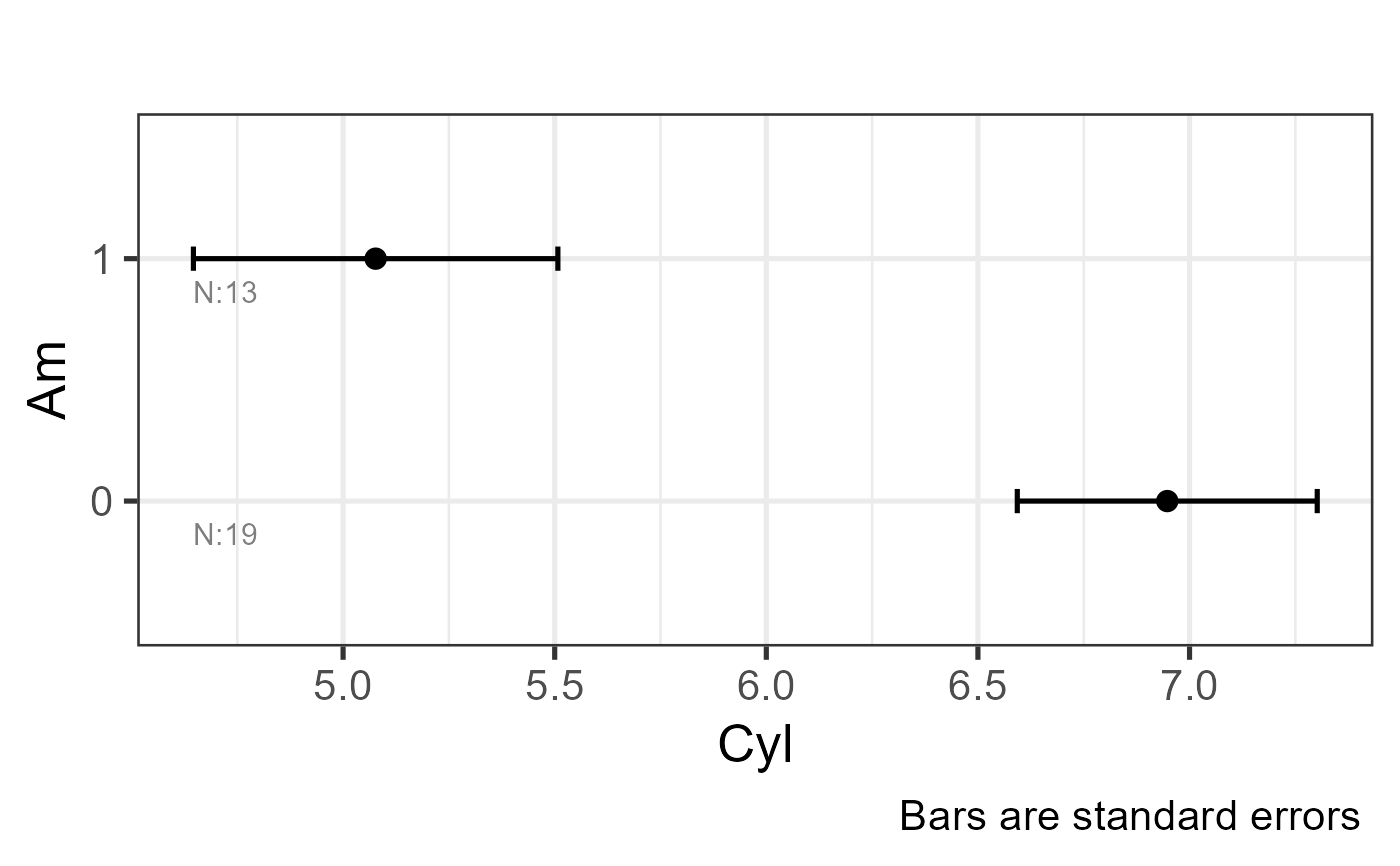
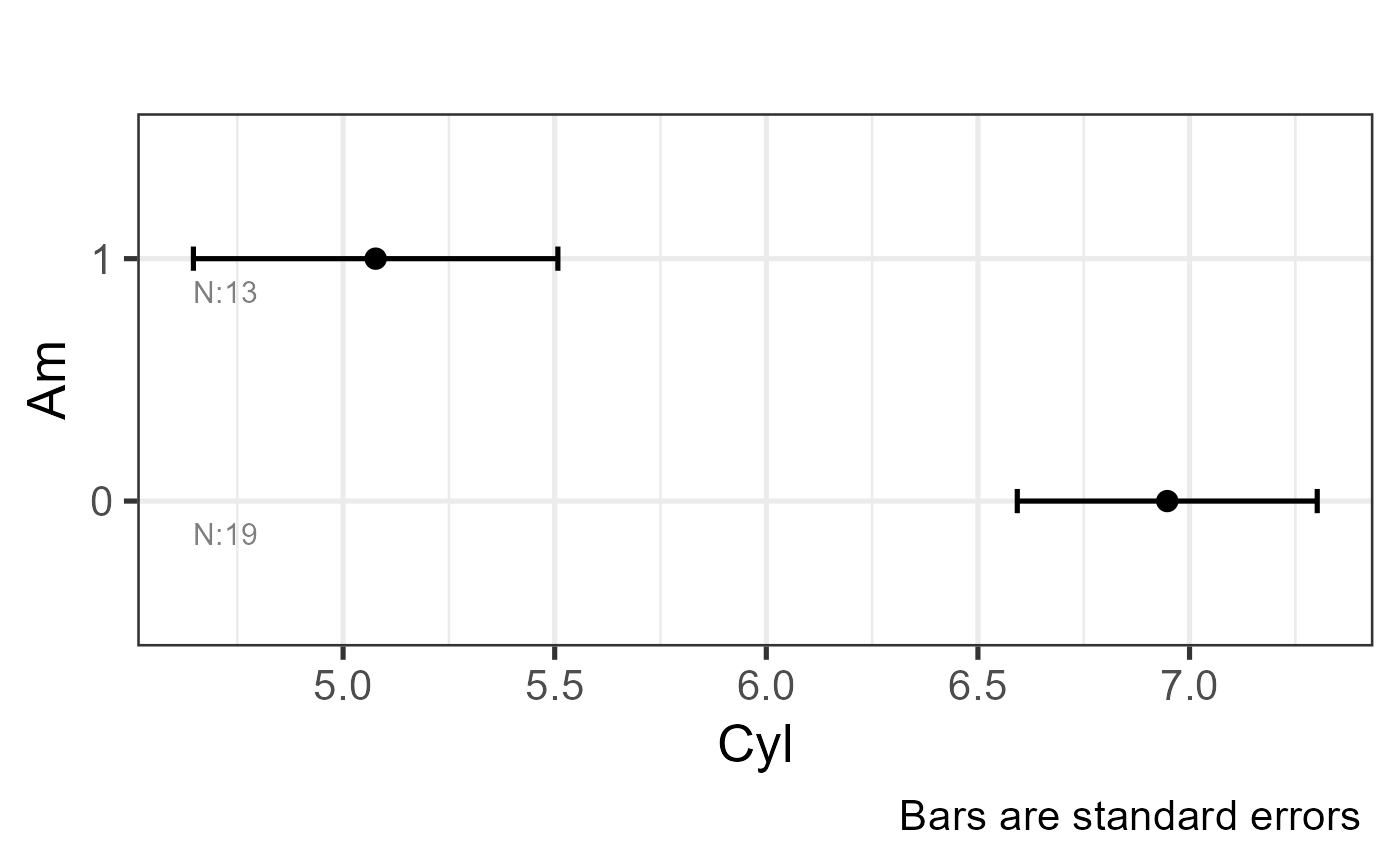
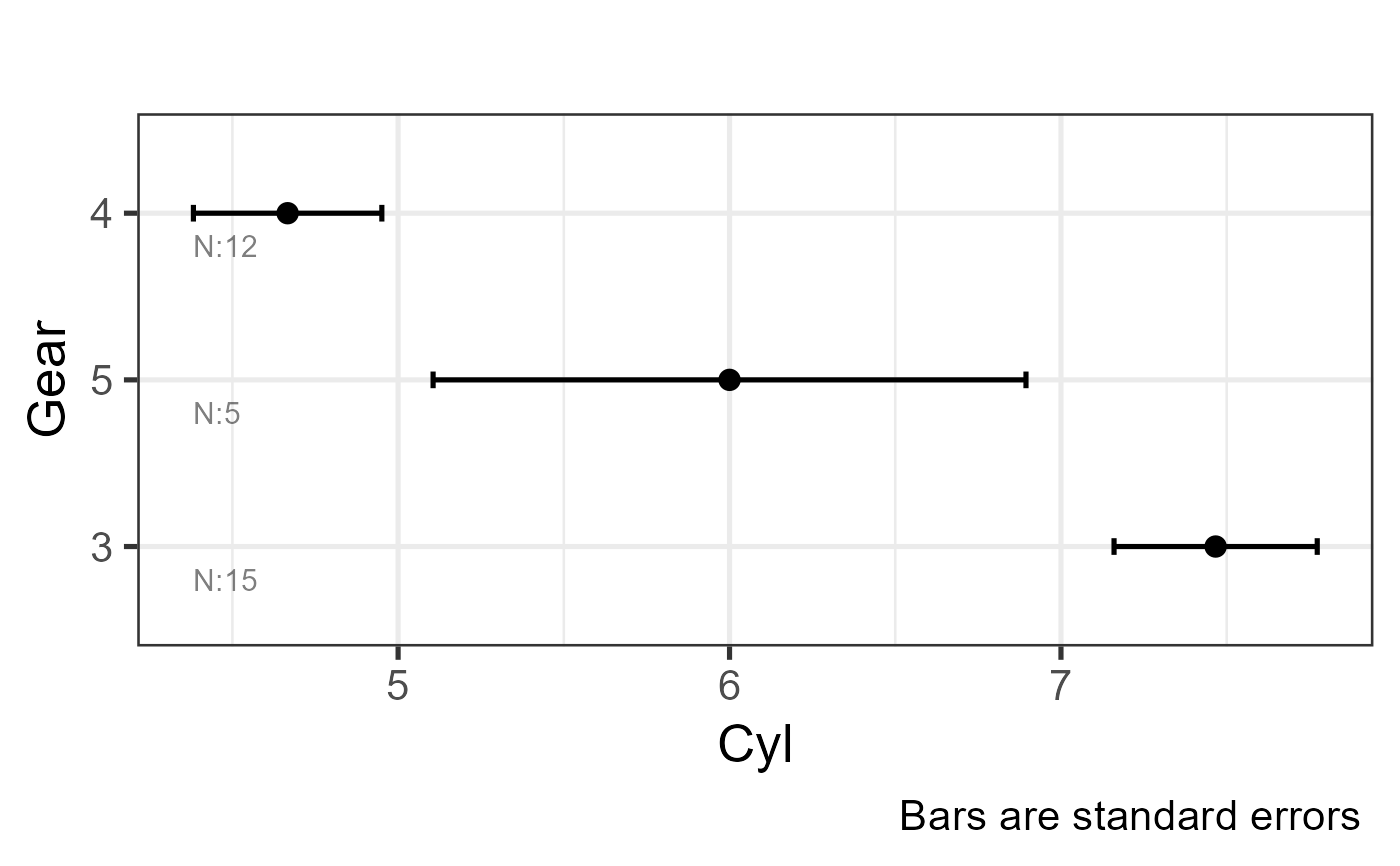
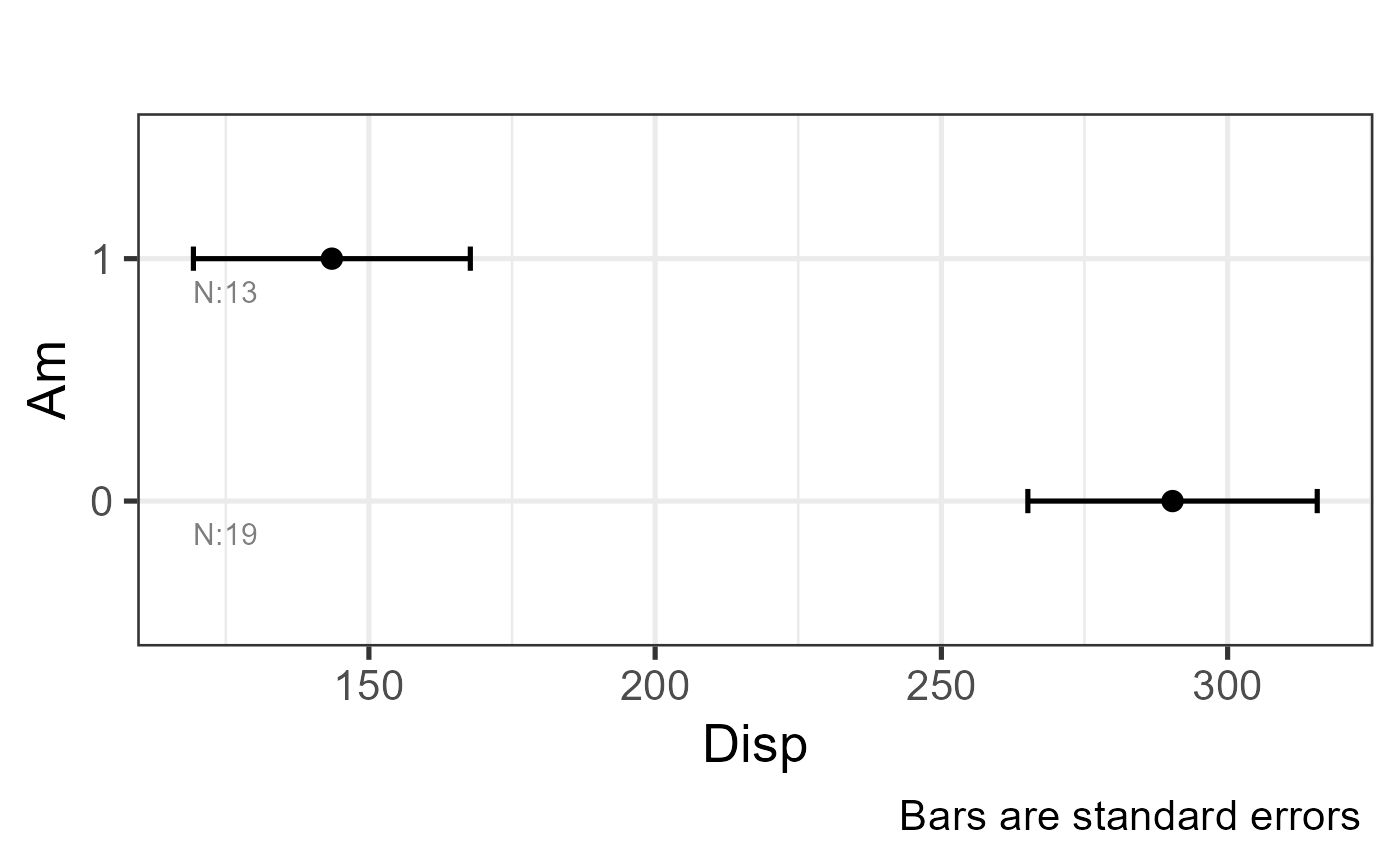
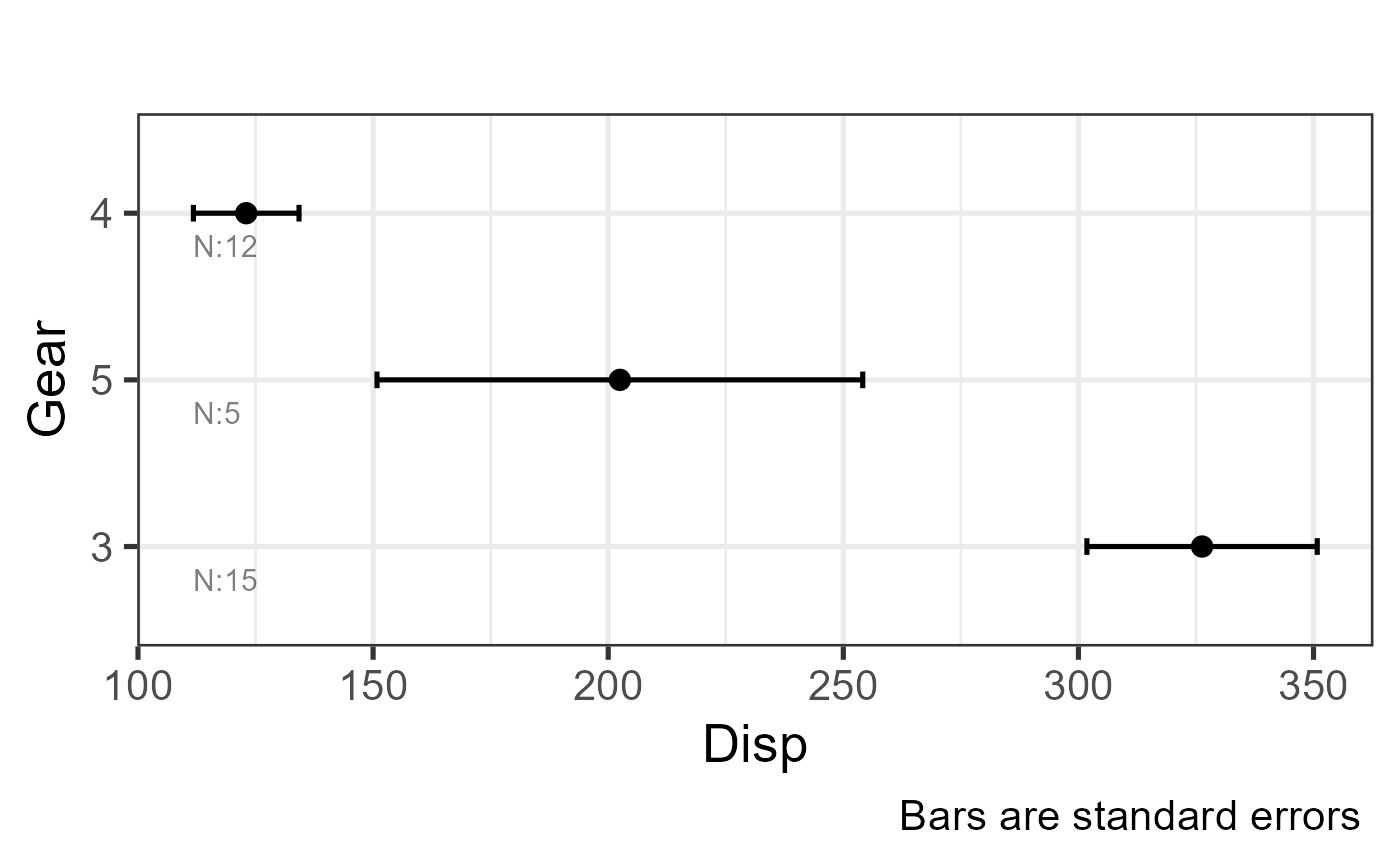
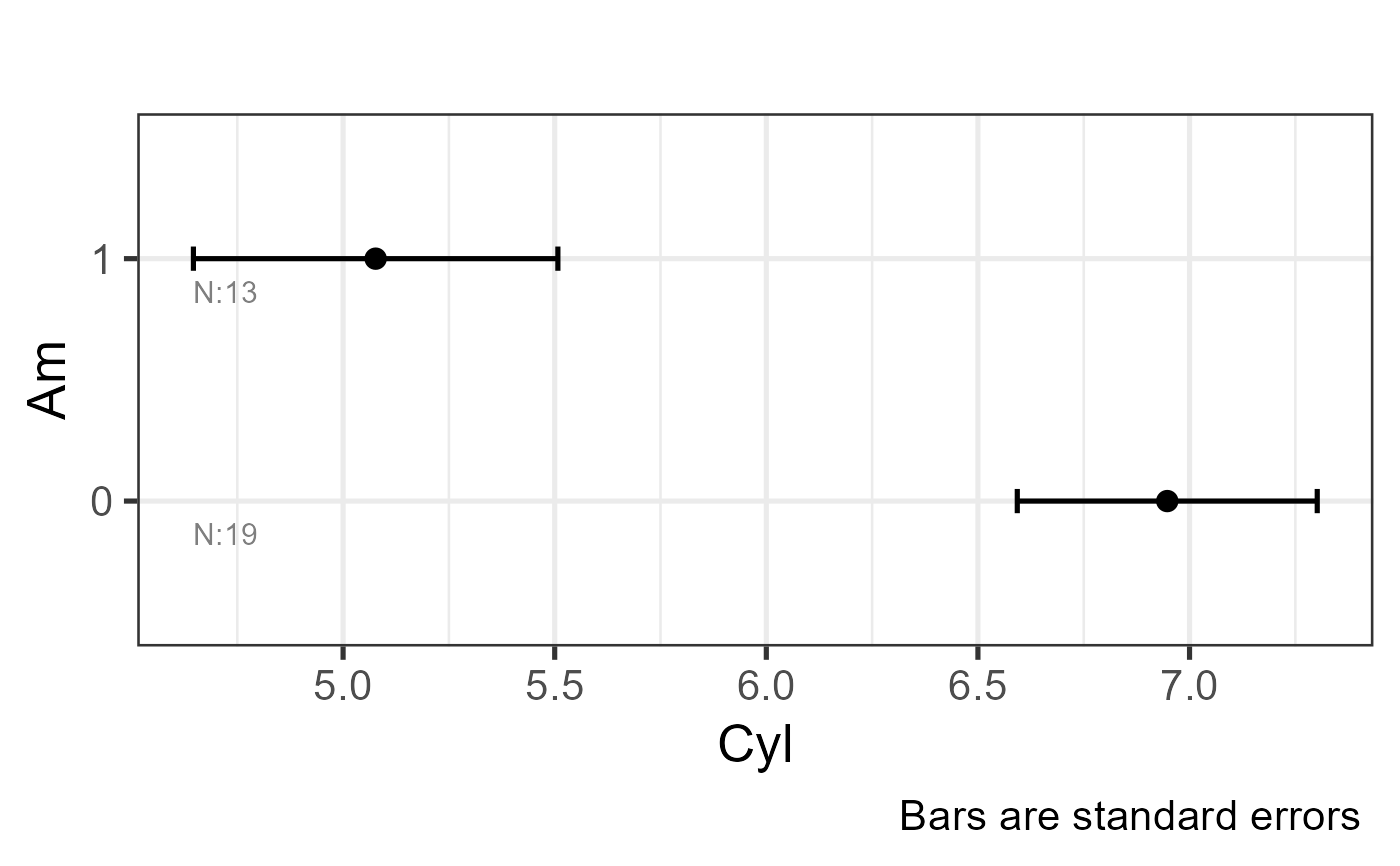
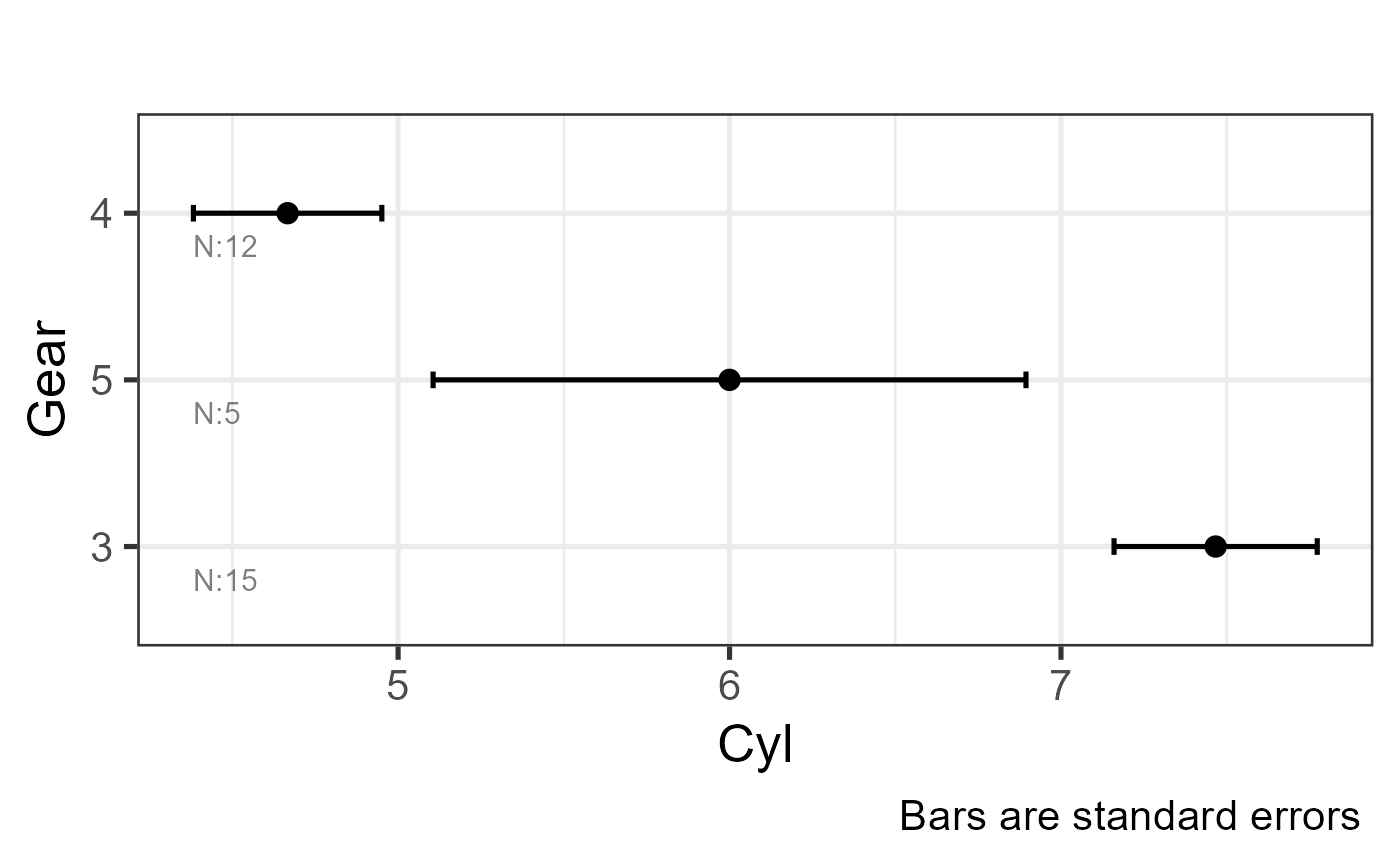
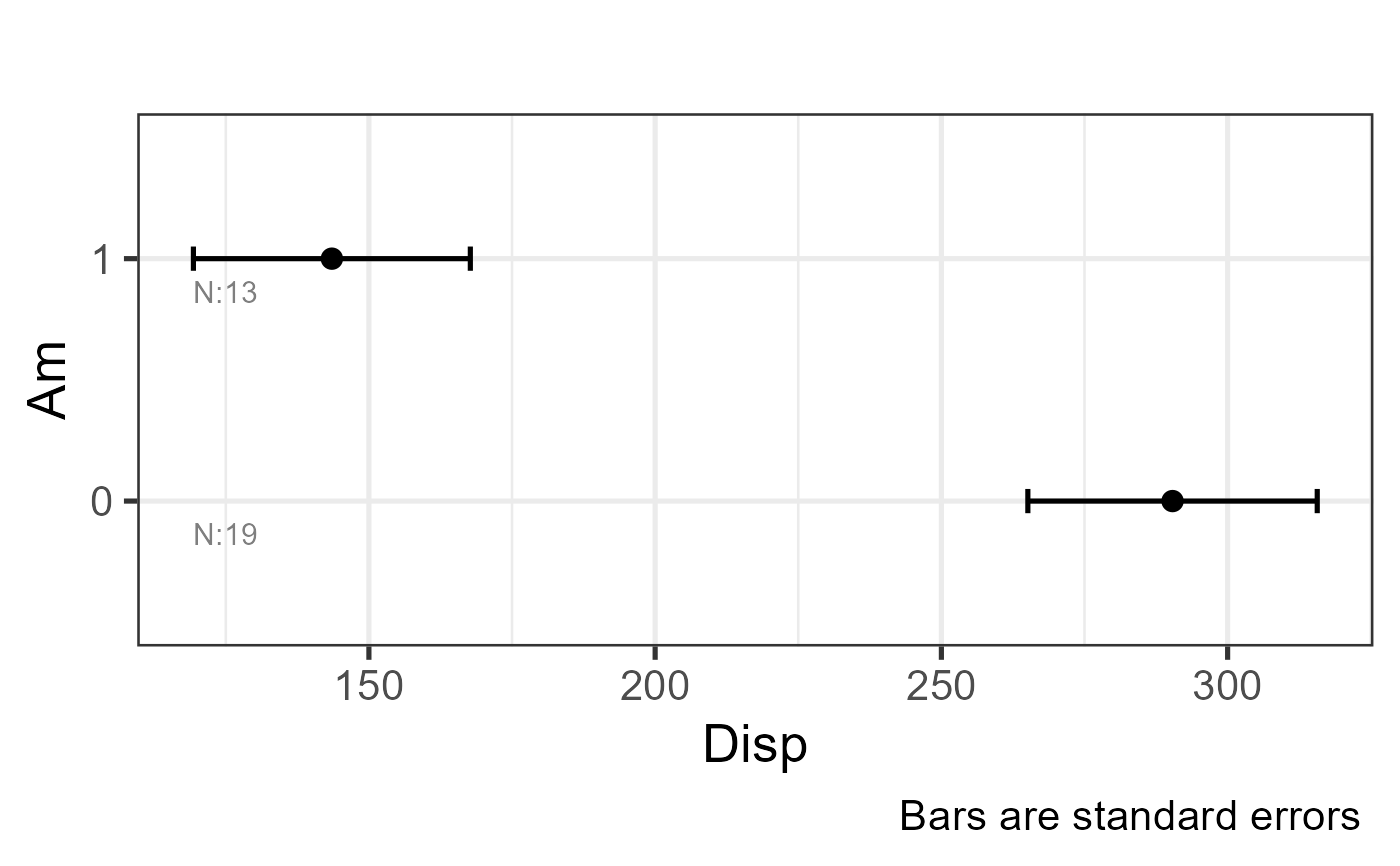
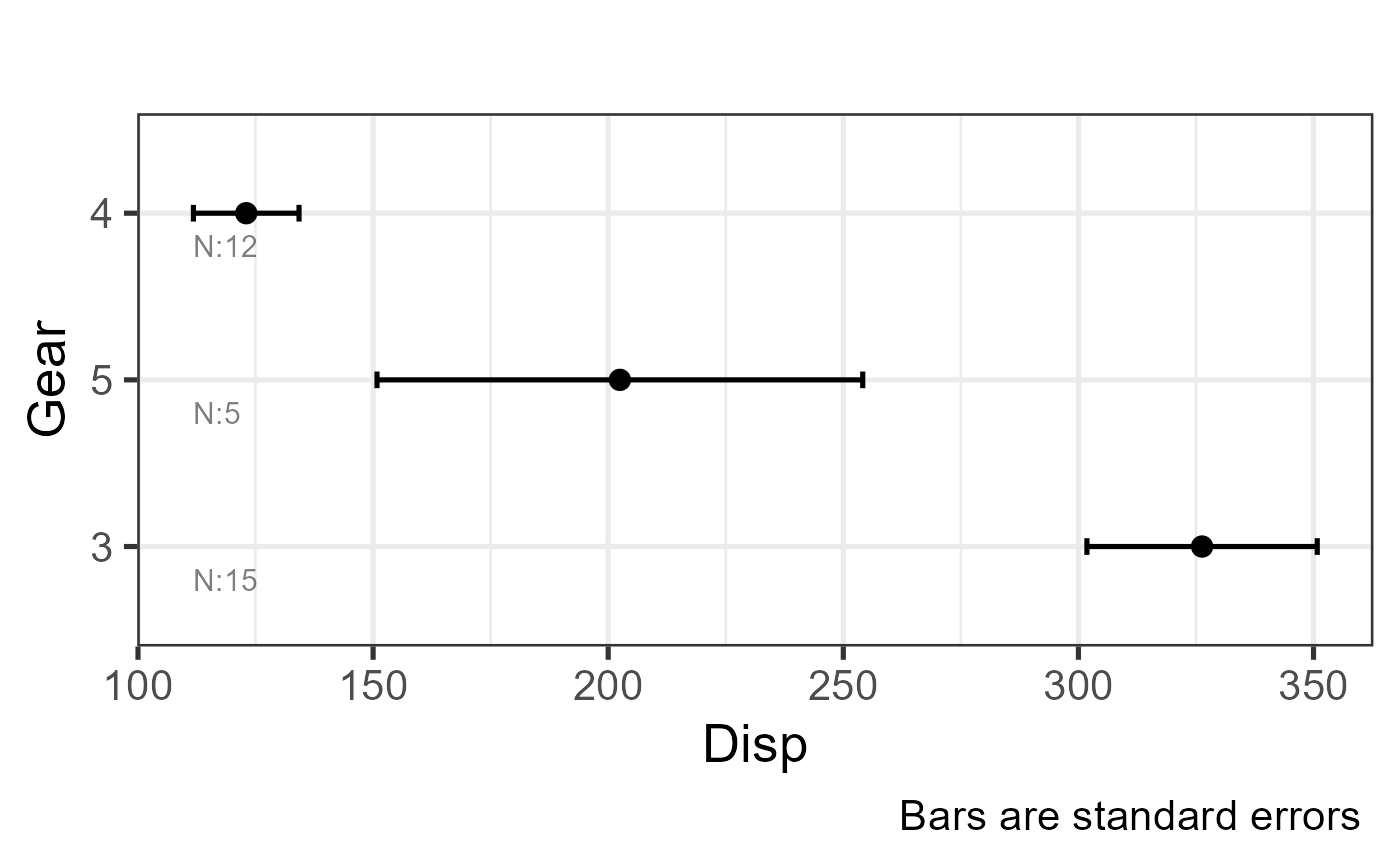
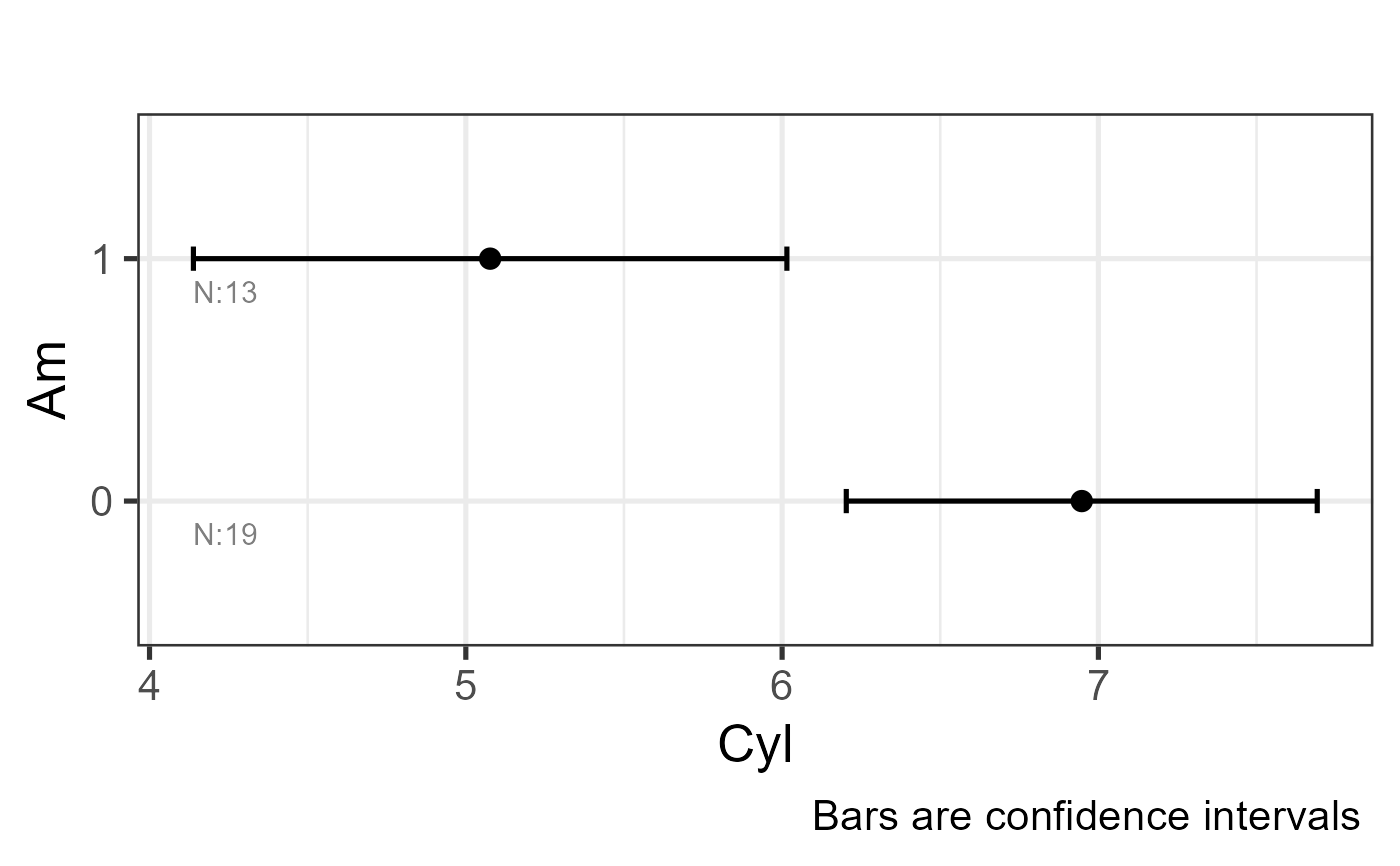
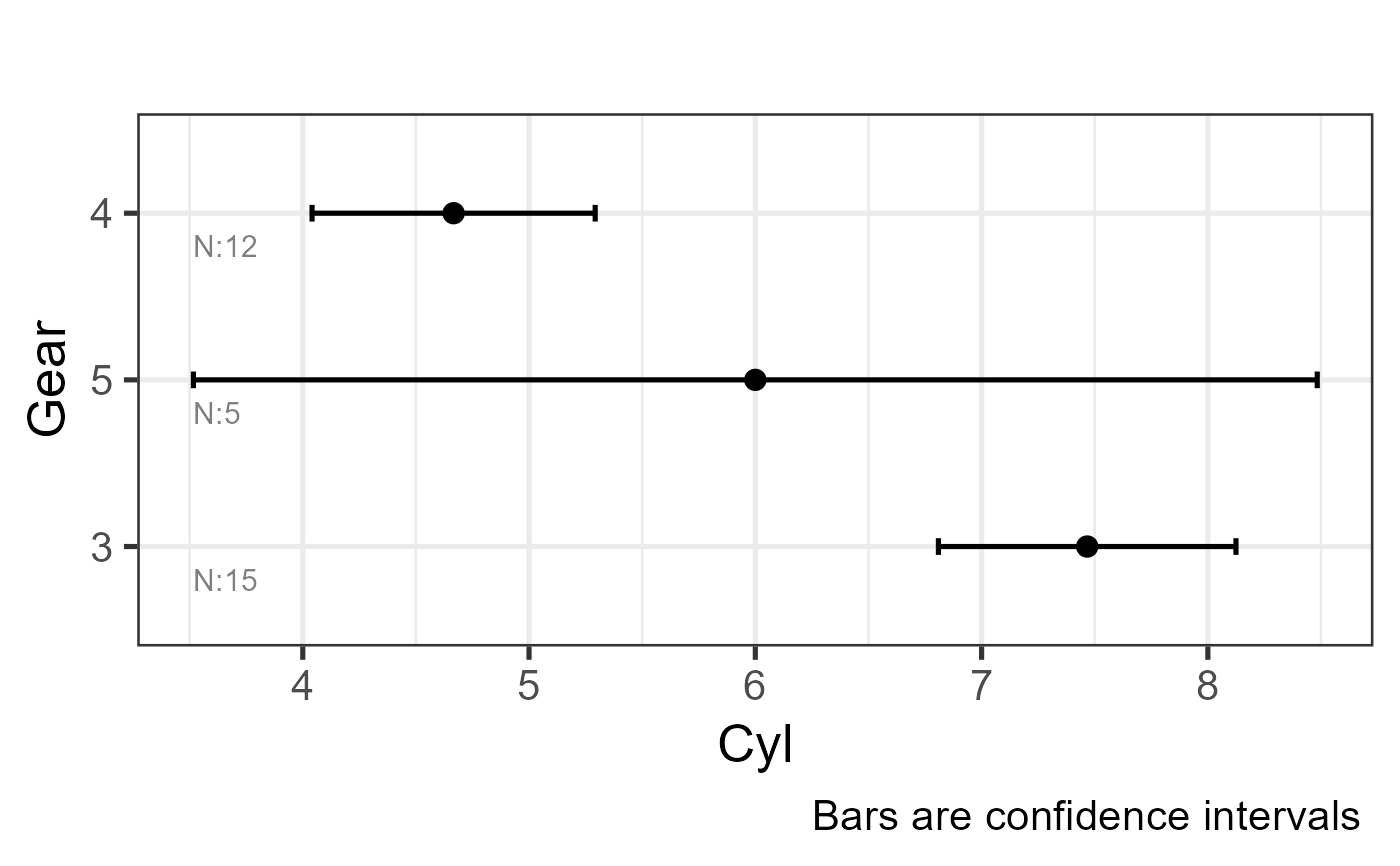
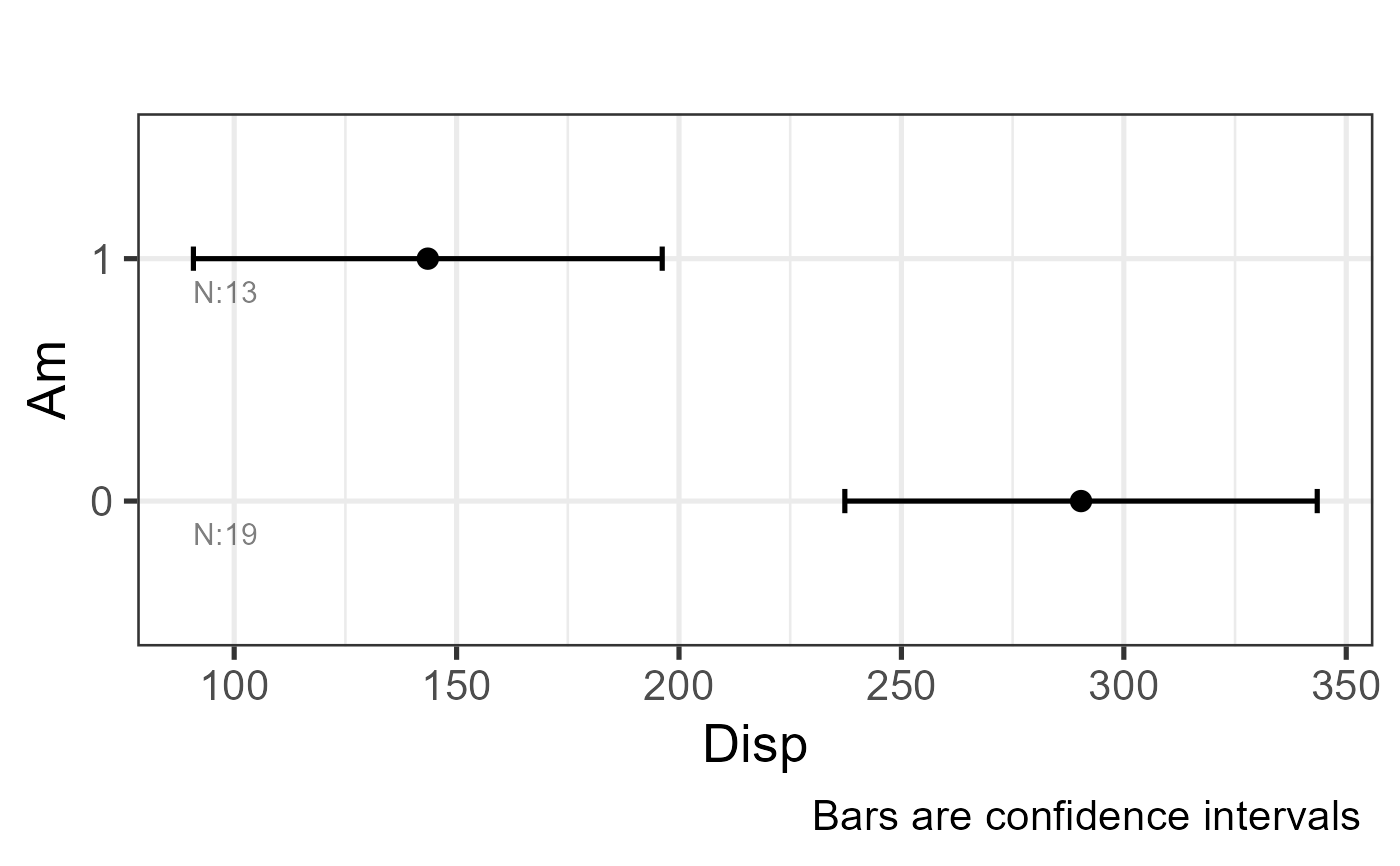
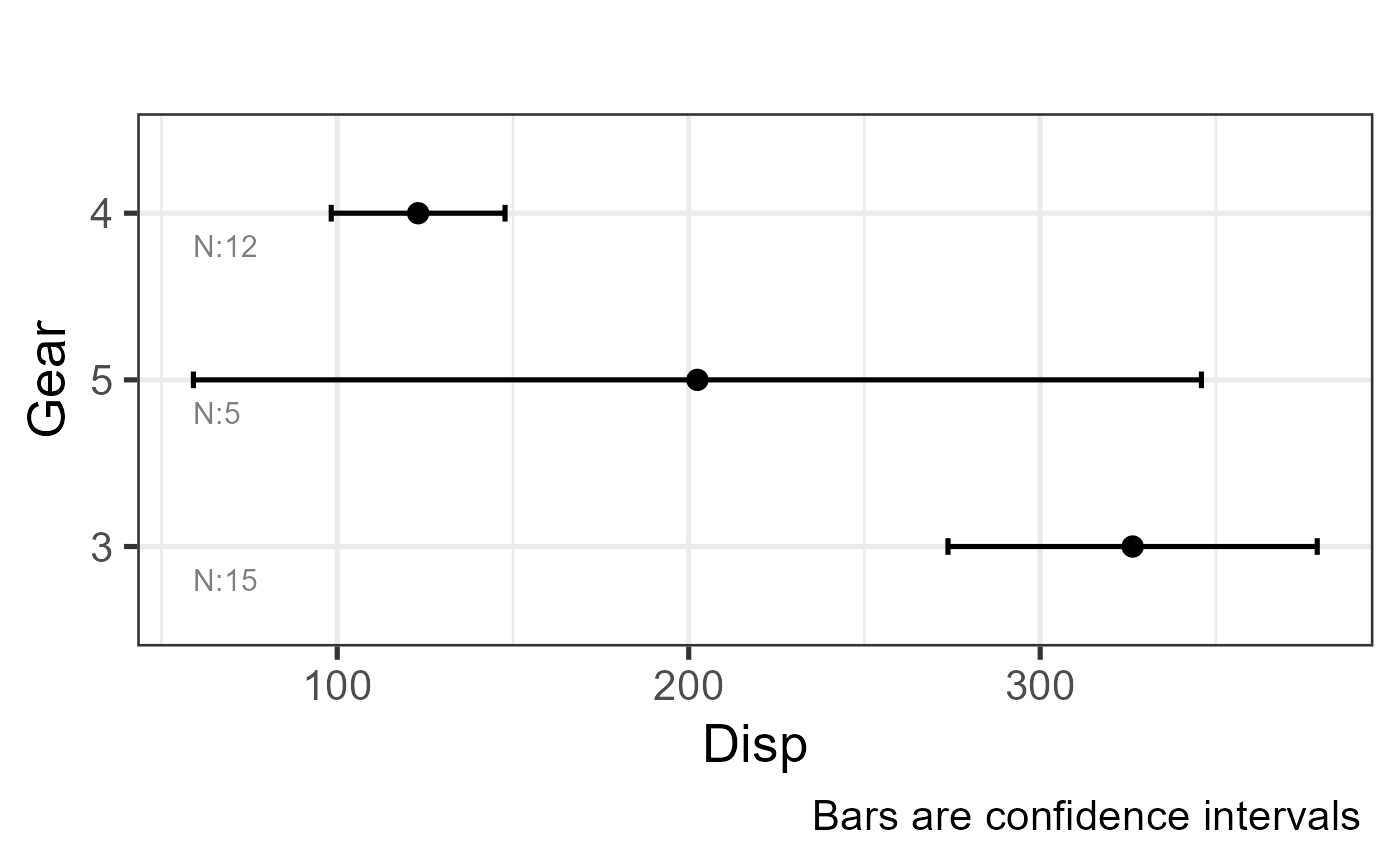
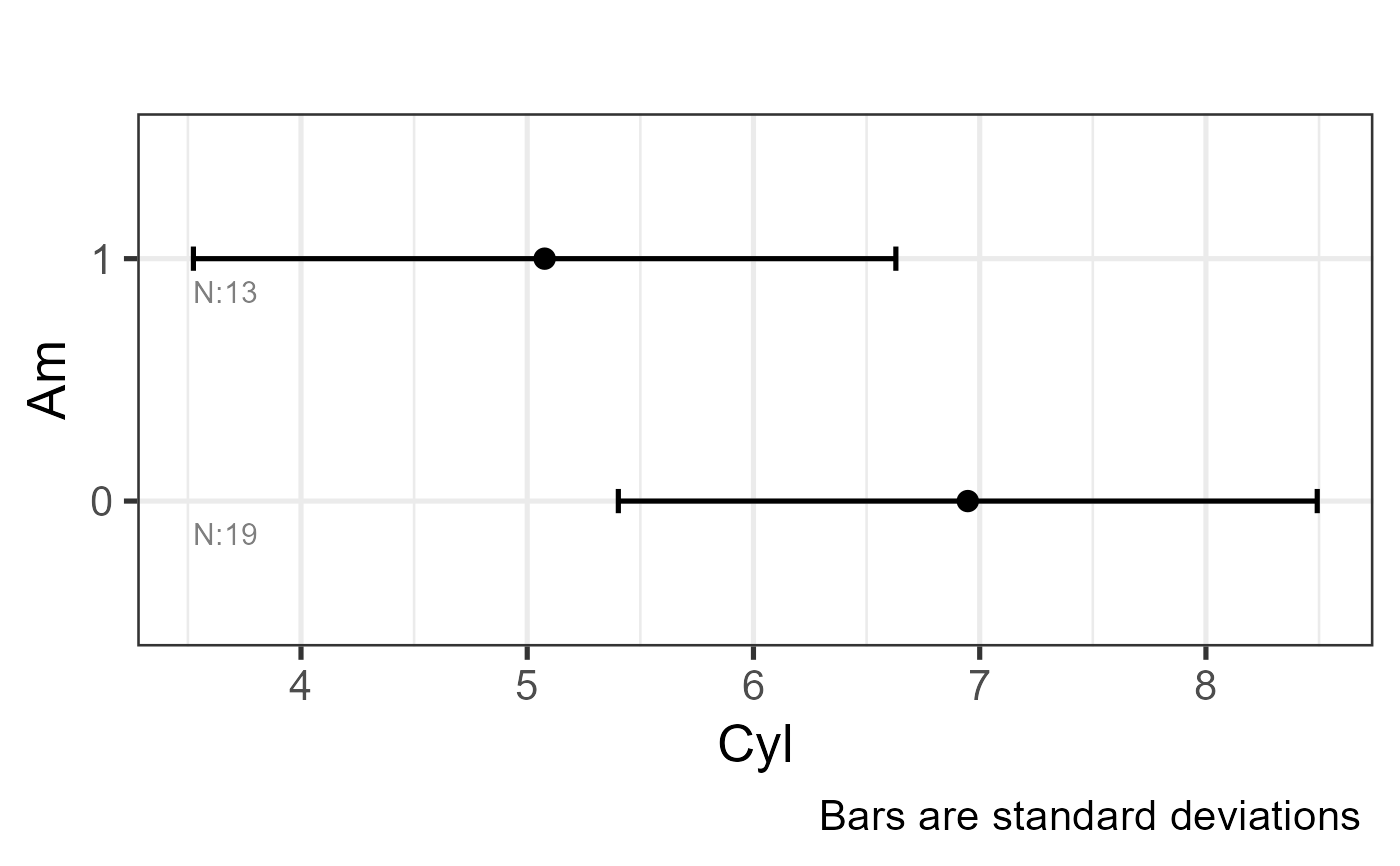
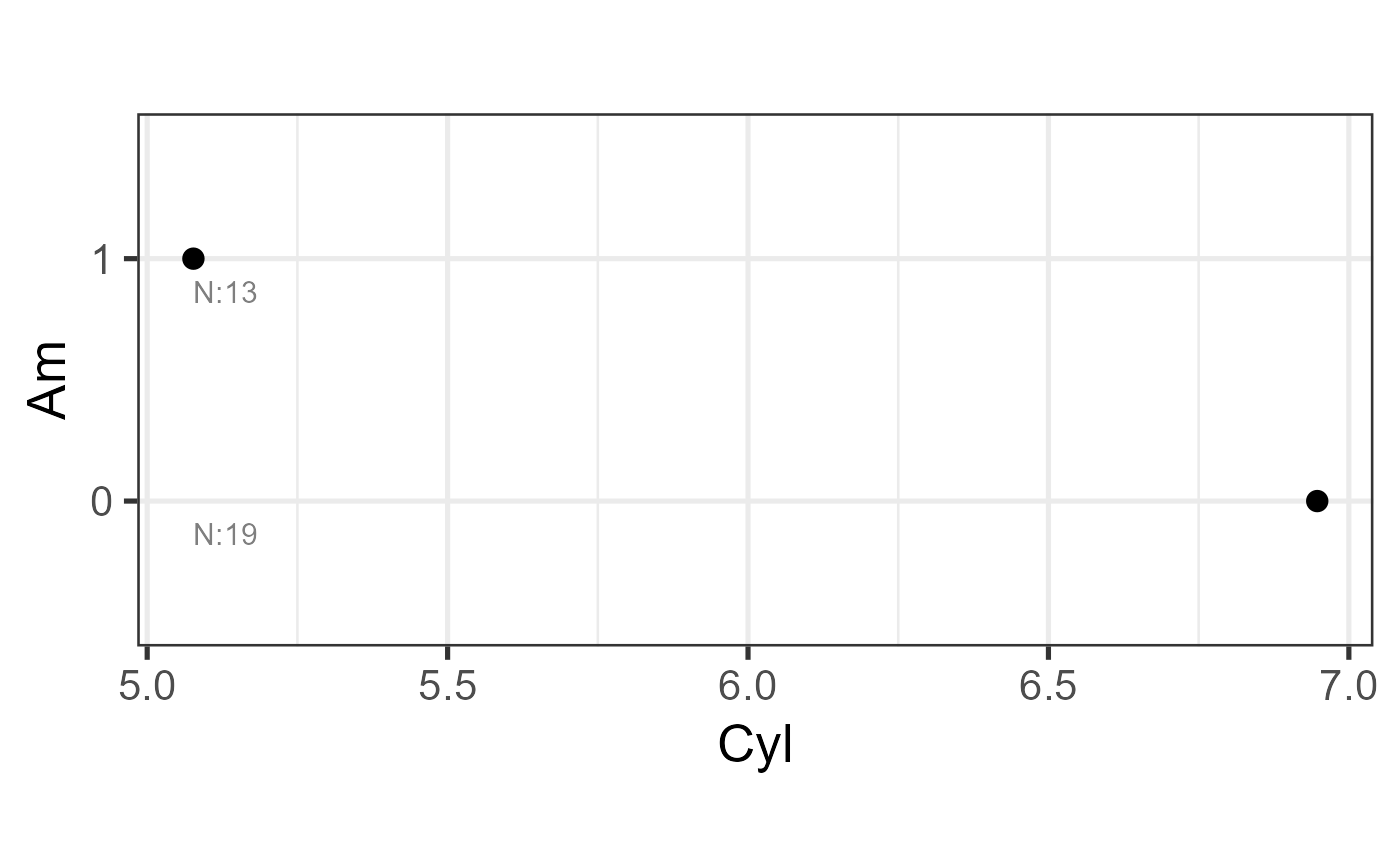
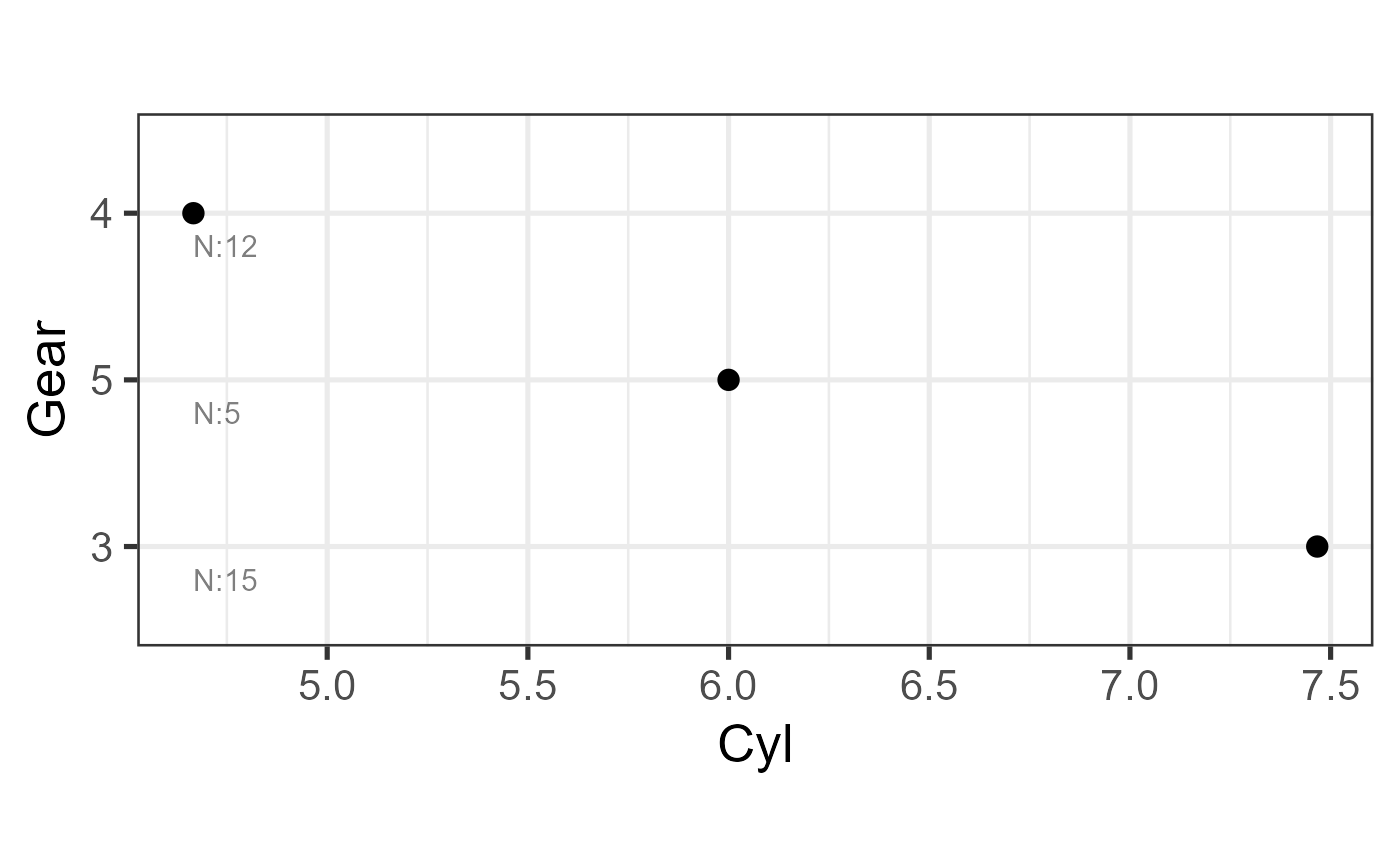
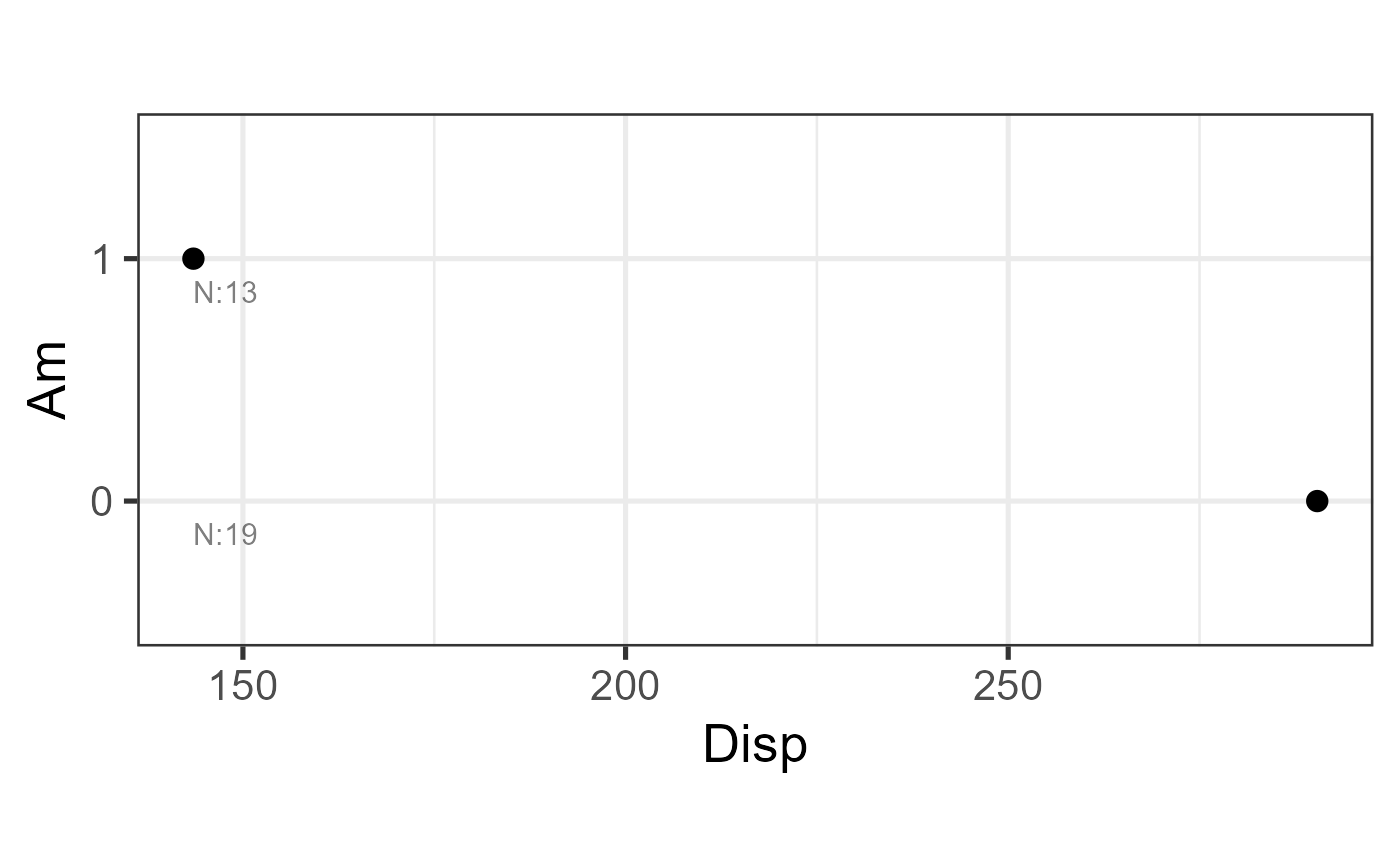
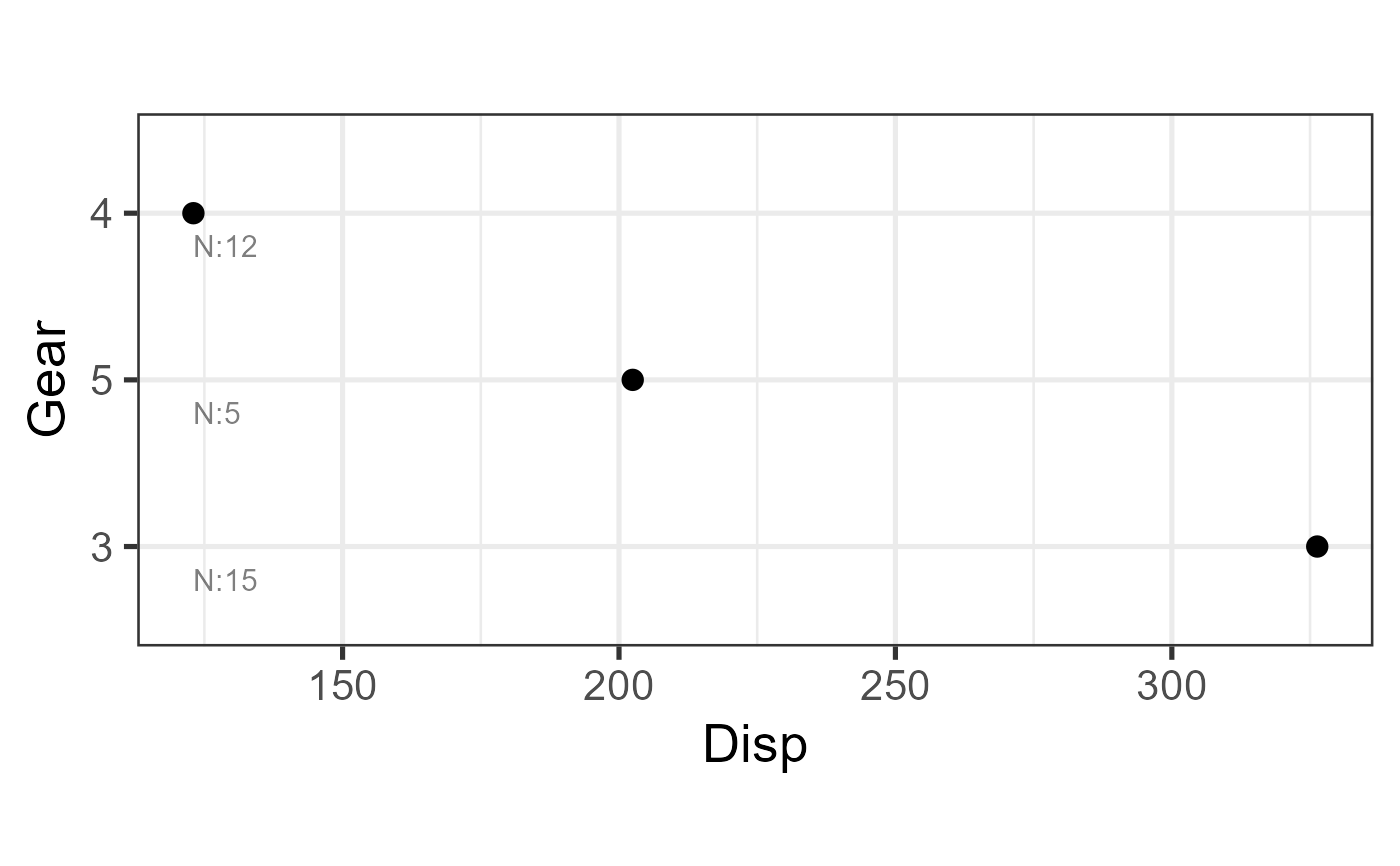
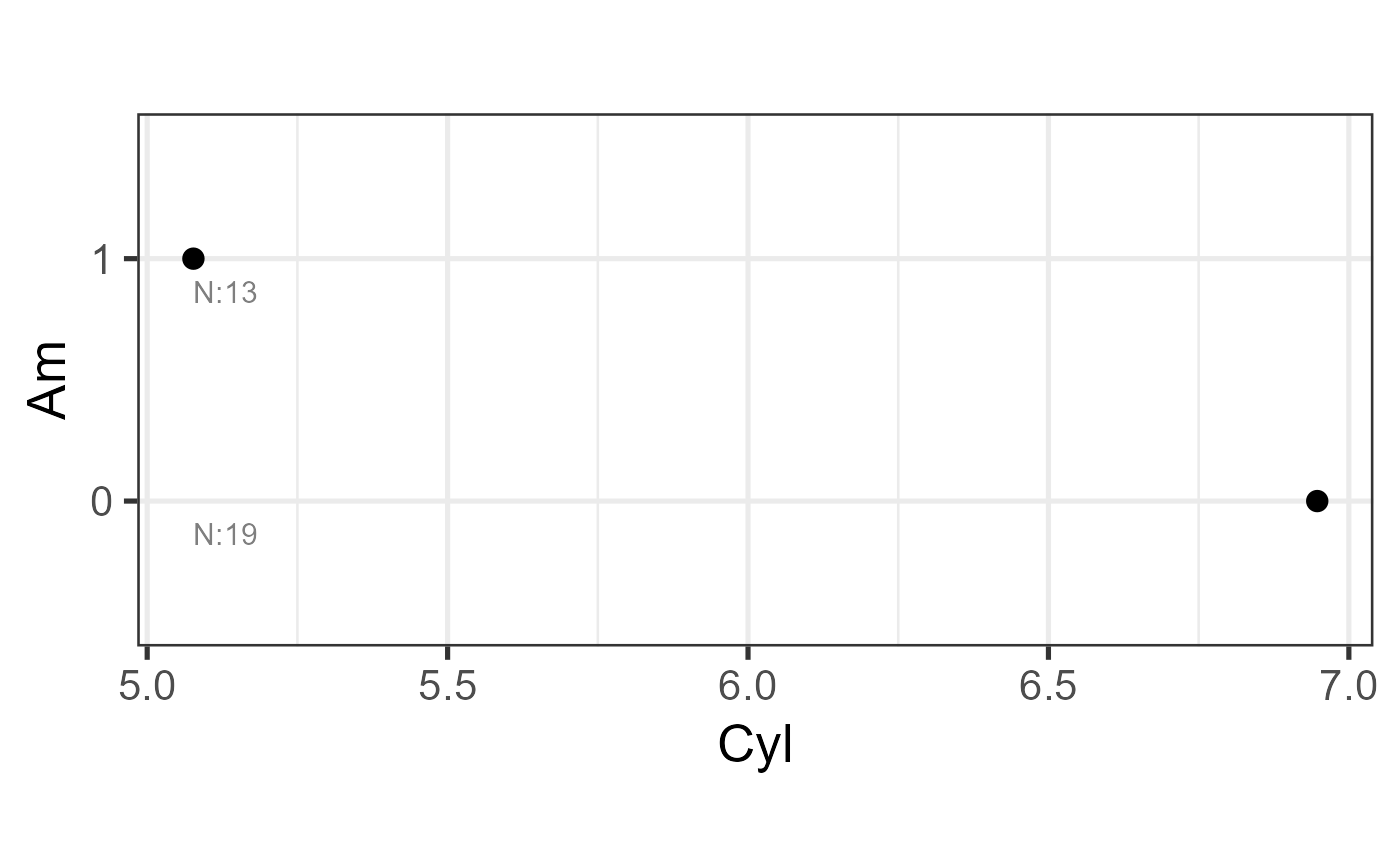
plot_oneway.RdFor every combination of independent variable (IV) and dependent variable (DV) supplied, produces a horizontal dot plot of group means with optional error bars (standard error, confidence interval, or standard deviation). Sample size per group is annotated on each panel.
When the number of IV-DV combinations exceeds four times the available CPU
cores the plots are produced in parallel via future.apply, otherwise
sequentially.
Usage
plot_oneway(
  df,
  dv,
  iv,
  base_size = 20,
  type = "se",
  order_factor = TRUE,
  title = "",
  note = "",
  width = 60
)
Arguments
- df
A data frame containing both the independent and dependent variables.
- dv
Integer vector of column indices for the continuous dependent variables.
- iv
Integer vector of column indices for the categorical independent variables. The columns are coerced to factors automatically.
- base_size
Base font size in pt passed to
theme_bw. Default20.- type
Type of error bar to display. One of
"se"(standard error),"ci"(95% confidence interval),"sd"(standard deviation), or""(no error bars). Default"se".- order_factor
Logical. If
TRUEfactor levels on the x-axis are sorted by the group mean of the DV (descending). DefaultTRUE.- title
Character. Plot title applied to every panel. Default
"".- note
Character. Caption / footnote appended to every panel. Default
"".- width
Integer. Character width at which long axis labels are wrapped. Default
60.
Value
A named list with three elements:
plot_data— named list of summary data frames as returned byRmisc::summarySE(one per IV-DV pair).plot_data_df— single data frame combining all summary data frames row-wise.plots— named list of ggplot objects (one per IV-DV pair).
All list elements are named "iv_dv".
Examples
nrows <- 1000
df <- data.frame(
generate_factor(vector = LETTERS[1:5], nrows = nrows, ncols = 10, type = "random"),
generate_data(nrows = nrows, ncols = 5, type = "normal")
)
result <- plot_oneway(df = df, dv = 11:15, iv = 1:10)
 # Single IV, single DV
plot_oneway(df = mtcars, dv = 2, iv = 9)
 # Multiple IVs and DVs
plot_oneway(df = mtcars, dv = 2:3, iv = 9:10)
 # Error bar types
plot_oneway(df = mtcars, dv = 2:3, iv = 9:10, type = "se")
 plot_oneway(df = mtcars, dv = 2:3, iv = 9:10, type = "ci")
 plot_oneway(df = mtcars, dv = 2:3, iv = 9:10, type = "sd")
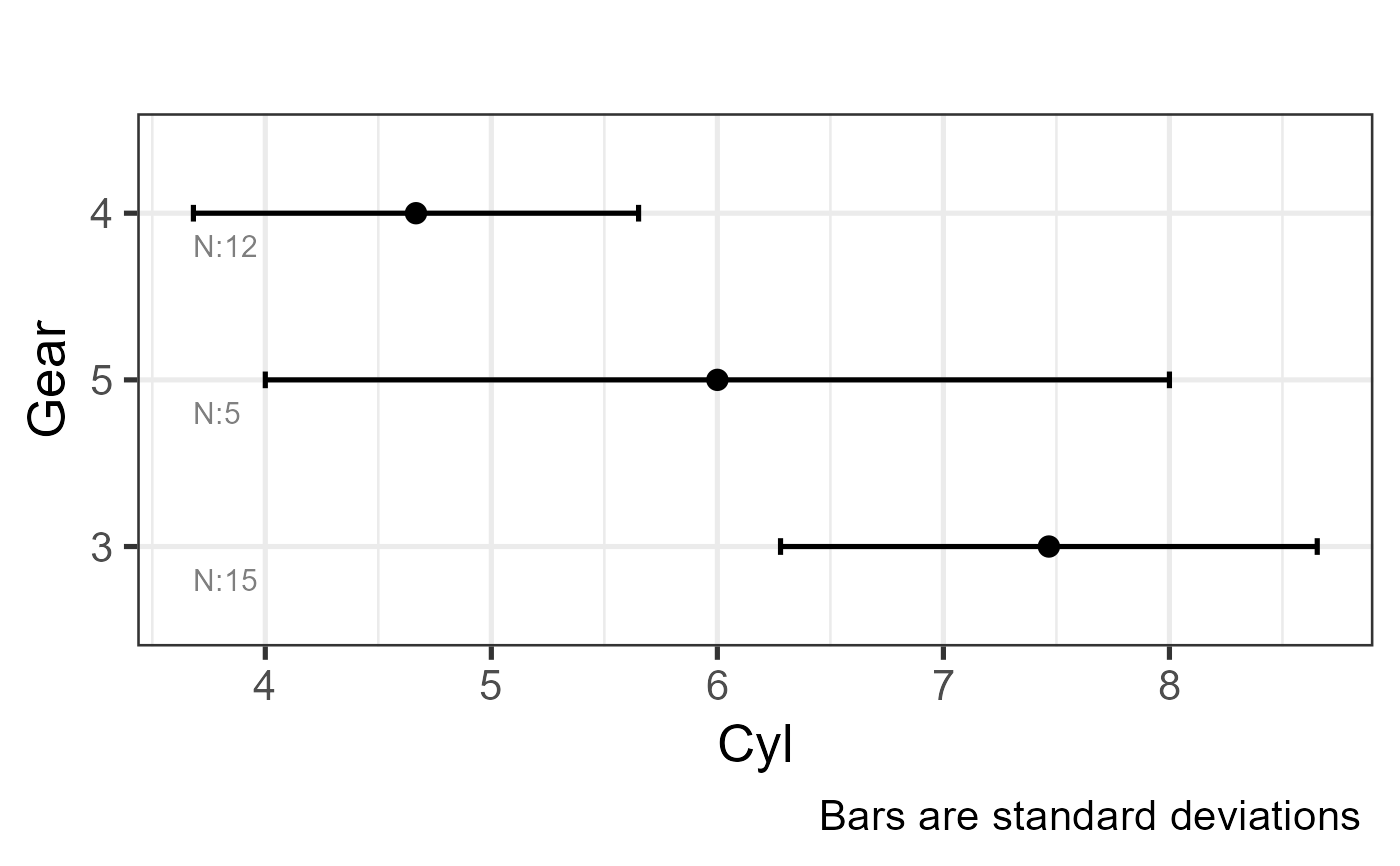
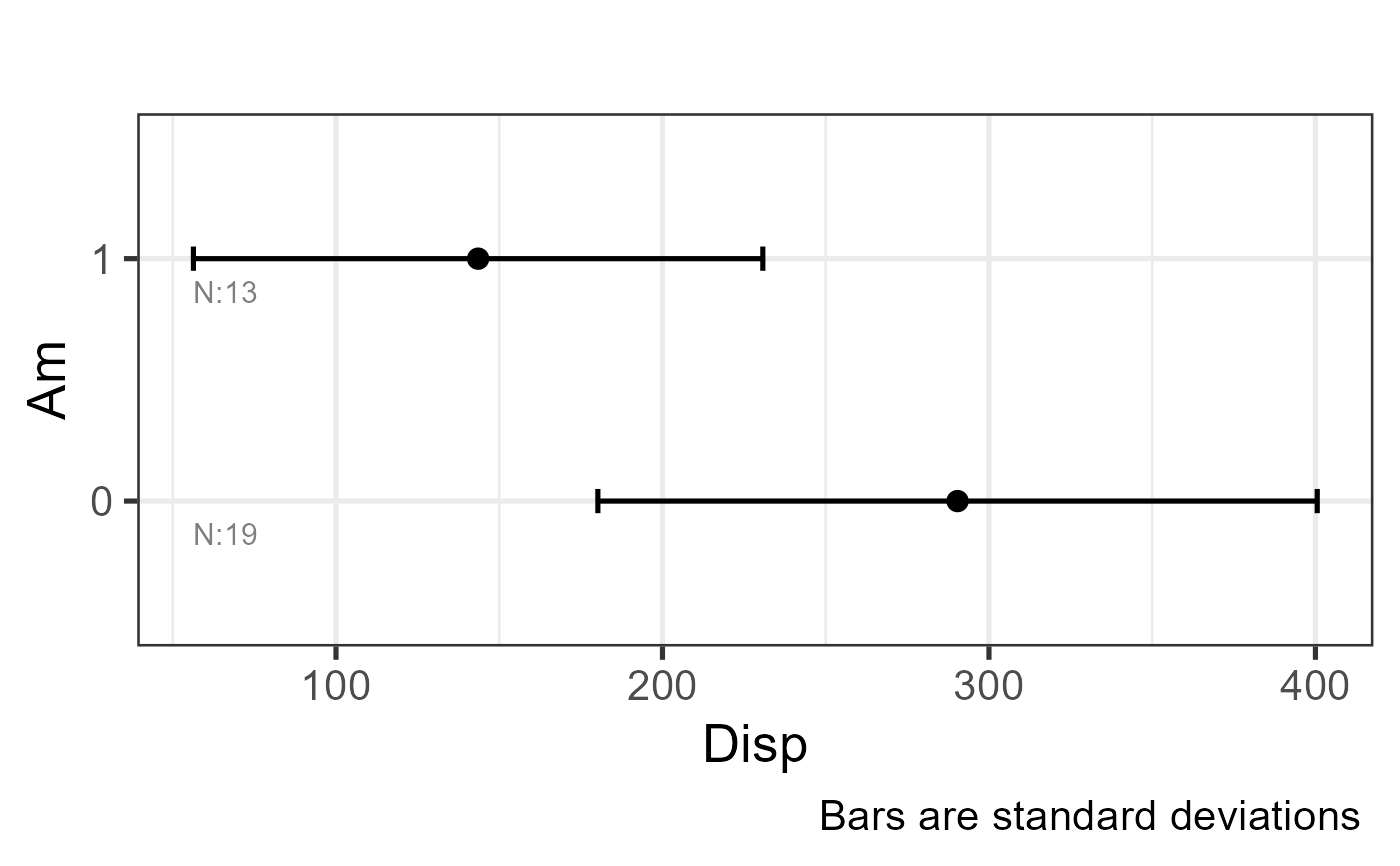
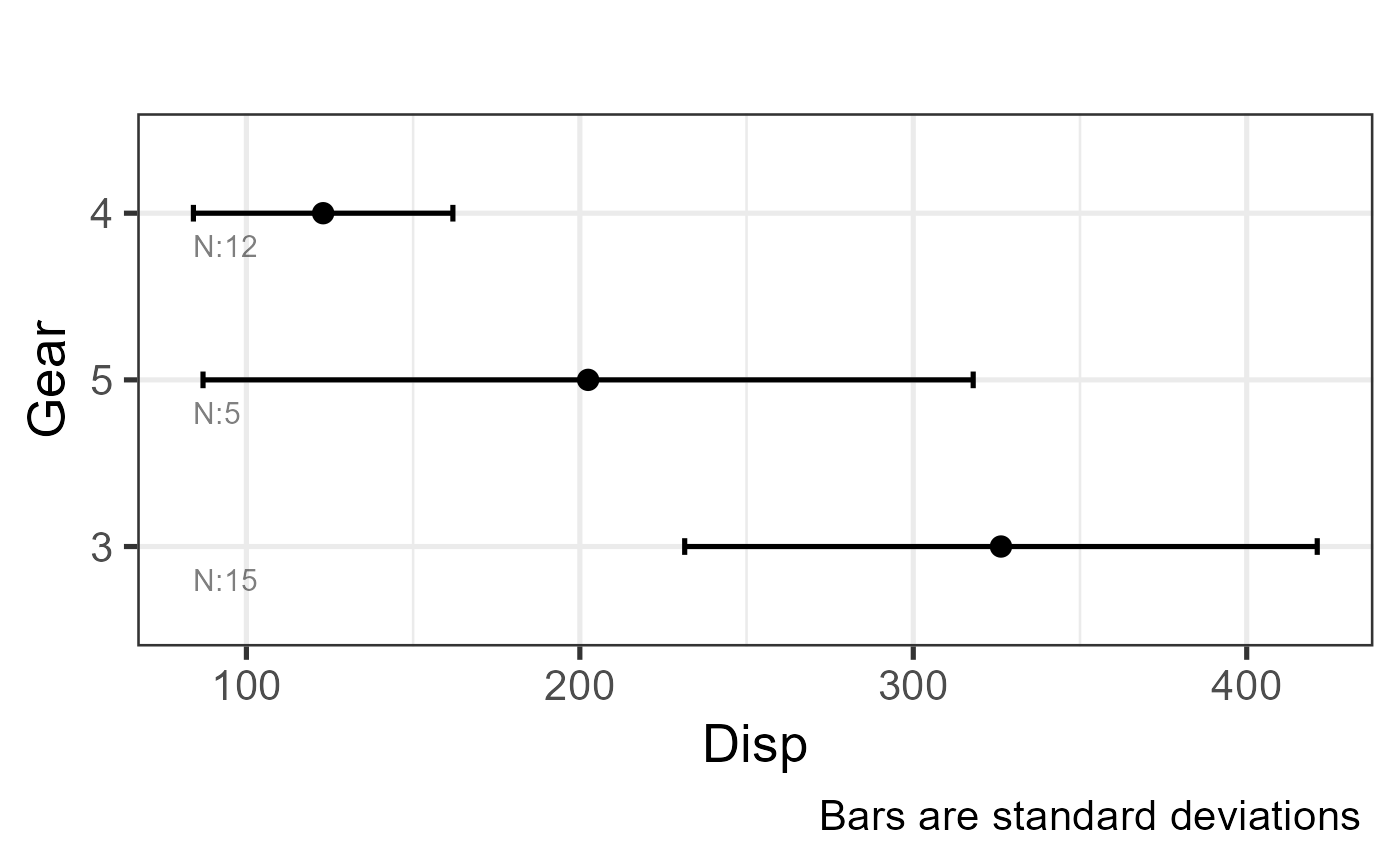 plot_oneway(df = mtcars, dv = 2:3, iv = 9:10, type = "")
 # Factor ordering
plot_oneway(df = mtcars, dv = 2:3, iv = 9:10, type = "", order_factor = FALSE)
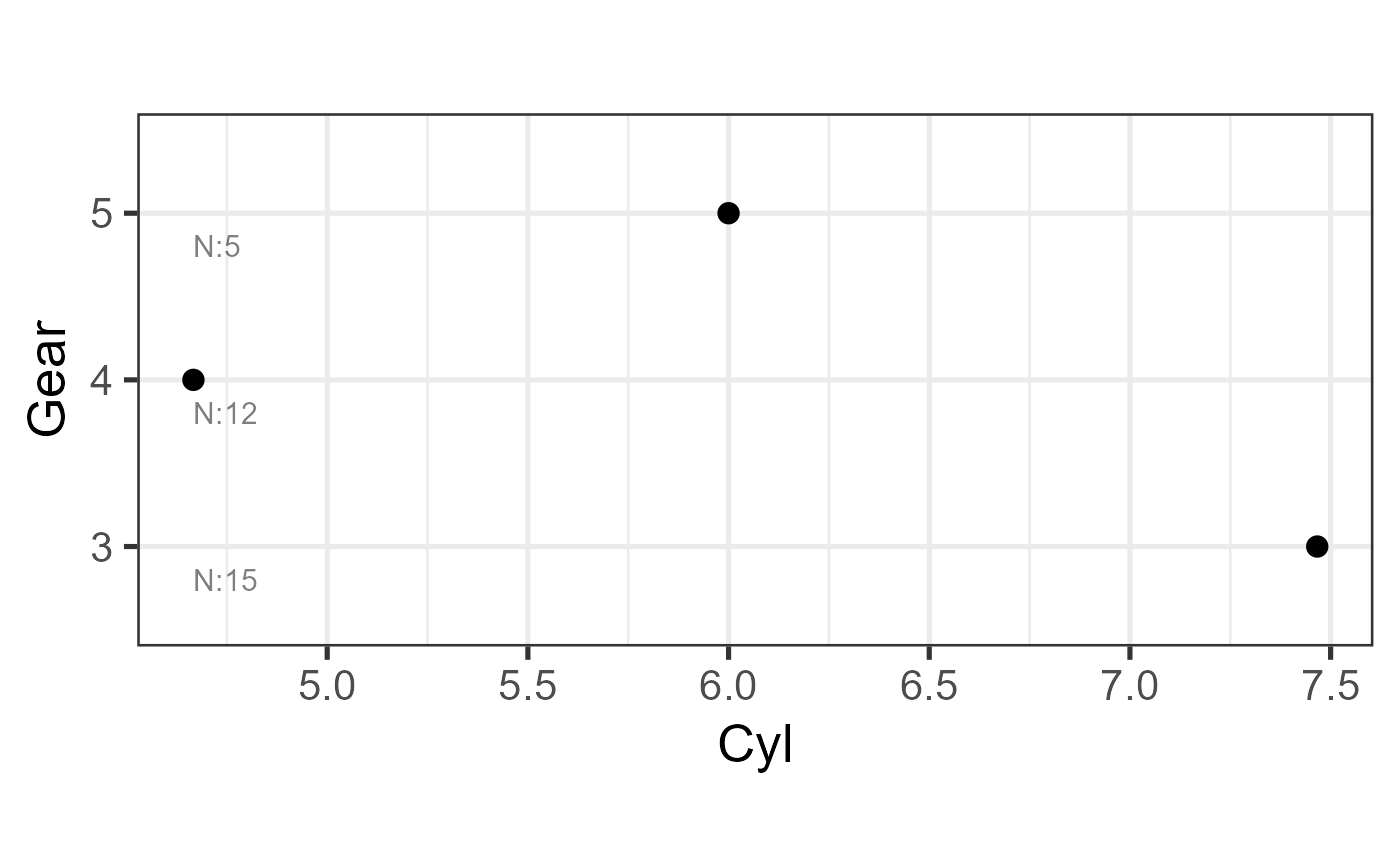
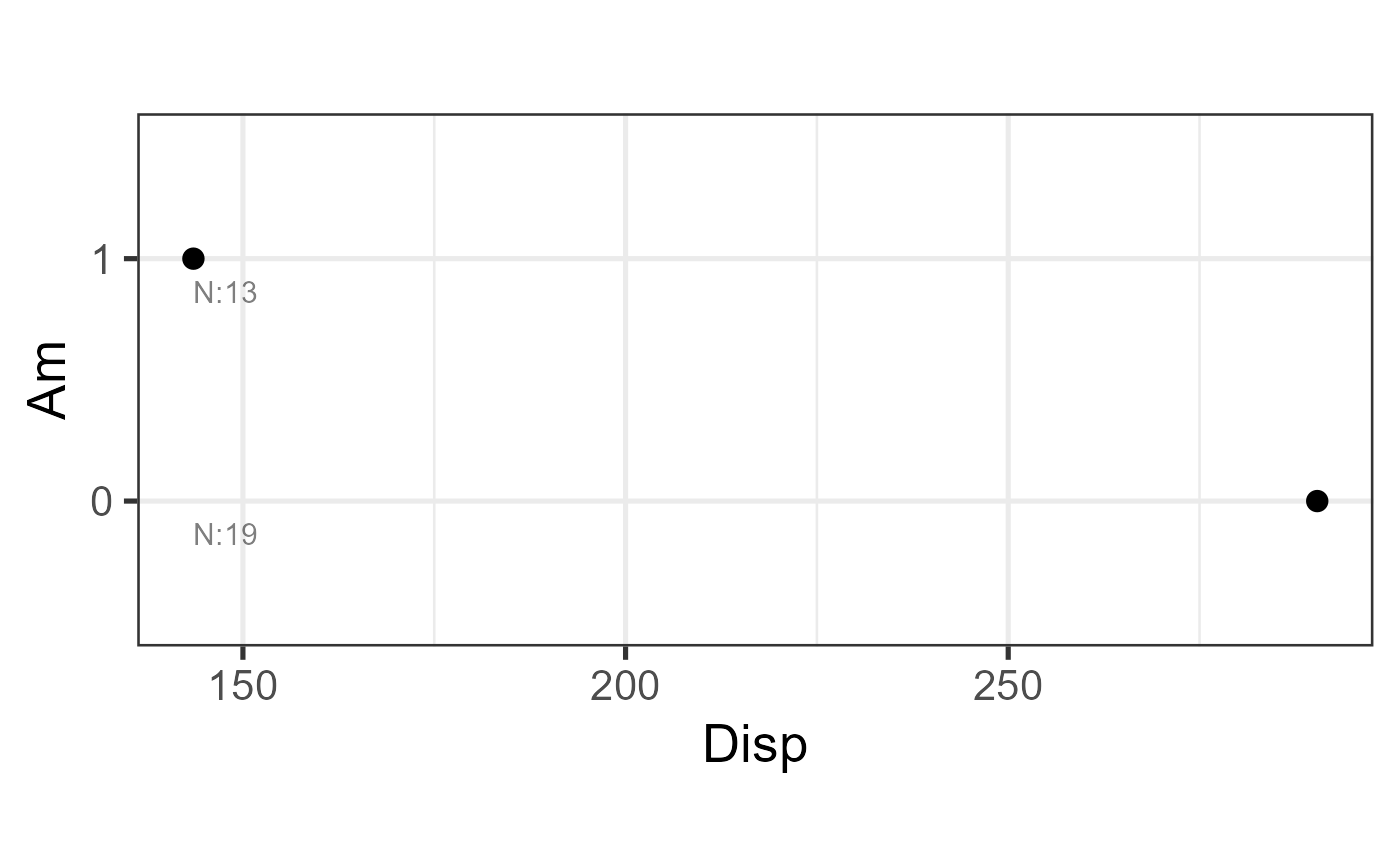
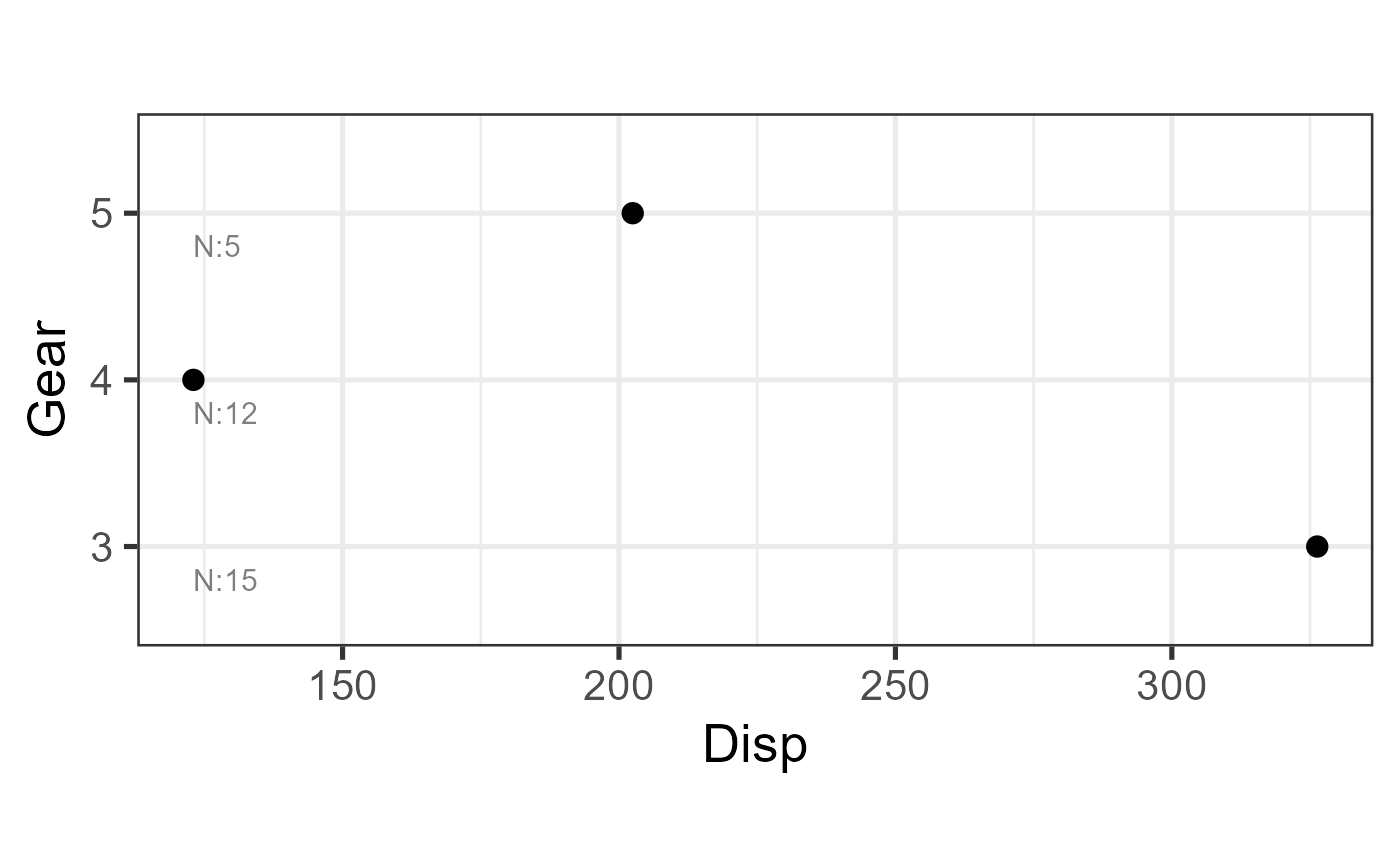 plot_oneway(df = mtcars, dv = 2:3, iv = 9:10, type = "", order_factor = TRUE)