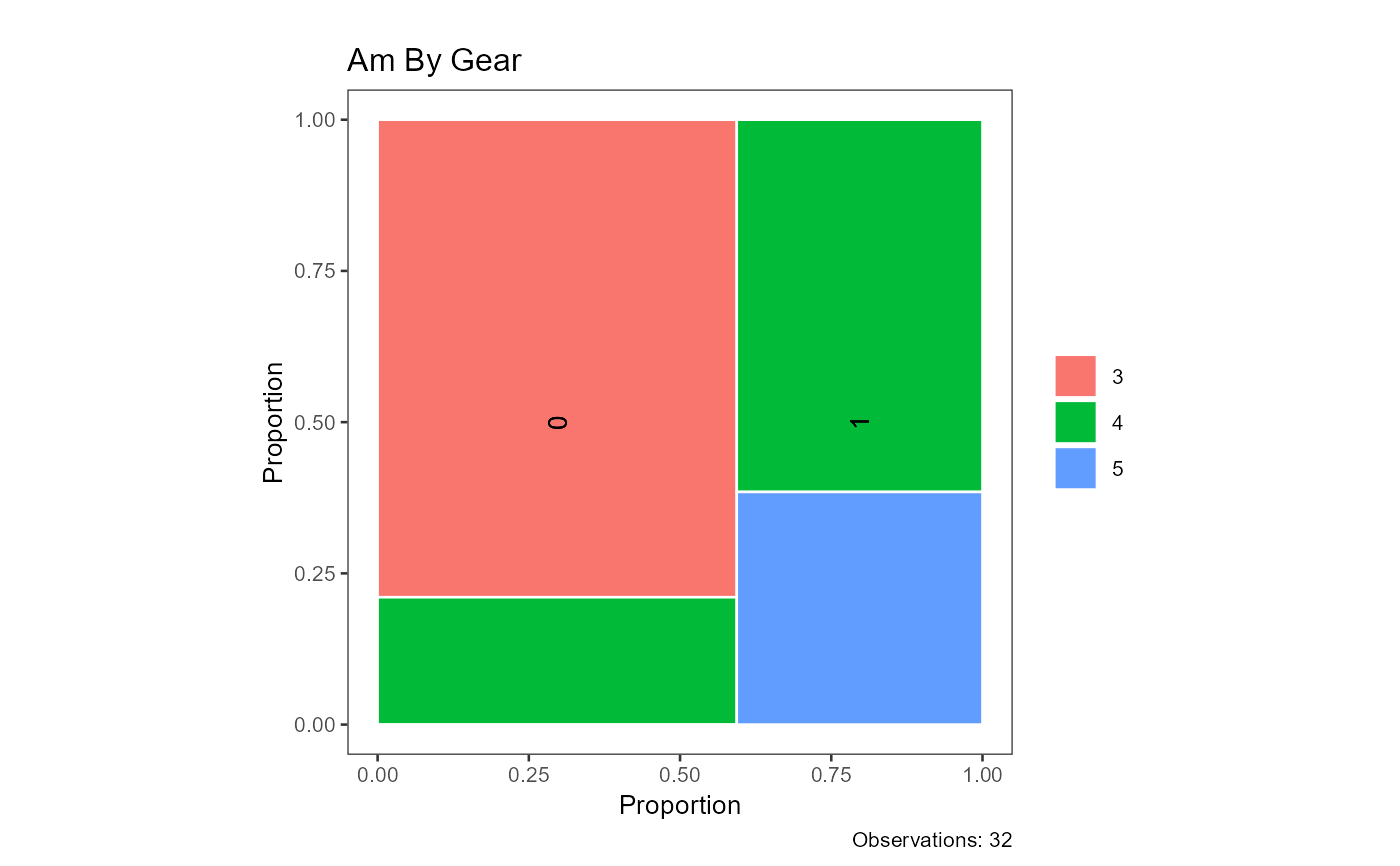
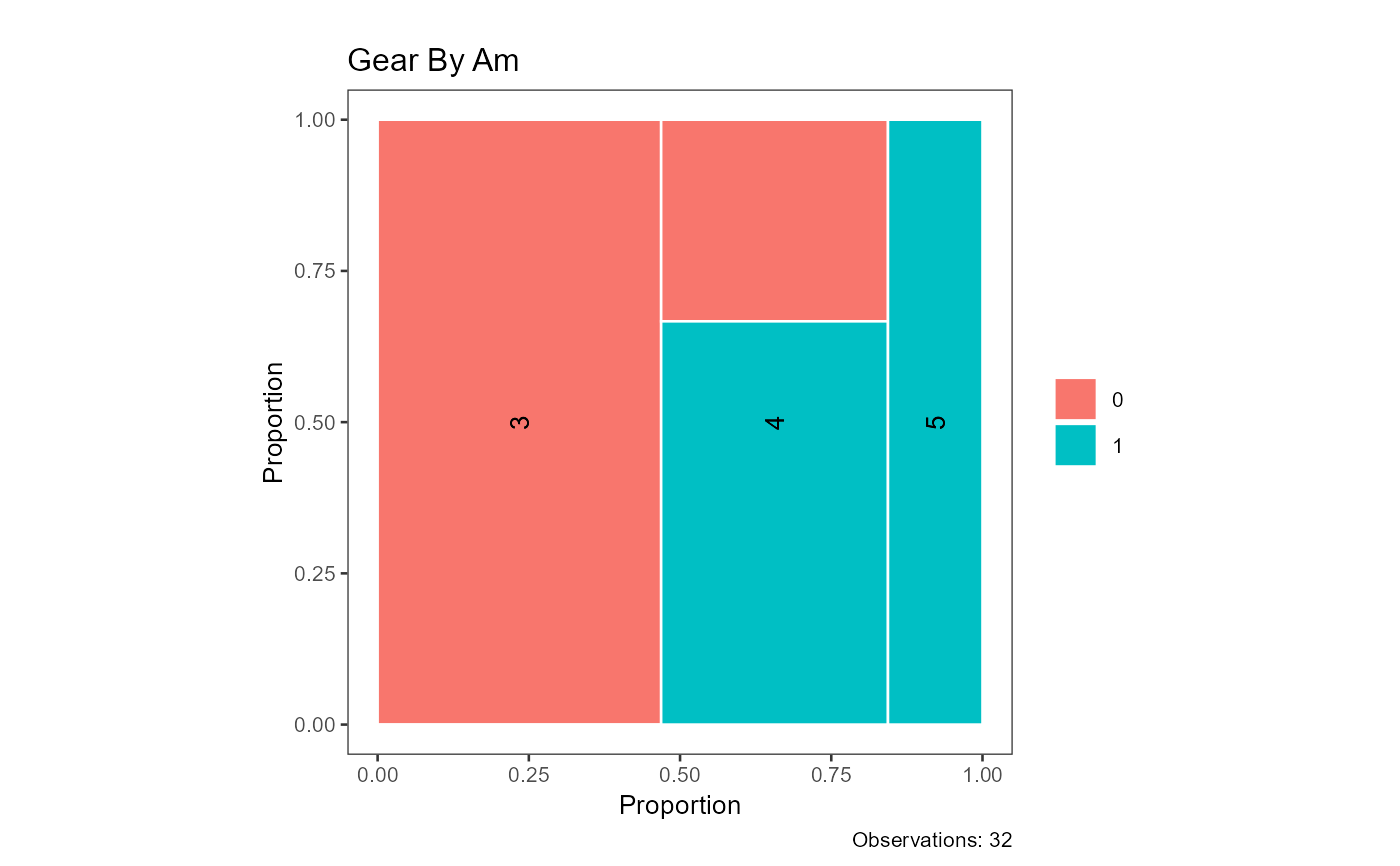
Creates a mosaic plot for every ordered pair of categorical
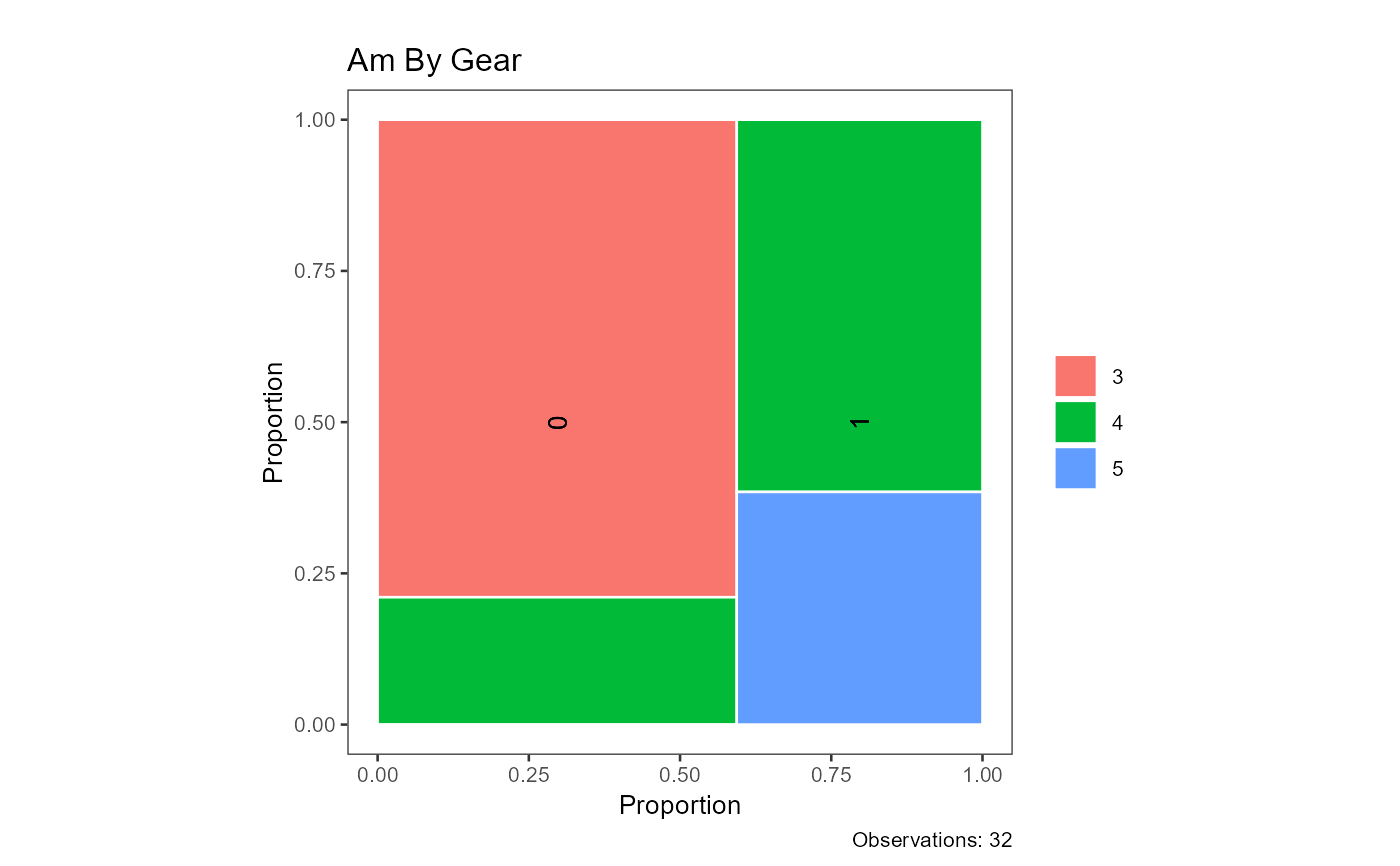
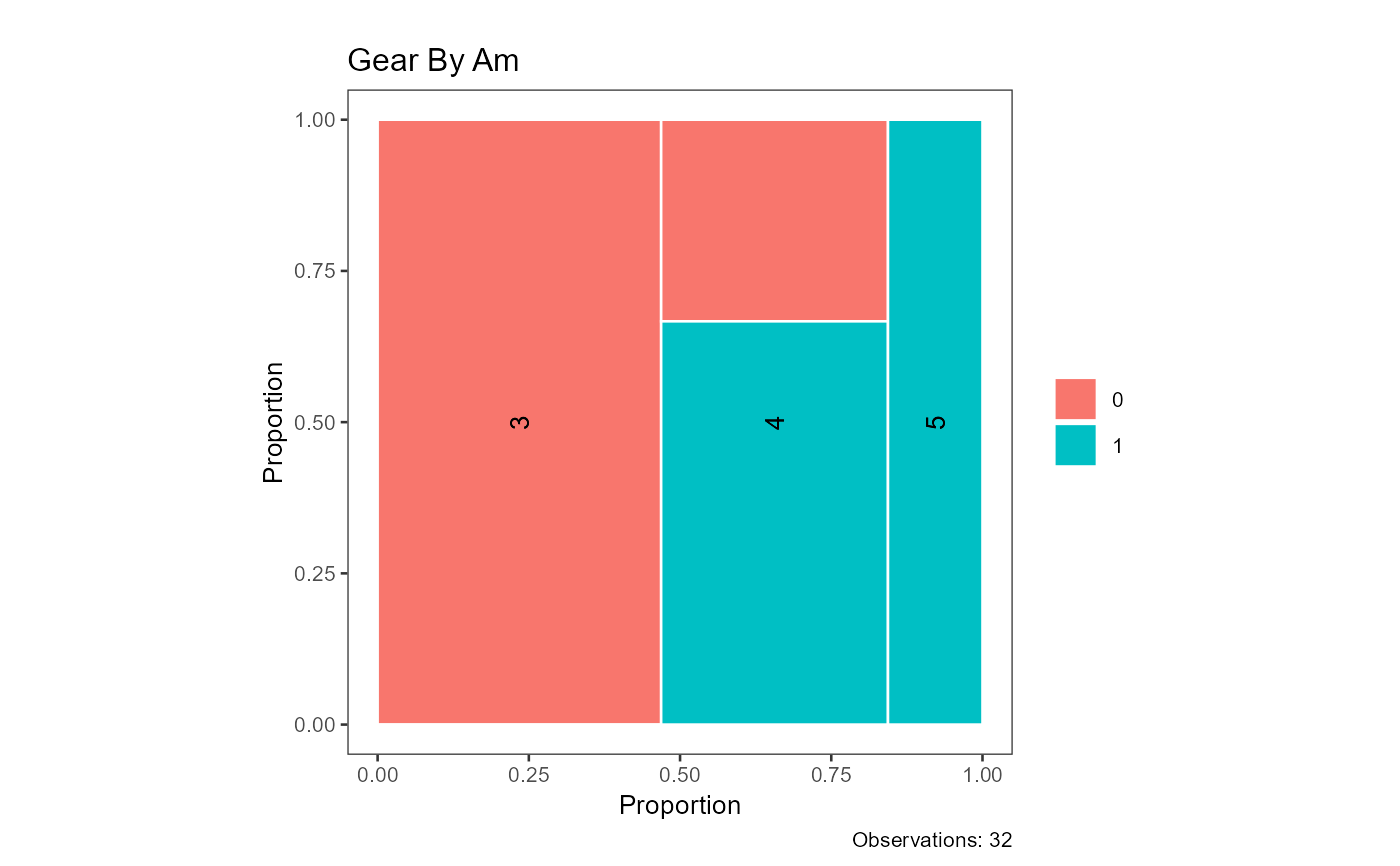
variables within factor_index. In each plot, bar widths represent
the marginal proportion of the first variable and bar heights represent
the conditional proportion of the second variable given the first,
making it straightforward to assess both marginal distributions and
conditional relationships simultaneously. Rows with missing values are
excluded pair-wise. A progress bar is displayed during computation.
Arguments
- df
A data frame containing the variables to plot.
- factor_index
Integer vector of column indices identifying the categorical variables. All ordered pairs of distinct columns are plotted.
- base_size
Base font size passed to
theme_bw(). Default is10.- title
Character string prepended to each plot title. Default is
"".- pb
Logical; whether to display a progress bar in the console. Default is
FALSE.
Value
A named list of ggplot objects, one per ordered variable
pair. Each element is named "var1 var2" and shows a mosaic chart
with bar widths proportional to the marginal distribution of var1,
bar heights proportional to the conditional distribution of var2
given var1, and total complete-case observations in the caption.
Variables with fewer than two observed levels are handled gracefully by
adding a placeholder level.
Examples
plot_mosaic(df = mtcars, factor_index = 8:9)
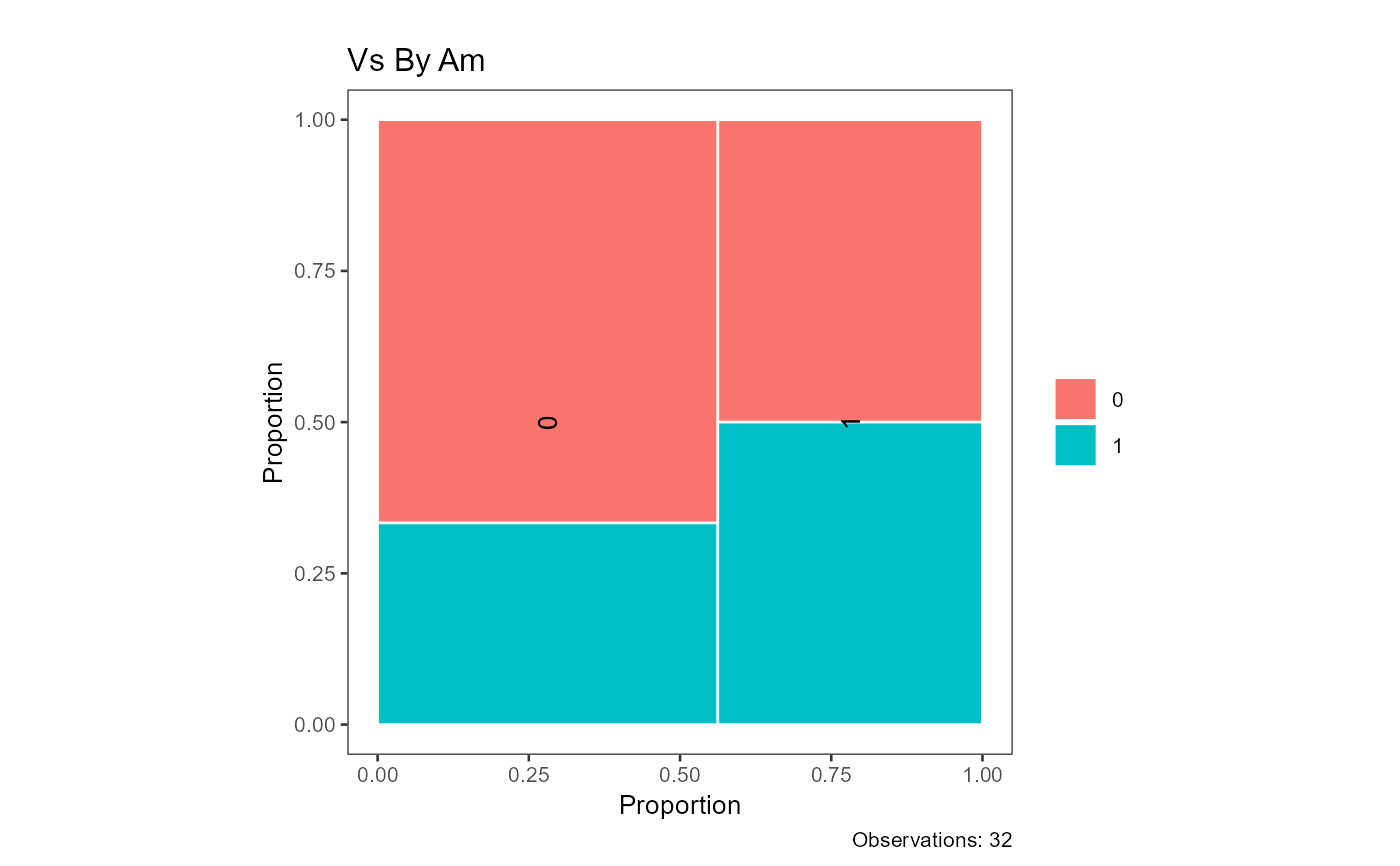
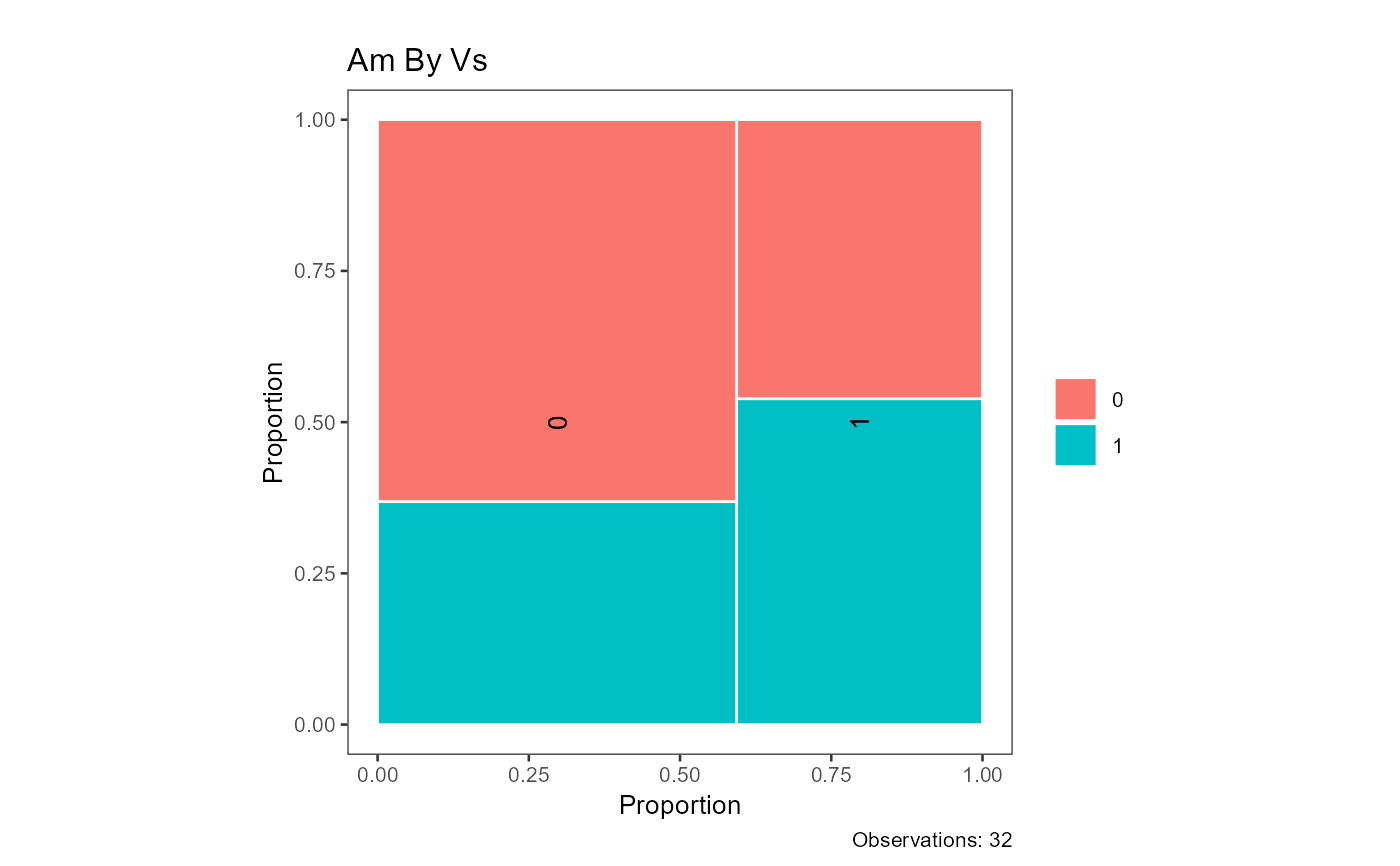 plot_mosaic(df = mtcars, factor_index = 9:10)
 plot_mosaic(df = mtcars, factor_index = 9:10, pb = TRUE)
#>
|
| | 0%
|
|=============================================================================================== | 50%
|
|==============================================================================================================================================================================================| 100%