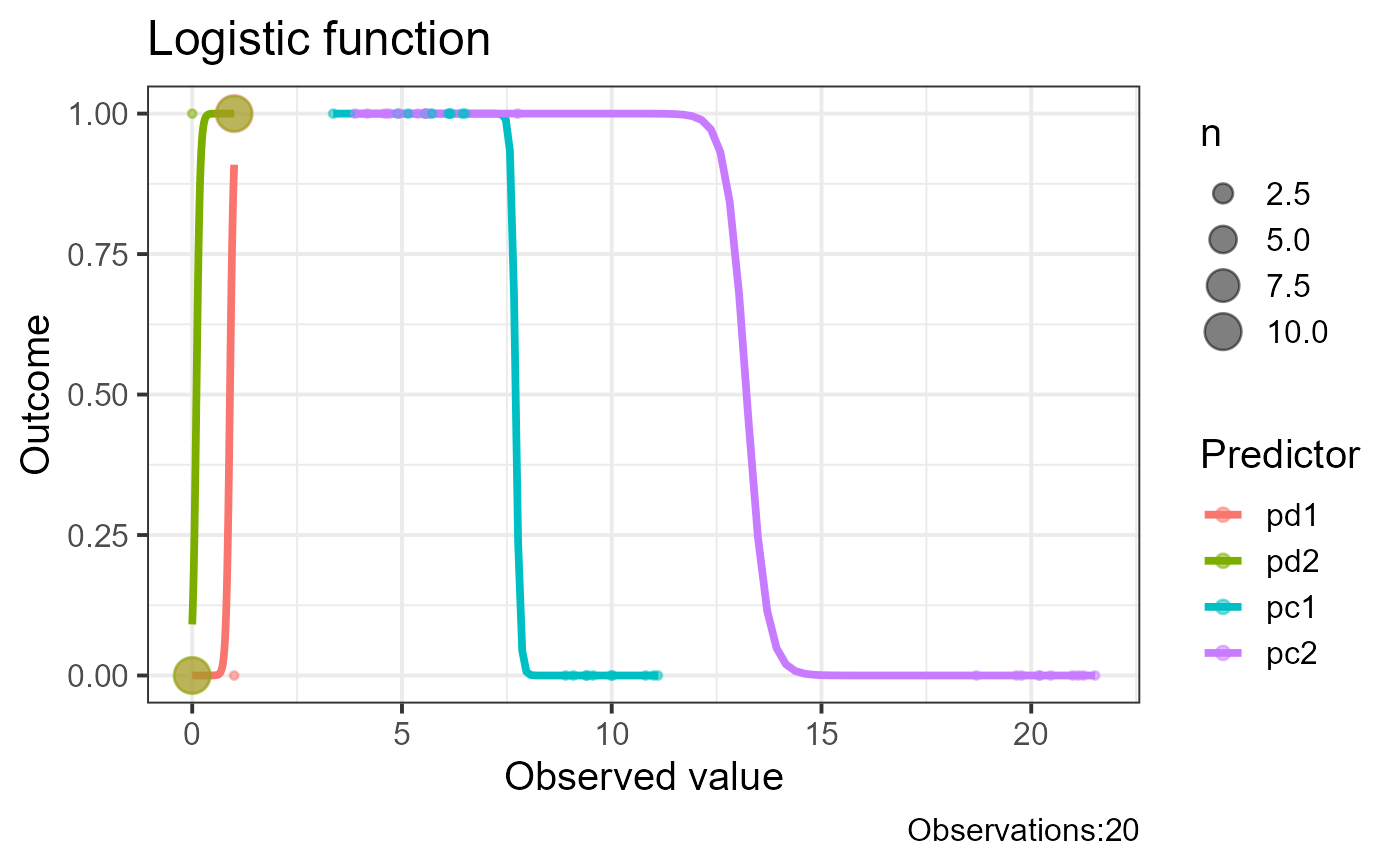
Logistic model plot
Examples
df<-data.frame(outcome=c(rep(1,10),rep(0,10)),
               pd1=c(rep(1,11),rep(0,9)),
               pd2=c(rep(1,9),rep(0,11)),
               pc1=c(rnorm(10,mean=5),rnorm(10,mean=10)),
               pc2=c(rnorm(10,mean=5),rnorm(10,mean=20)))
plot_logistic_model(df=df,base_size=15)
#> `geom_smooth()` using formula = 'y ~ x'
#> Warning: glm.fit: fitted probabilities numerically 0 or 1 occurred
#> Warning: glm.fit: fitted probabilities numerically 0 or 1 occurred