Plot a confusion matrix with the full set of derived measures
Source:R/FUNCTIONS_TRAIN_TEST.R
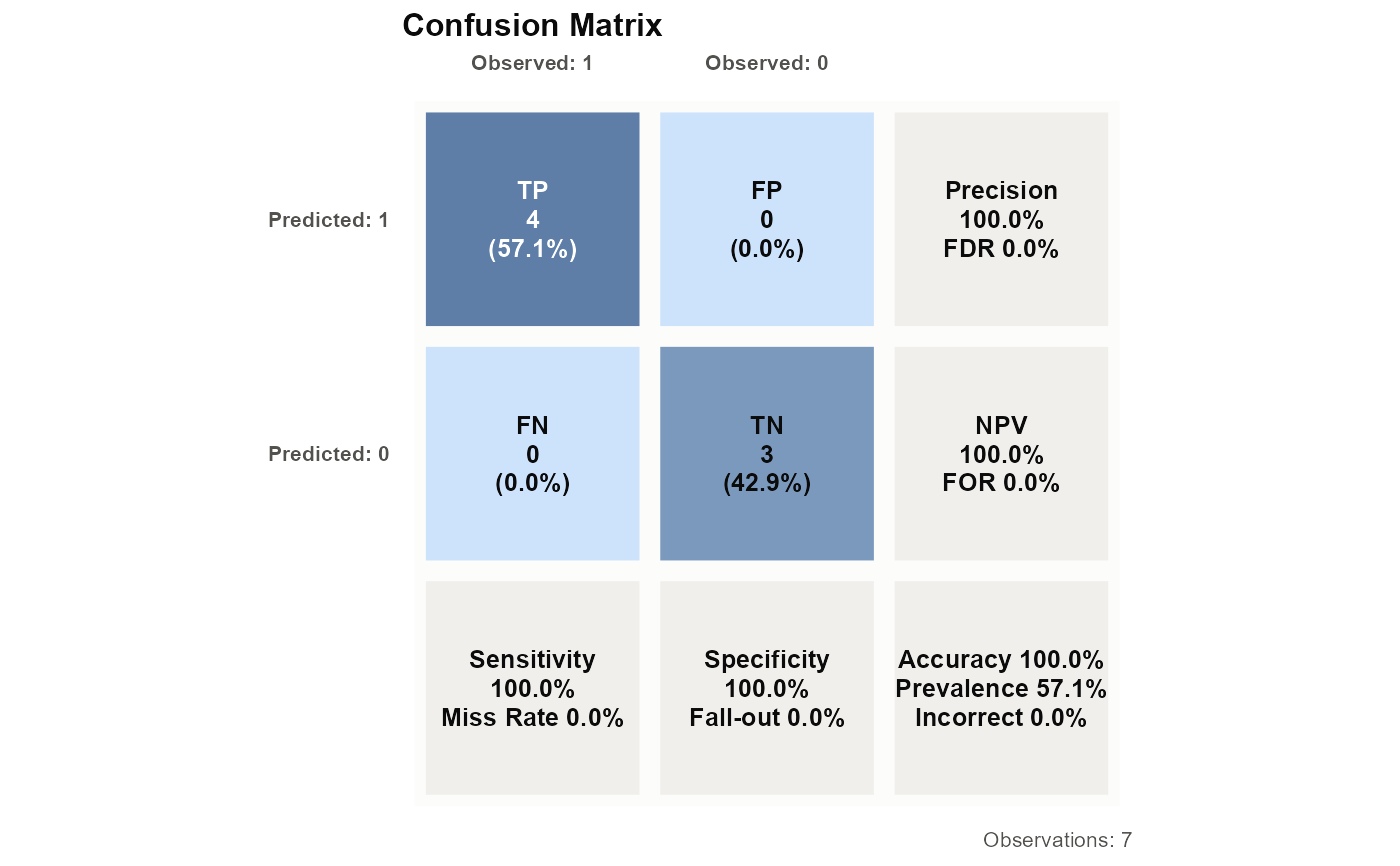
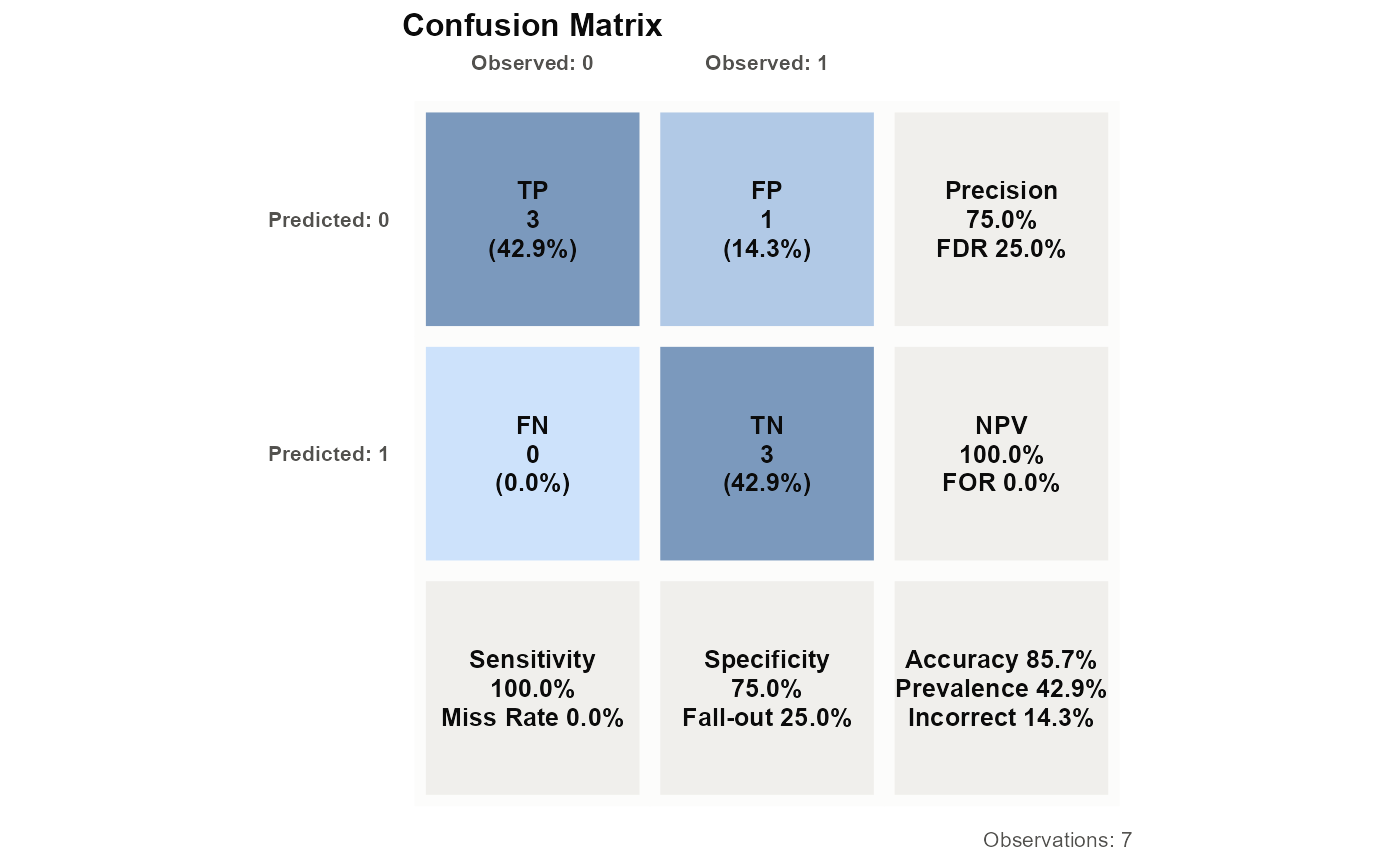
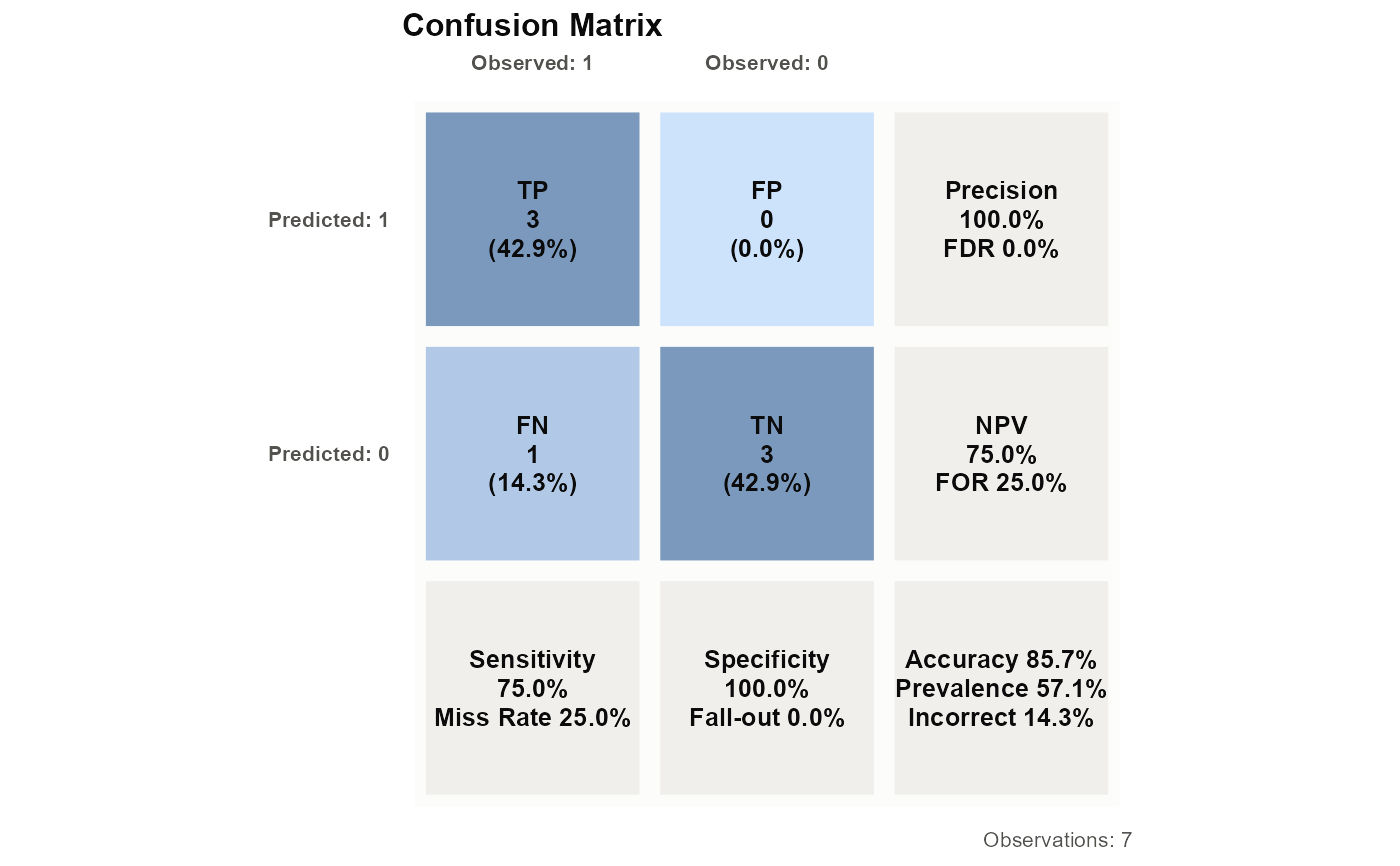
plot_confusion_extended.RdDraws a 2x2 confusion matrix (raw counts, shaded blue by magnitude) alongside the row, column and overall measures:
- Total measures
Accuracy, Prevalence, Proportion Incorrectly Classified
- Horizontal measures
Sensitivity / Miss Rate (observed positive column), Specificity / Fall-out (observed negative column)
- Vertical measures
Precision / False Discovery Rate (predicted positive row), Negative Predictive Value / False Omission Rate (predicted negative row)
Arguments
- observed
Vector of true class labels (2 unique values).
- predicted
Vector of predicted class labels (2 unique values, same domain).
- positive
Value treated as the positive class. Defaults to the second sorted level (matches rwf's
confusion()convention).- base_size
Base font size. Default 10.
- title
Plot title suffix.
Details
With \(TP\), \(TN\), \(FP\) and \(FN\) the numbers of true positives, true negatives, false positives and false negatives, and \(N = TP + TN + FP + FN\) the total number of cases:
- Accuracy
\(\frac{TP + TN}{N}\)
- Prevalence
\(\frac{TP + FN}{N}\)
- Proportion Incorrectly Classified
\(\frac{FN + FP}{N} = 1 - \mathrm{Accuracy}\)
- Sensitivity (true positive rate, recall)
\(\frac{TP}{TP + FN}\)
- Miss Rate (false negative rate)
\(\frac{FN}{TP + FN} = 1 - \mathrm{Sensitivity}\)
- Specificity (true negative rate)
\(\frac{TN}{FP + TN}\)
- Fall-out (false positive rate)
\(\frac{FP}{FP + TN} = 1 - \mathrm{Specificity}\)
- Precision (positive predictive value)
\(\frac{TP}{TP + FP}\)
- False Discovery Rate
\(\frac{FP}{TP + FP} = 1 - \mathrm{Precision}\)
- Negative Predictive Value
\(\frac{TN}{FN + TN}\)
- False Omission Rate
\(\frac{FN}{FN + TN} = 1 - \mathrm{NPV}\)