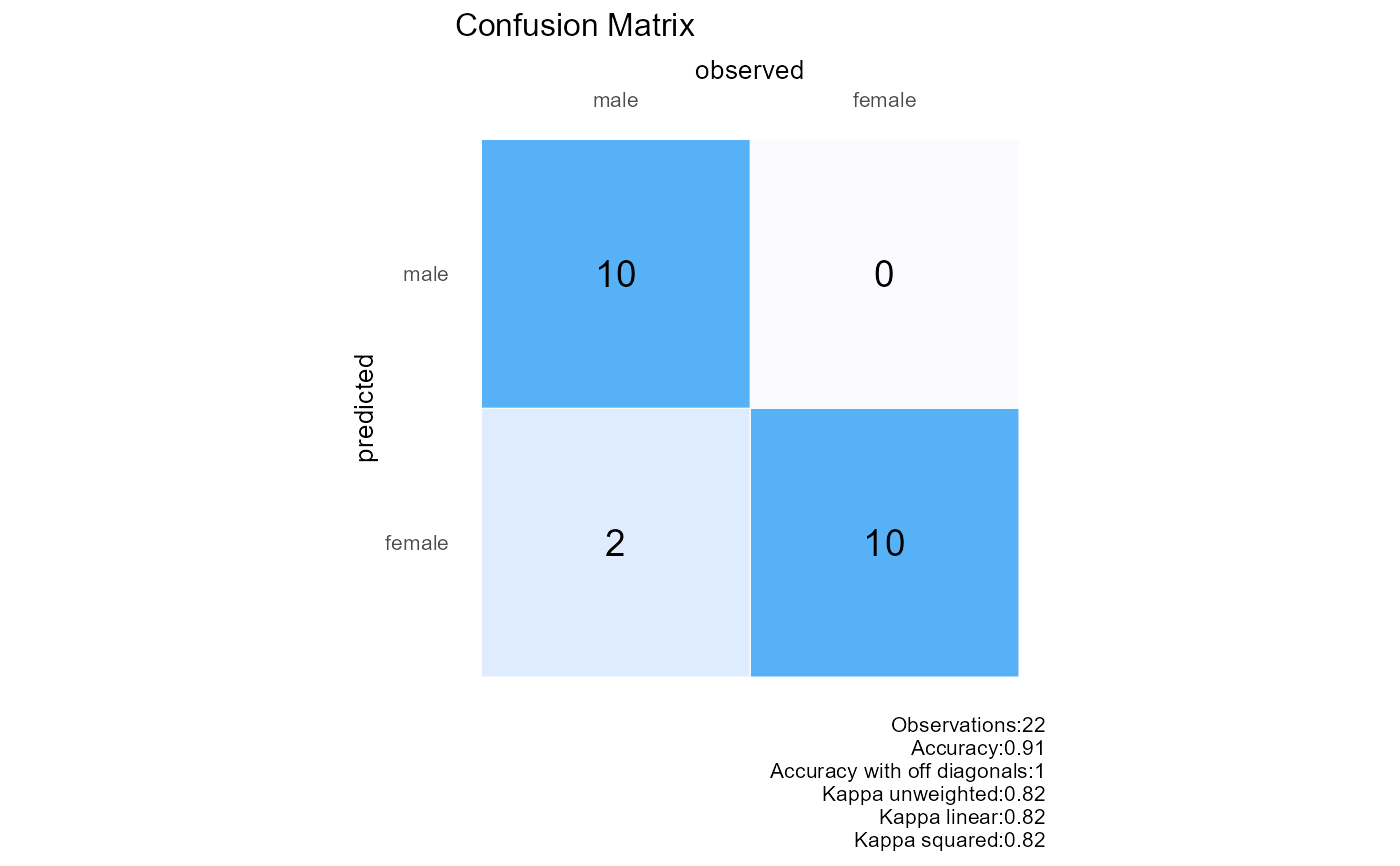
This function creates a confusion matrix plot with observed and predicted outcomes,including row and column percentages,and various accuracy metrics.
Arguments
- observed
Vector of observed outcomes. This can be numeric or factor values representing the true class labels.
- predicted
Vector of predicted outcomes. This should have the same length as the observed vector and represent the predicted class labels.
- base_size
Integer value representing the base font size for the plot. Defaults to 10.
- title
String representing the title of the plot. Defaults to an empty string.
Details
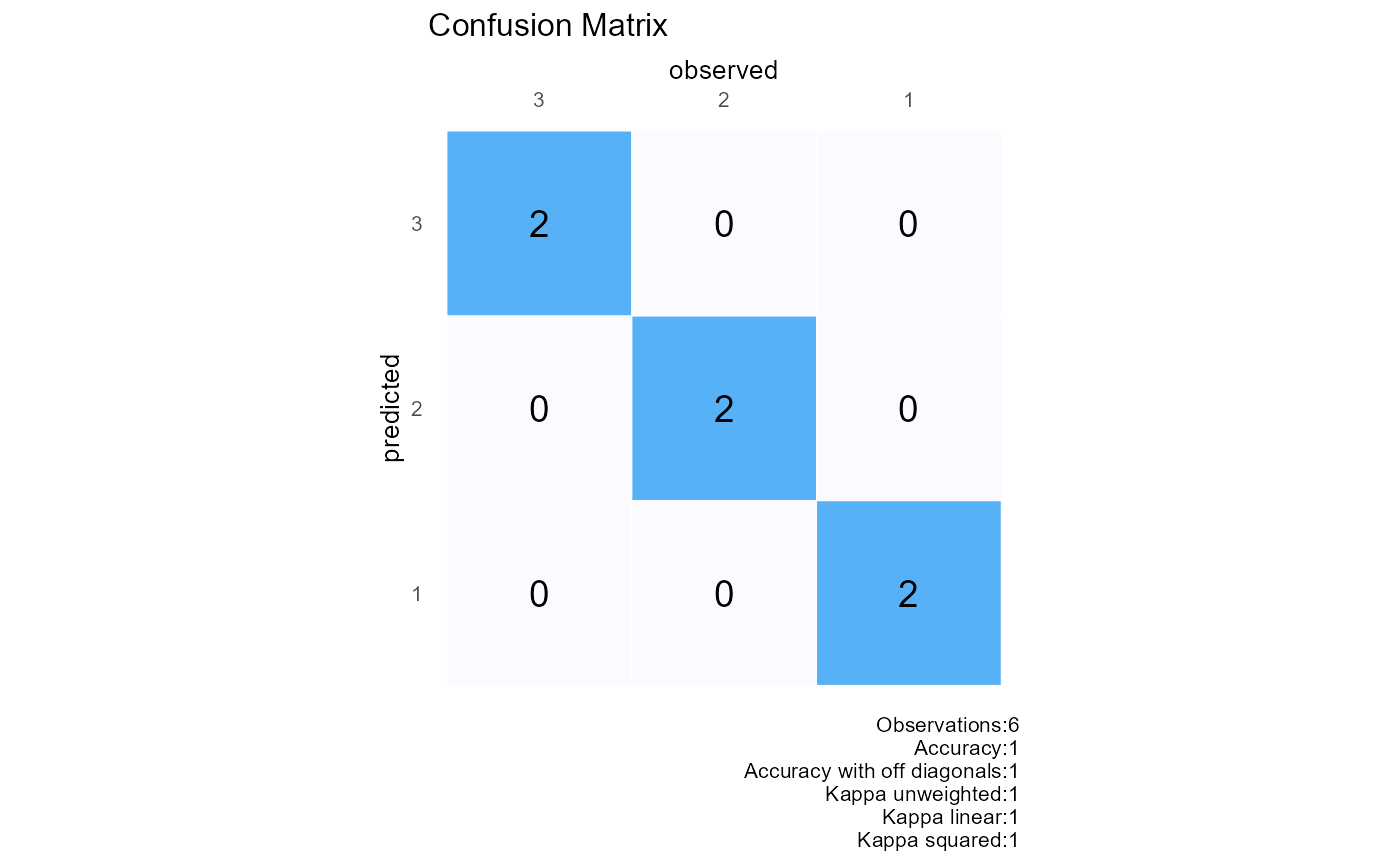
This function generates a confusion matrix plot using ggplot2. It provides a visual representation of the confusion matrix with observed outcomes on the x-axis and predicted outcomes on the y-axis. The cells of the matrix are filled with the count of observations and annotated with the corresponding values.
The plot also includes various accuracy metrics in the caption,such as: -Overall Accuracy: Proportion of correctly classified observations (diagonal elements). -Off-diagonal Accuracy: Proportion of misclassified observations (off-diagonal elements). -Cohen's Kappa (Unweighted,Linear,and Squared): Measures the agreement between observed and predicted outcomes.
Examples
# Example with numeric class labels
plot_confusion(observed=c(1,2,3,1,2,3),predicted=c(1,2,3,1,2,3))
 # Example with factor class labels
observed<-c(rep("male",10),rep("female",10),"male","male")
predicted<-c(rep("male",10),rep("female",10),"female","female")
plot_confusion(observed=observed,predicted=predicted)