Extract and plot variance components from a mixed model
Source:R/GLM_RELIABILITY.R
extract_components.RdExtracts variance components from a mixed linear model fitted
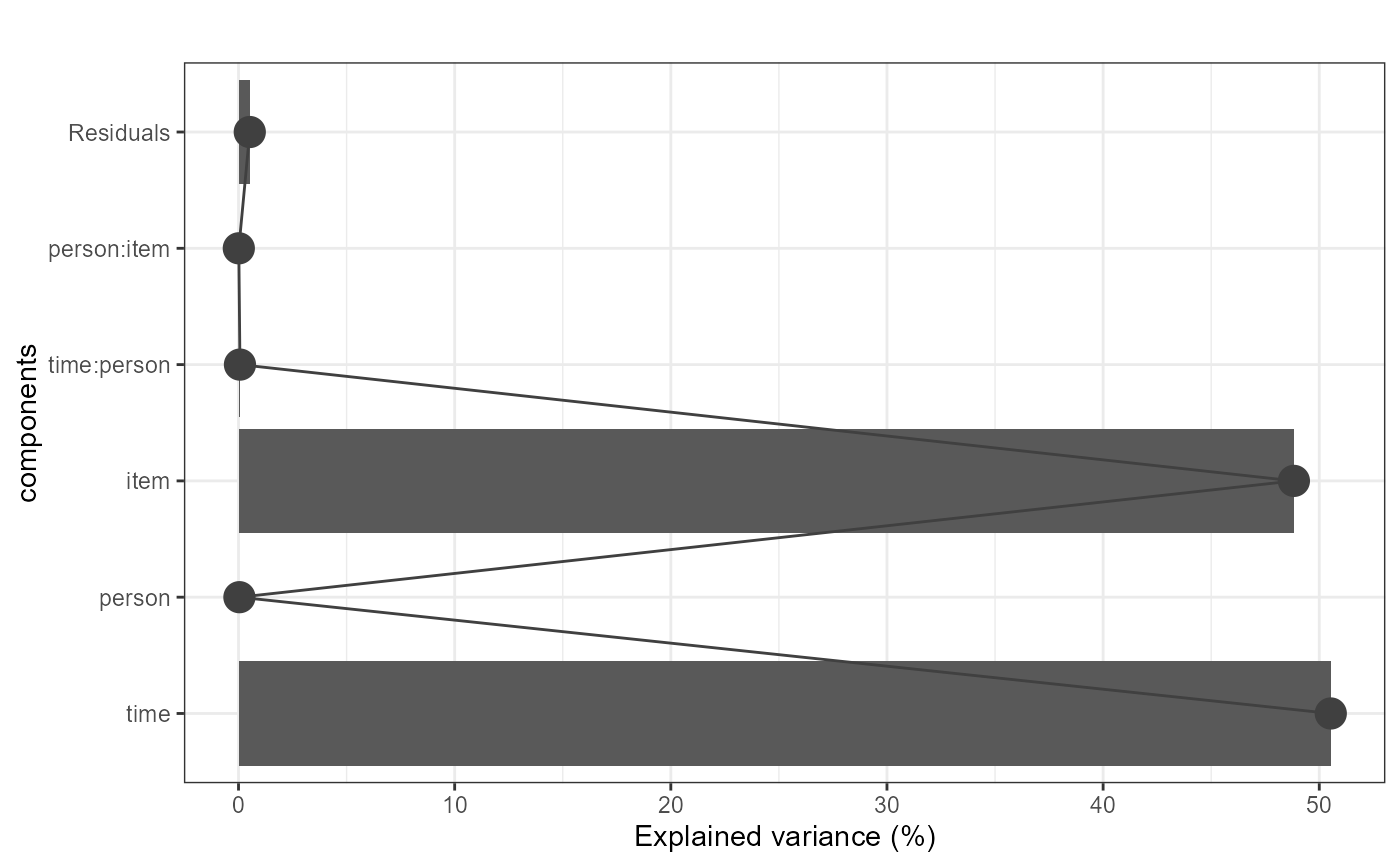
with mixlm::lm() and computes each component's percentage
contribution to total variance. Results are returned as both a summary
data frame and a horizontal bar chart, making it easy to identify which
sources of variance (e.g. person, item, time, interactions) dominate the
measurement design.
Arguments
- model
A mixed model object returned by
mixlm::lm(). The model must include random effects specified withr()so that variance components are available viamixlm::Anova().- title
Character string used as the plot title. Default is
"".
Value
A named list with two elements:
- components
A data frame with one row per variance component containing columns
component(effect name),VC(estimated variance component), andvc_percent(percentage of total absolute variance explained by that component).- plot
A
ggplothorizontal bar chart displayingvc_percentfor each component, with a line and points overlaid to show the profile across components.
Examples
design <- expand.grid(time = 1:3, item = 1:3, person = 1:10)
design <- change_data_type(design, type = "factor")
design$response <- rowSums(change_data_type(design[, 1:2], type = "numeric")) +
rnorm(90, 0, 0.1)
model <- mixlm::lm(response ~ r(time) * r(person) + r(item) * r(person), data = design)
extract_components(model)
#> $components
#> component VC vc_percent
#> 1 time 1.0087172 50.53238
#> 2 person -0.0008239 0.04128
#> 3 item 0.9746568 48.82611
#> 4 time:person 0.0013259 0.06642
#> 5 person:item -0.0002685 0.01345
#> 6 Residuals 0.0103874 0.52036
#>
#> $plot
 #>