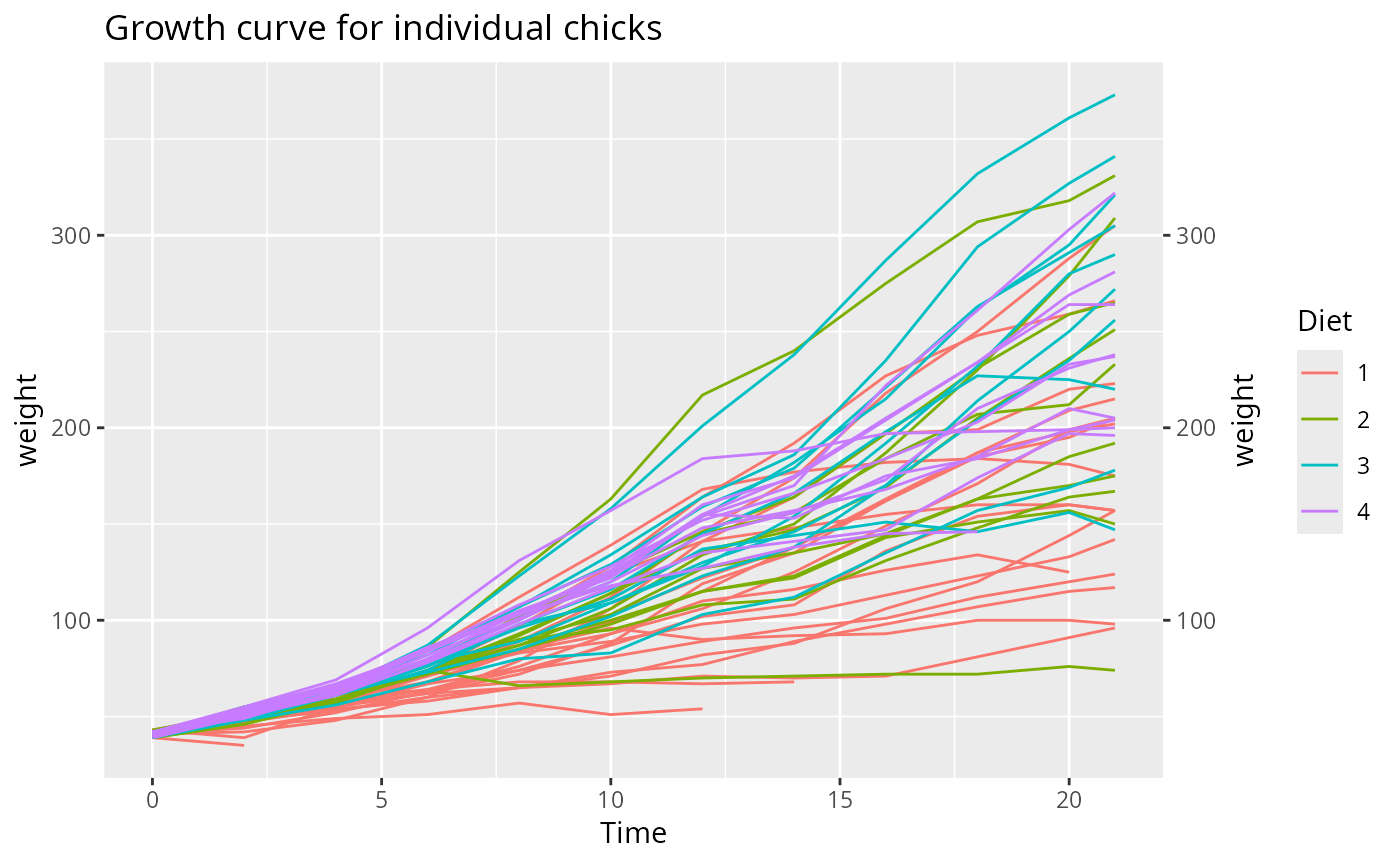
Takes two ggplot objects and renders p1 with the y axis
of p2 mirrored onto the right side. Useful when overlaying two
series with different scales or simply to frame the plot with matching
axes on both sides.
Arguments
- p1
A ggplot object. This plot is drawn with the duplicated right axis.
- p2
A ggplot object whose left y axis is mirrored to the right of
p1. Typically the same as p1.
Value
Invisibly returns NULL. The combined plot is drawn to the
current graphics device.
Examples
p1 <- ggplot(ChickWeight, aes(x=Time, y=weight, colour=Diet, group=Chick)) +
  geom_line() +
  ggtitle("Growth curve for individual chicks")
duplicate_y_axis(p1=p1, p2=p1)